Copyright
©2010 Baishideng.
World J Gastroenterol. Jan 14, 2010; 16(2): 156-166
Published online Jan 14, 2010. doi: 10.3748/wjg.v16.i2.156
Published online Jan 14, 2010. doi: 10.3748/wjg.v16.i2.156
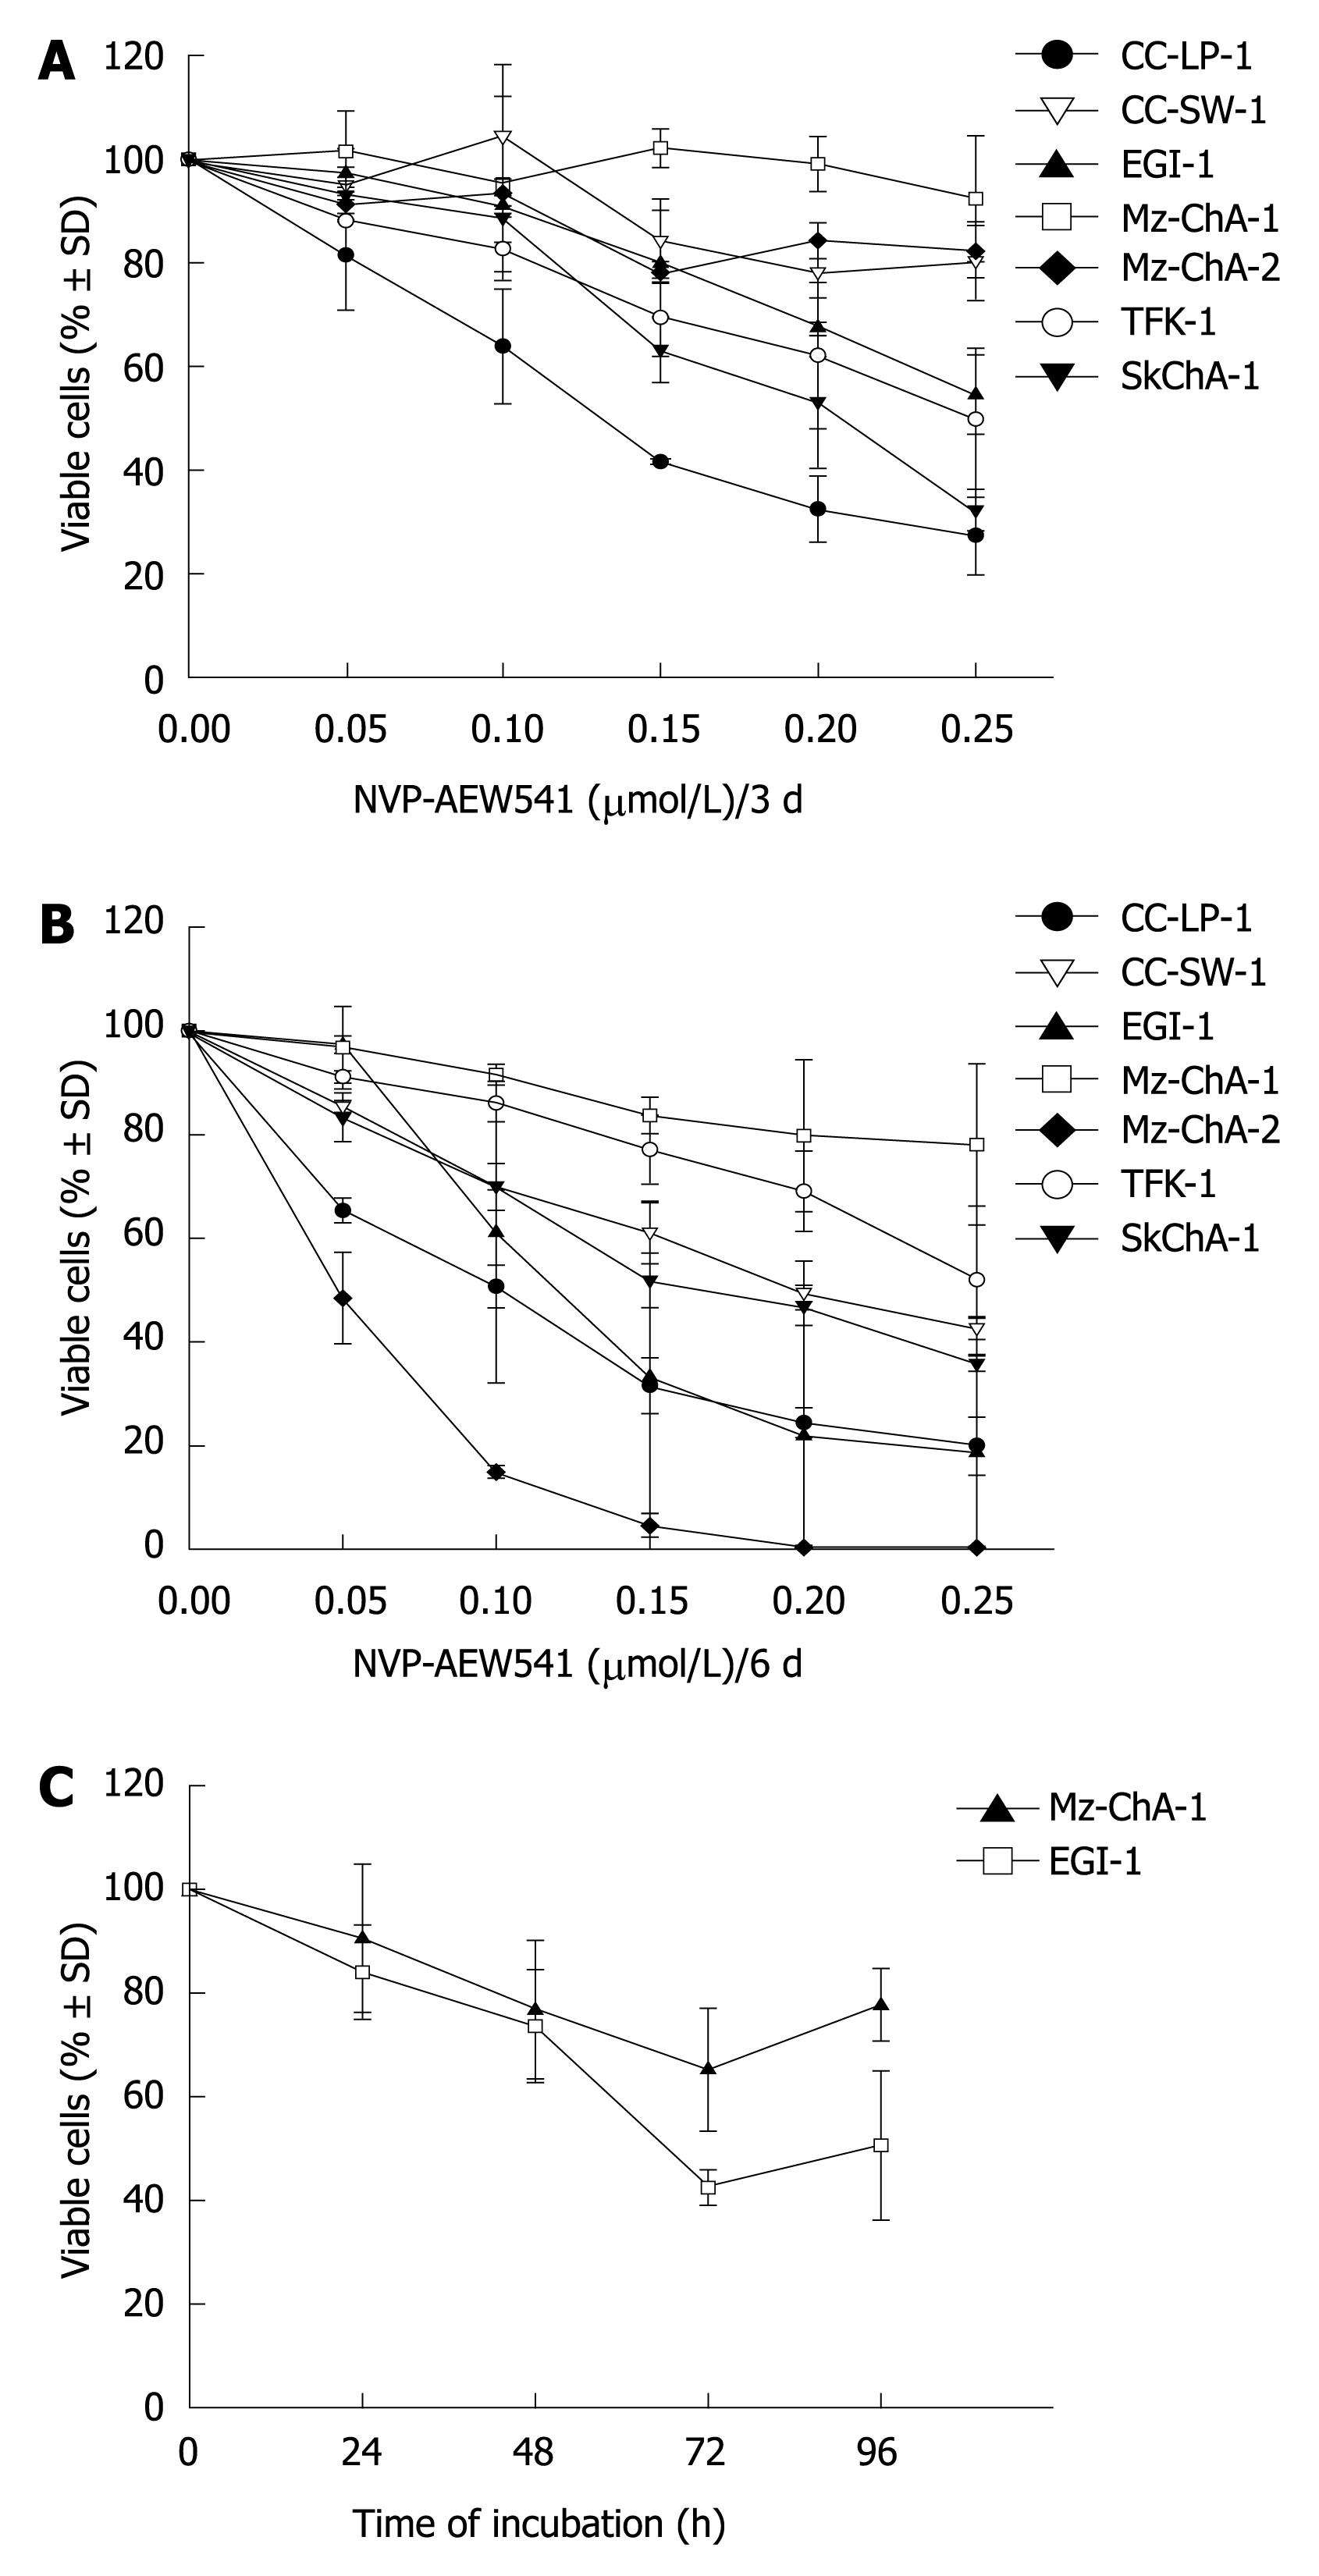
Figure 1 In vitro cell growth inhibition.
A: Treatment of seven human biliary tract cancer cell lines with NVP-AEW541 for 3 d (n = 3); B: 6 d incubation (n = 3); C: Incubation of selected cell lines EGI-1 and Mz-ChA-1 with calculated IC50 for 24-96 h (n = 3). Error bars represent SD.
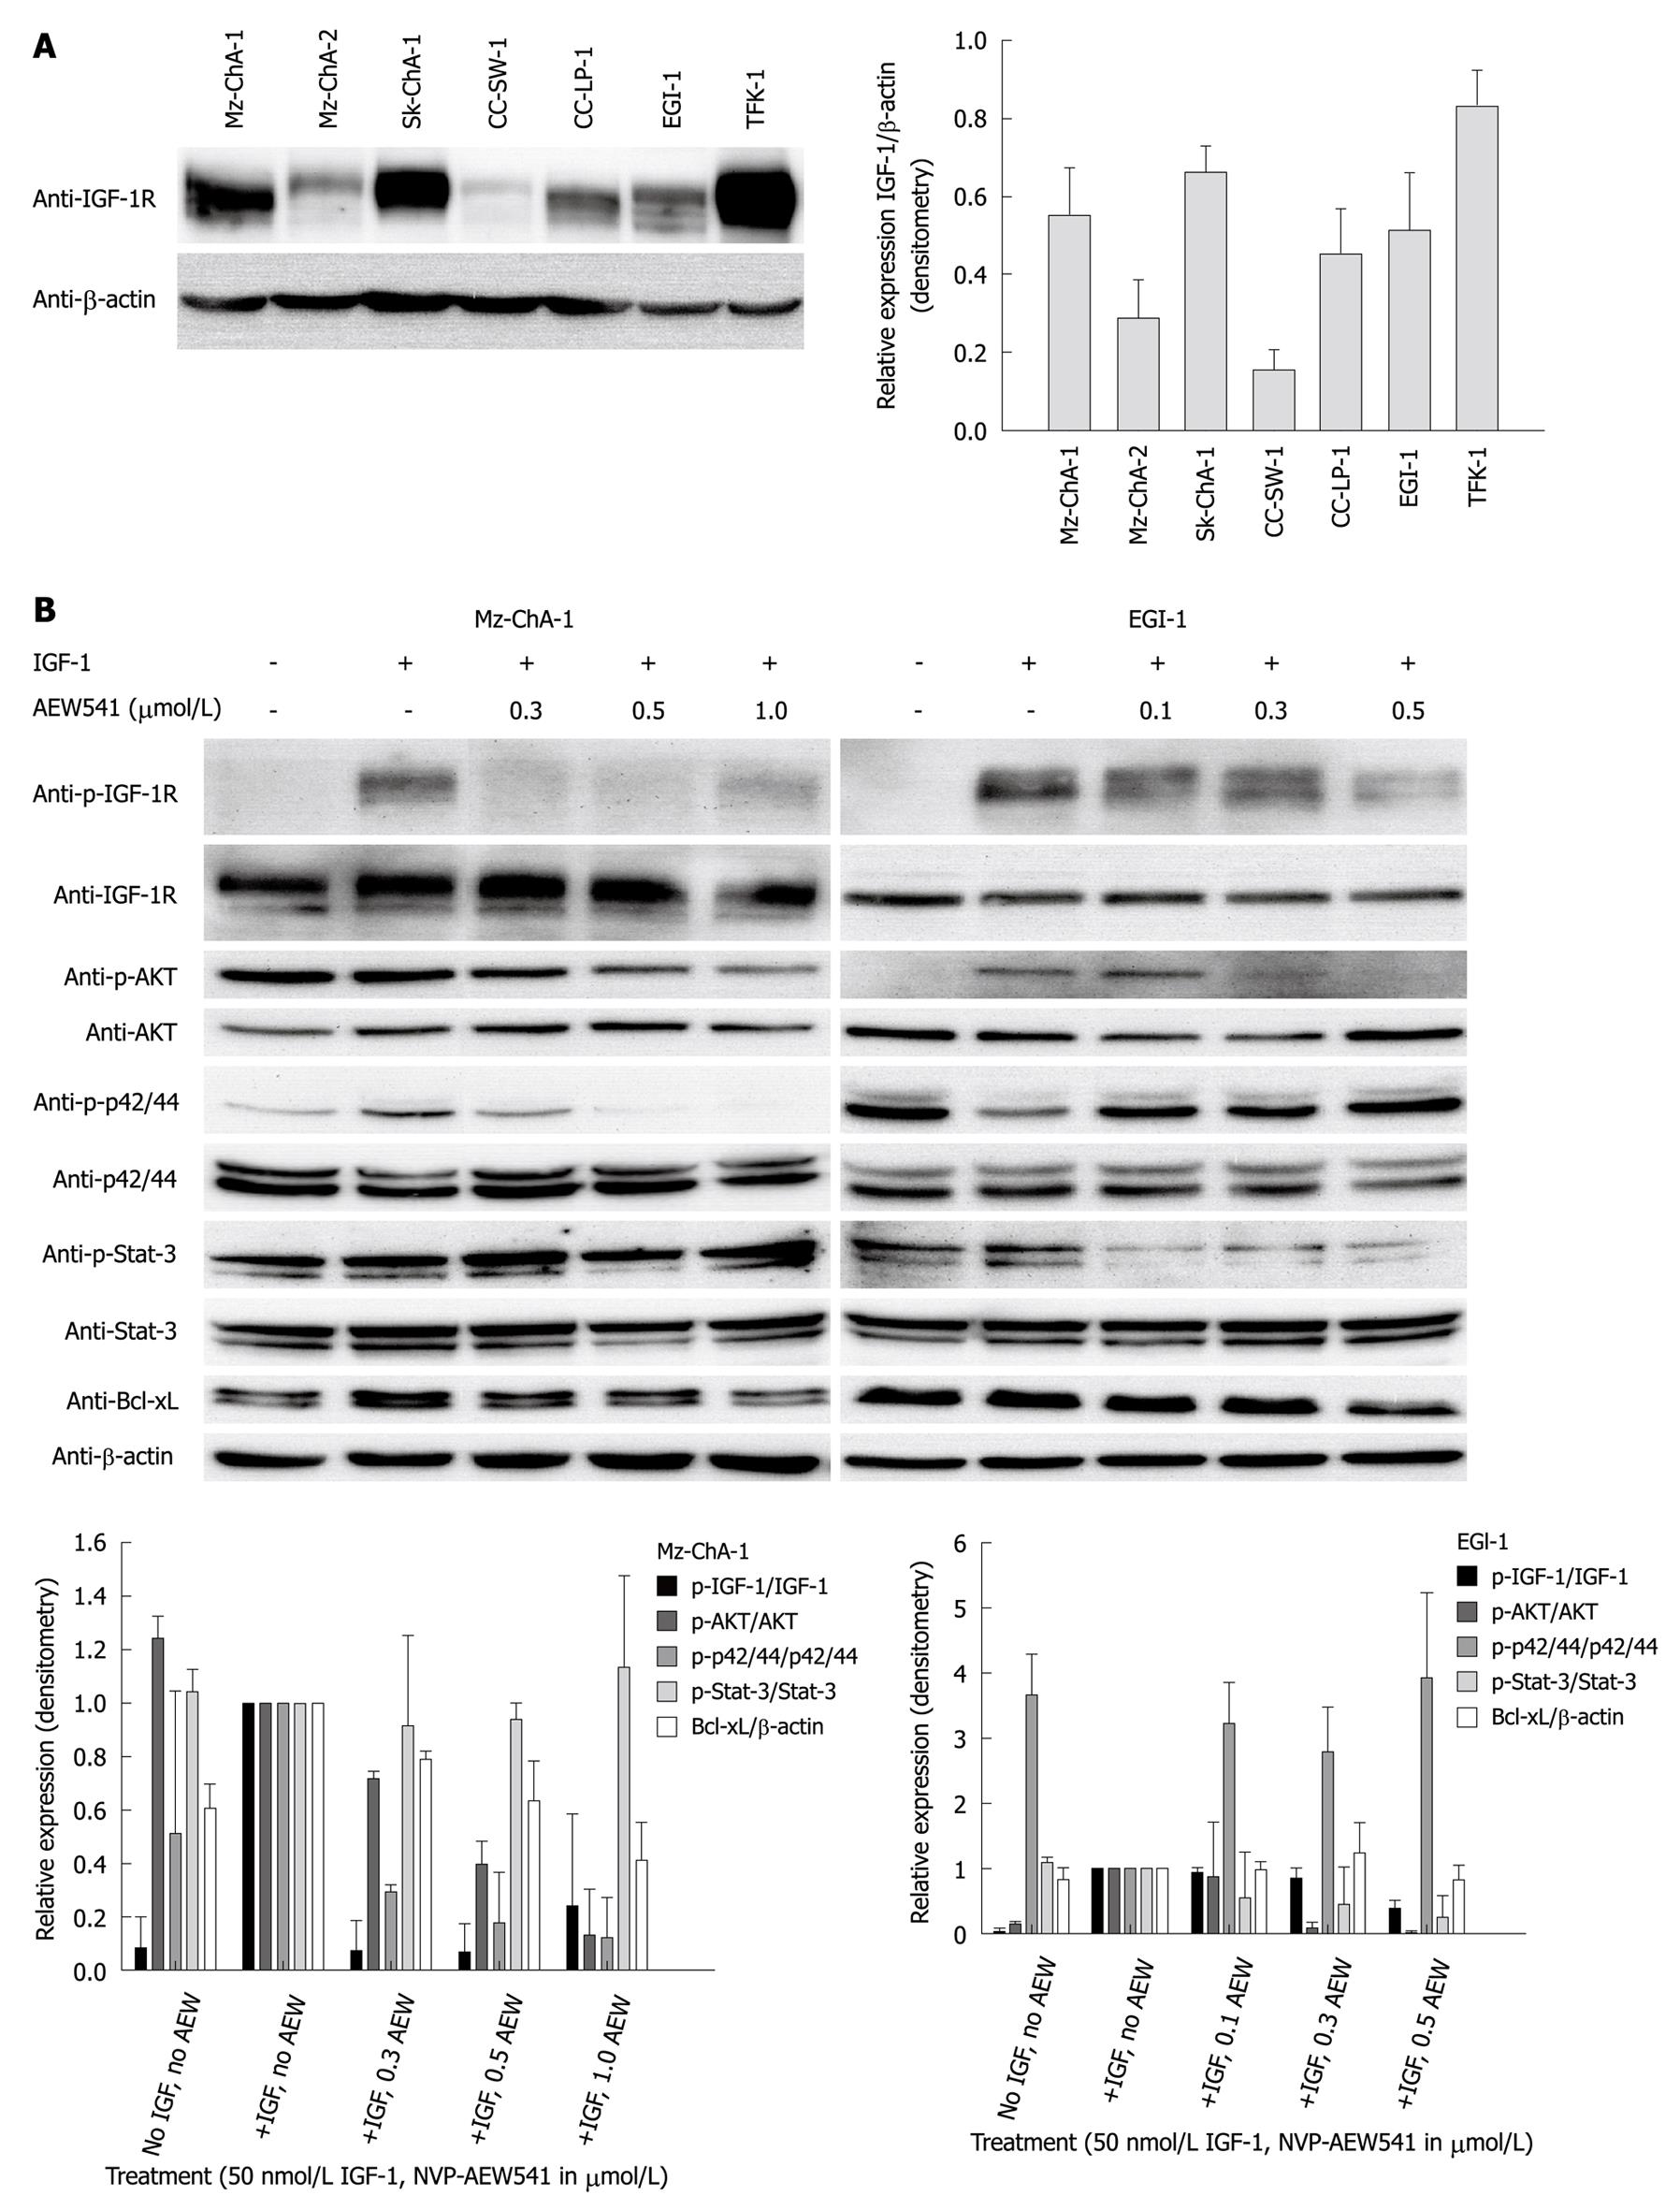
Figure 2 Mechanism of NVP-AEW541 drug action.
A: Protein expression of IGF-1R in tested human biliary tract cancer cell lines was determined by immunoblot; B: p-IGF-1R, IGF-1R, p-AKT, AKT, p-p42/44, p42/44, p-Stat-3, Stat-3, and Bcl-xL protein levels were examined by immunoblot for selected cell lines EGI-1 and Mz-ChA-1. After 24 h of starvation, cell lines EGI-1 and Mz-ChA-1 were treated with NVP-AEW541 (12 h prior to lysis) and stimulated with ligand IGF-1 (30 min prior to lysis). β-actin served as loading control in all experiments. Densitometry was performed to analyze results which are shown relative to lane 2 as standard.
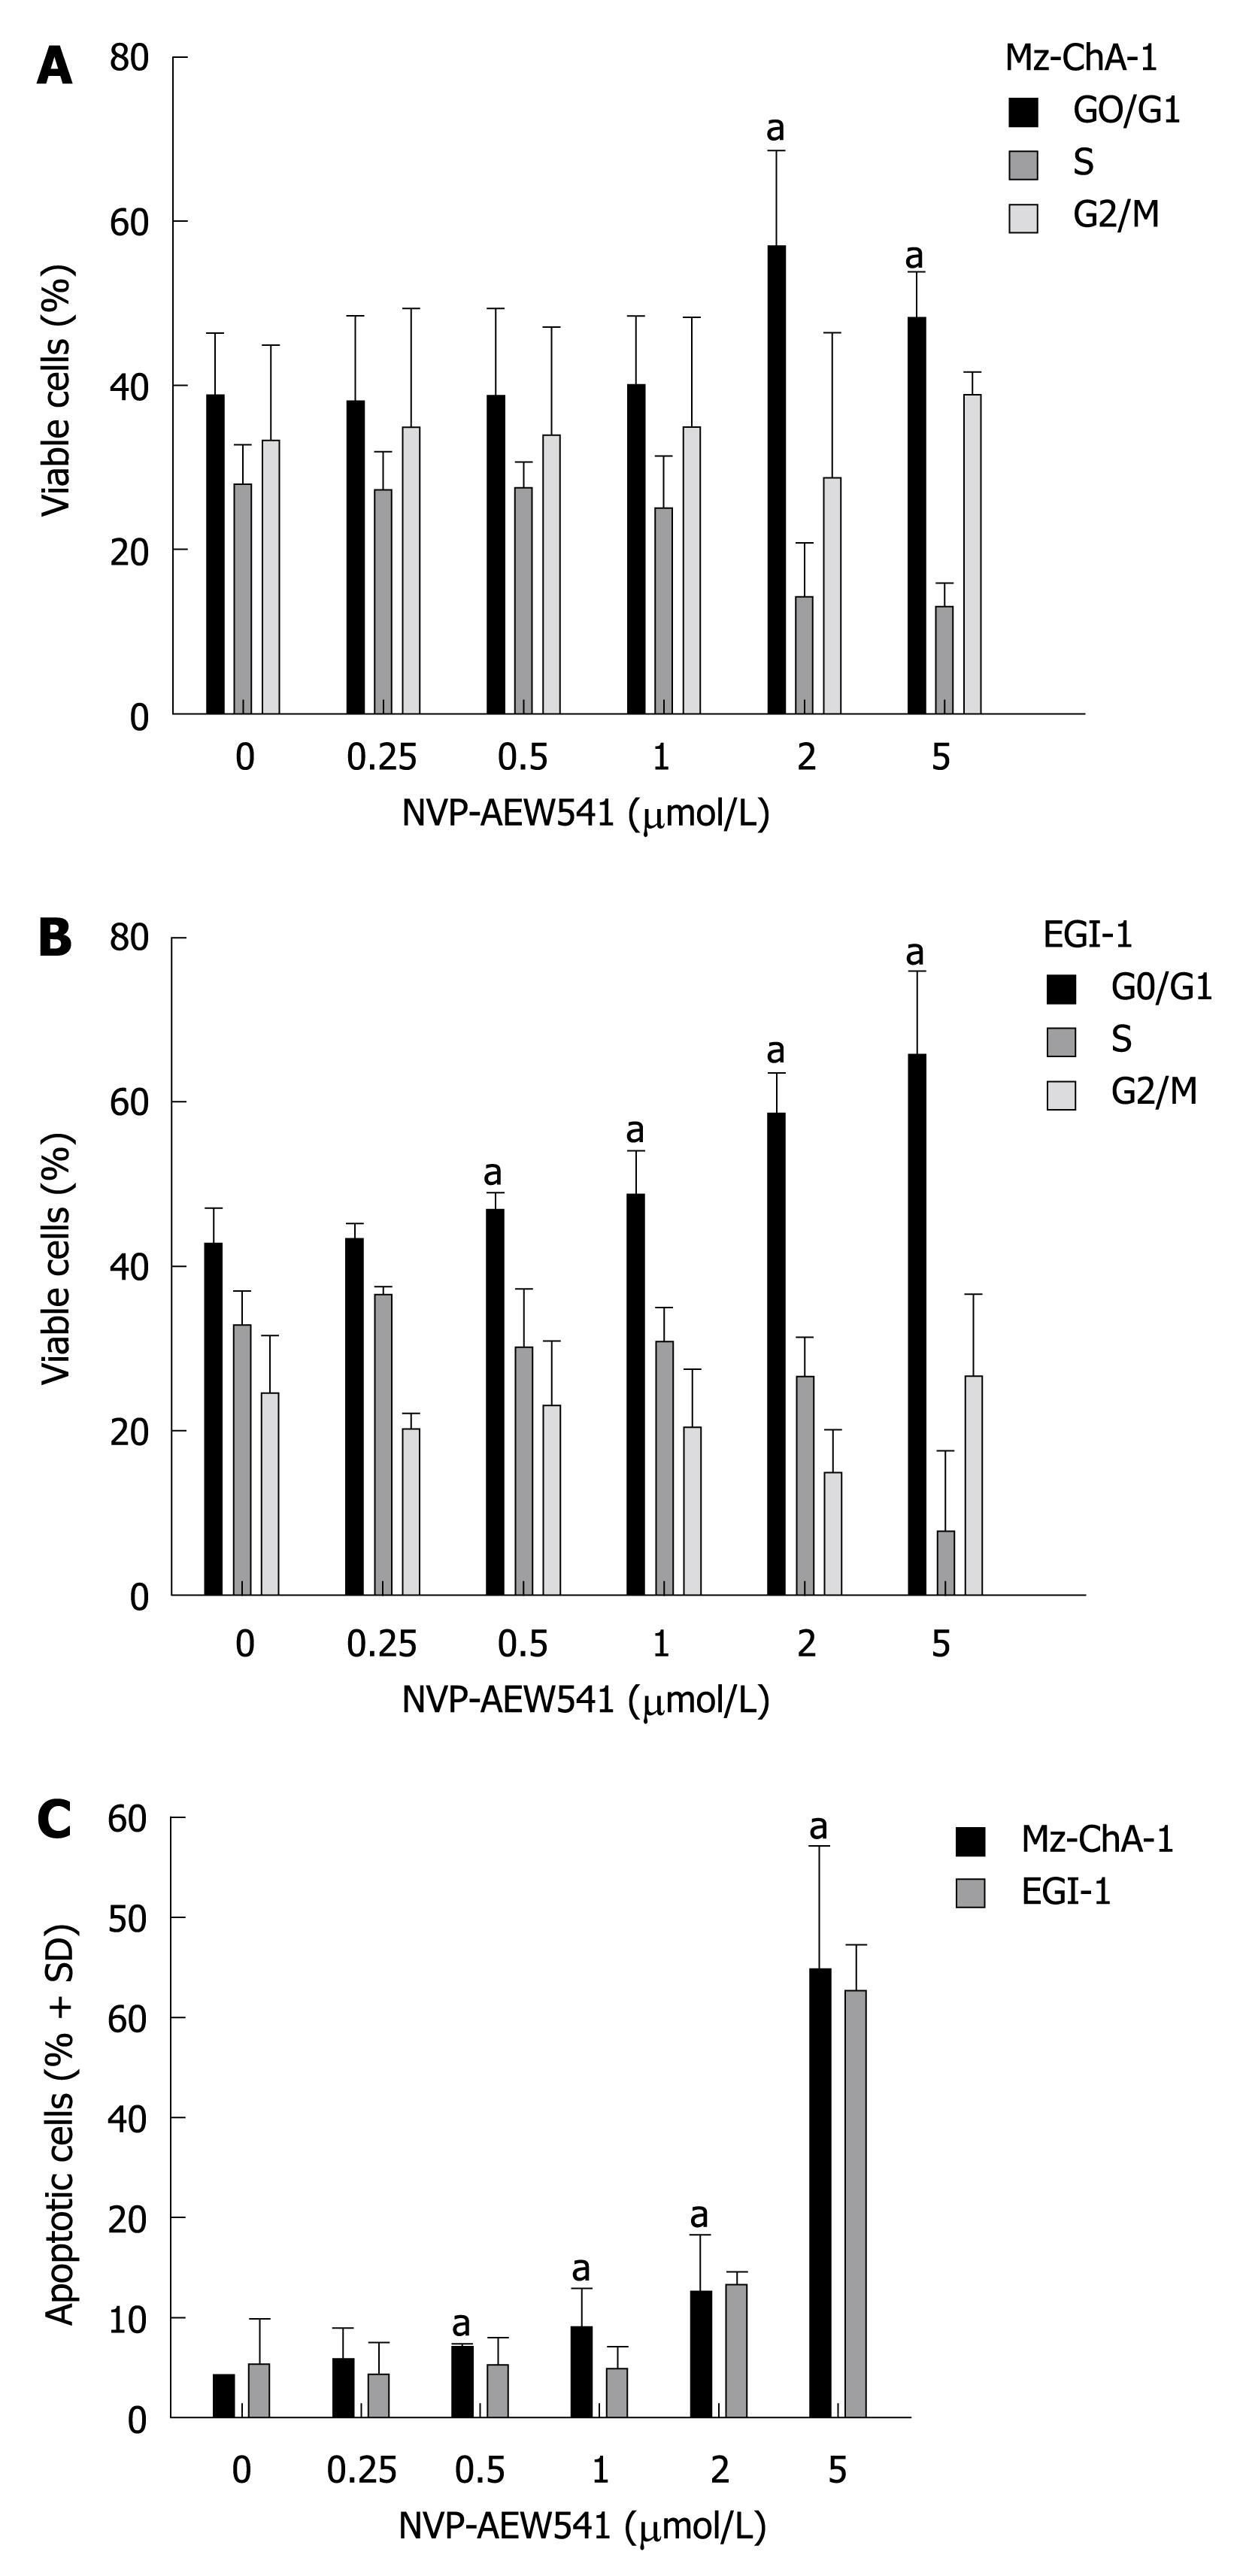
Figure 3 Cell cycle analysis.
A: In vitro treatment of selected cell line EGI-1 with NVP-AEW541 for 36 h (n = 3); B: In vitro treatment of selected cell line Mz-ChA-1 (n = 3). Cells were stained with propidium iodide and analyzed by flow cytometry. ModFitLT 2.0 software was used to determine cell cycle proportions according to cellular DNA content; doublets were excluded by gating for width of fluorescence signal (FL2-W) (aP < 0.05 for G0/G1 fraction, treated cells vs control); C: Cells having less than single DNA content (sub-G1 fraction) were presumed to be apoptotic (n = 3) (aP < 0.05, treated cells vs control; error bars represent SD).
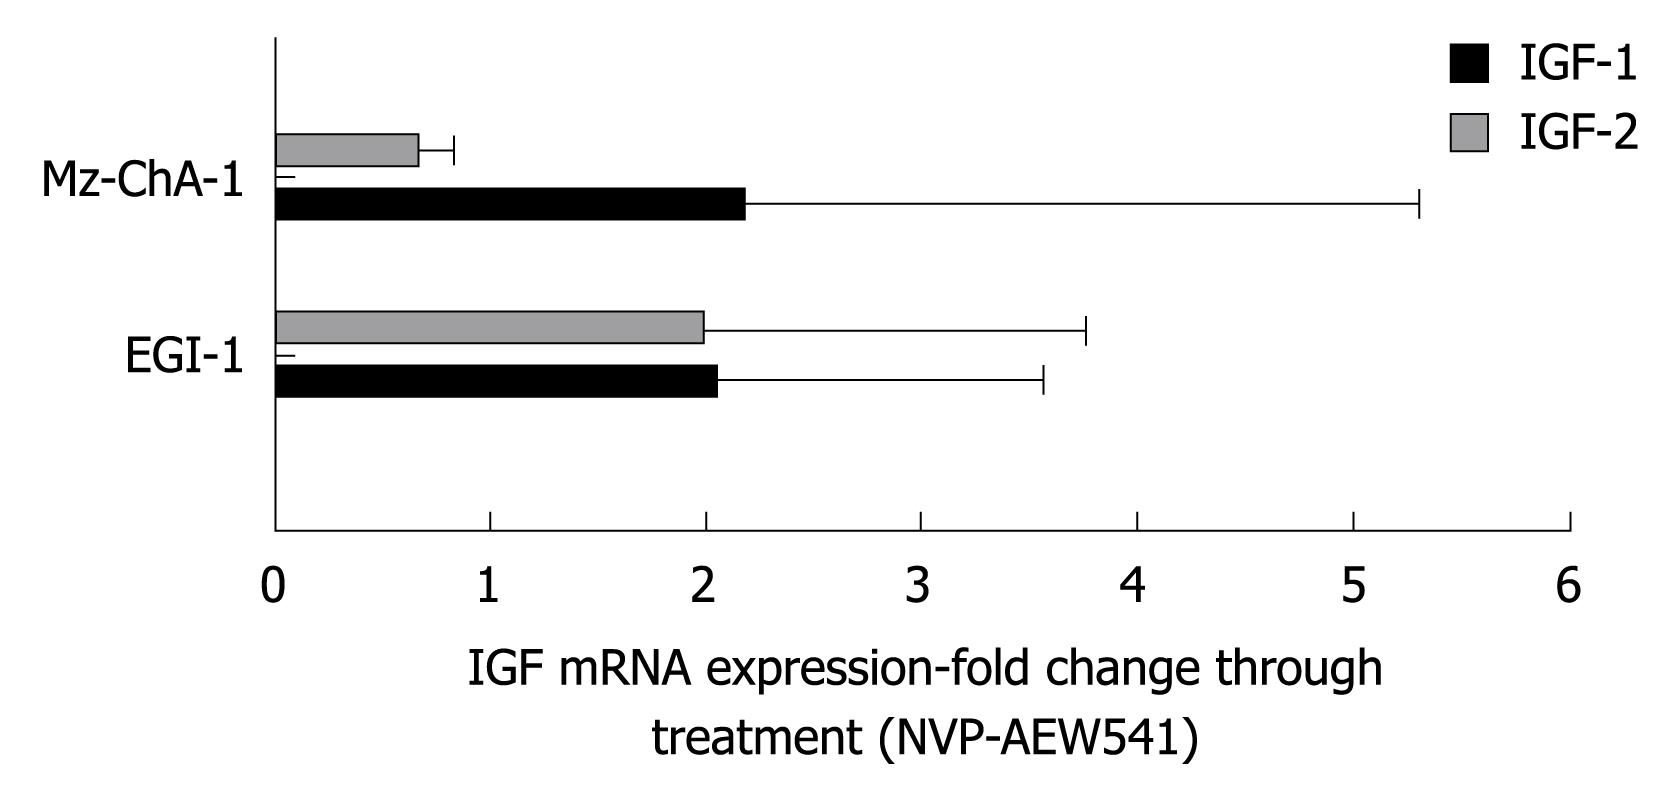
Figure 4 Influence of NVP-AEW541 (3 d treatment with calculated IC50) on mRNA expression of IGF-1R ligands IGF-1 and IGF-2 in two of the tested cell lines.
Ratio of IGF mRNA expression in treated vs untreated cell lines is shown (n = 3).
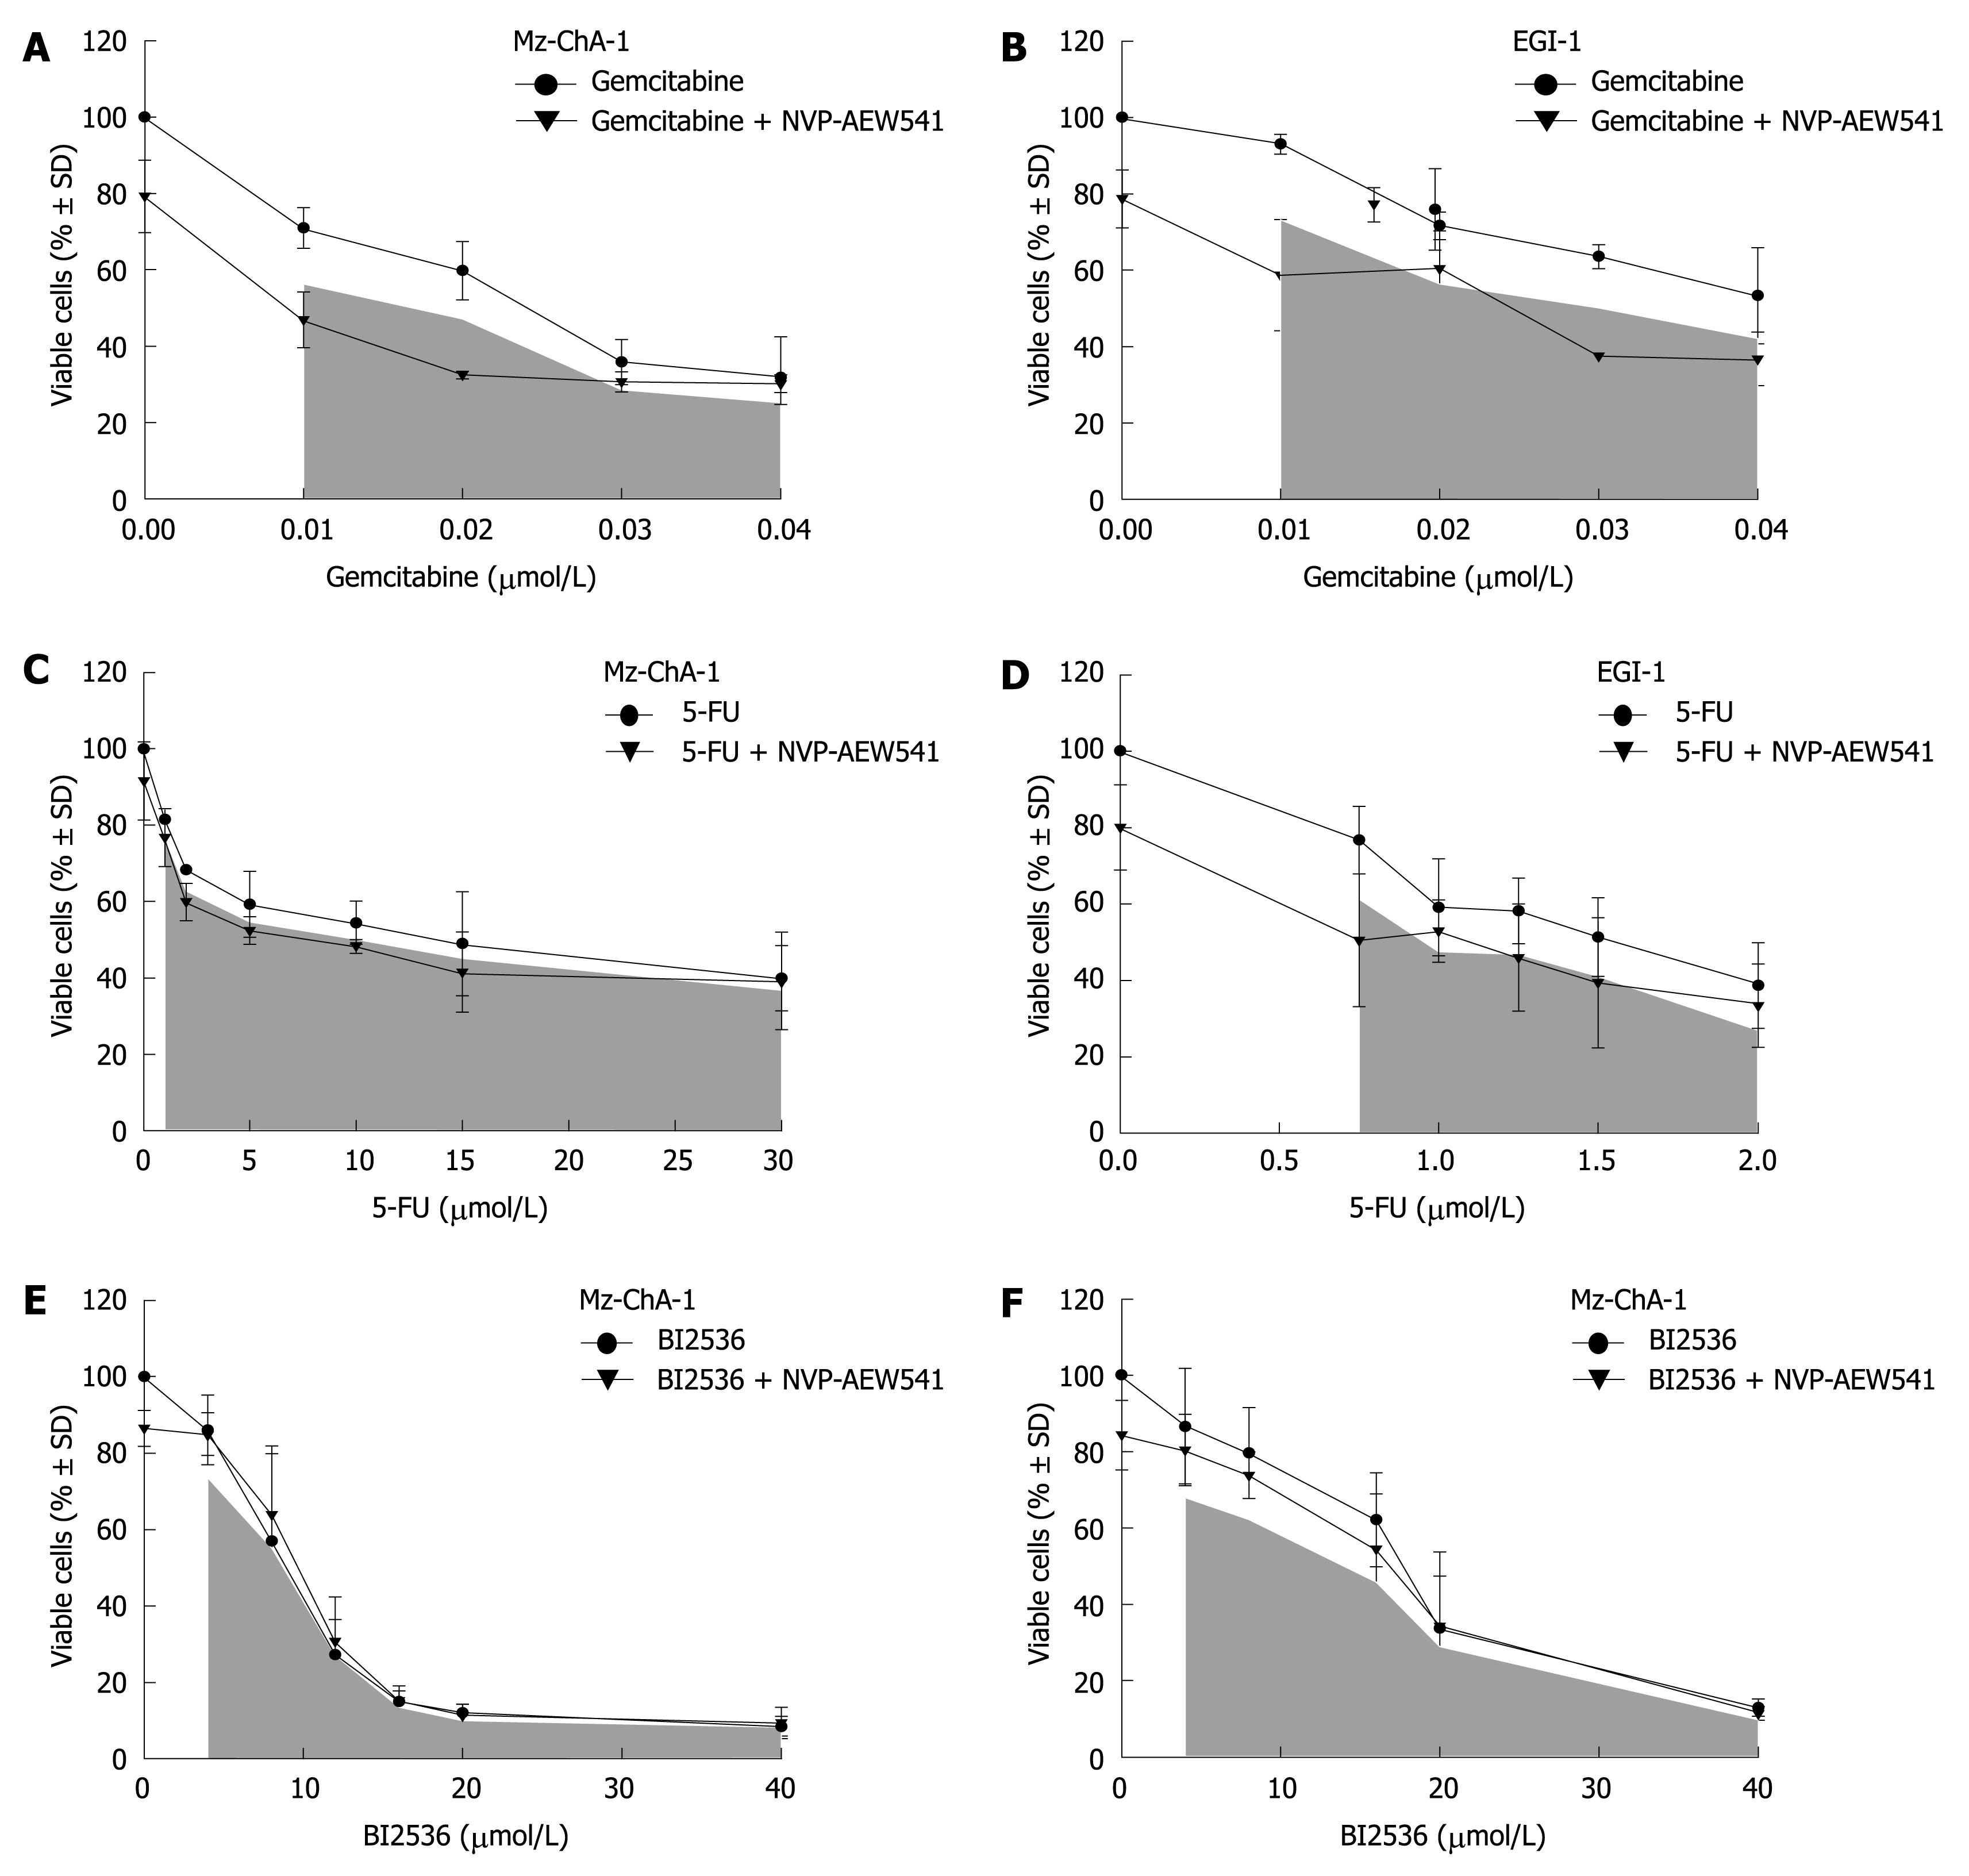
Figure 5 In vitro treatment with drug combinations of NVP-AEW541 and gemcitabine, 5-fluorouracil (5-FU) or BI 2536.
Selected cell lines EGI-1 and Mz-ChA-1 were incubated with increasing concentrations of gemcitabine (A, B), 5-FU (C, D) or BI 2536 (E, F) alone (black circles) and in combination with fixed IC20 concentration of NVP-AEW541 (black triangles). The shaded area represents a possible drug synergism calculated according to the model of Berenbaum[50]; error bars represent SD (n = 3).
- Citation: Wolf S, Lorenz J, Mössner J, Wiedmann M. Treatment of biliary tract cancer with NVP-AEW541: Mechanisms of action and resistance. World J Gastroenterol 2010; 16(2): 156-166
- URL: https://www.wjgnet.com/1007-9327/full/v16/i2/156.htm
- DOI: https://dx.doi.org/10.3748/wjg.v16.i2.156


