Copyright
©2009 The WJG Press and Baishideng.
World J Gastroenterol. Dec 7, 2009; 15(45): 5700-5705
Published online Dec 7, 2009. doi: 10.3748/wjg.15.5700
Published online Dec 7, 2009. doi: 10.3748/wjg.15.5700
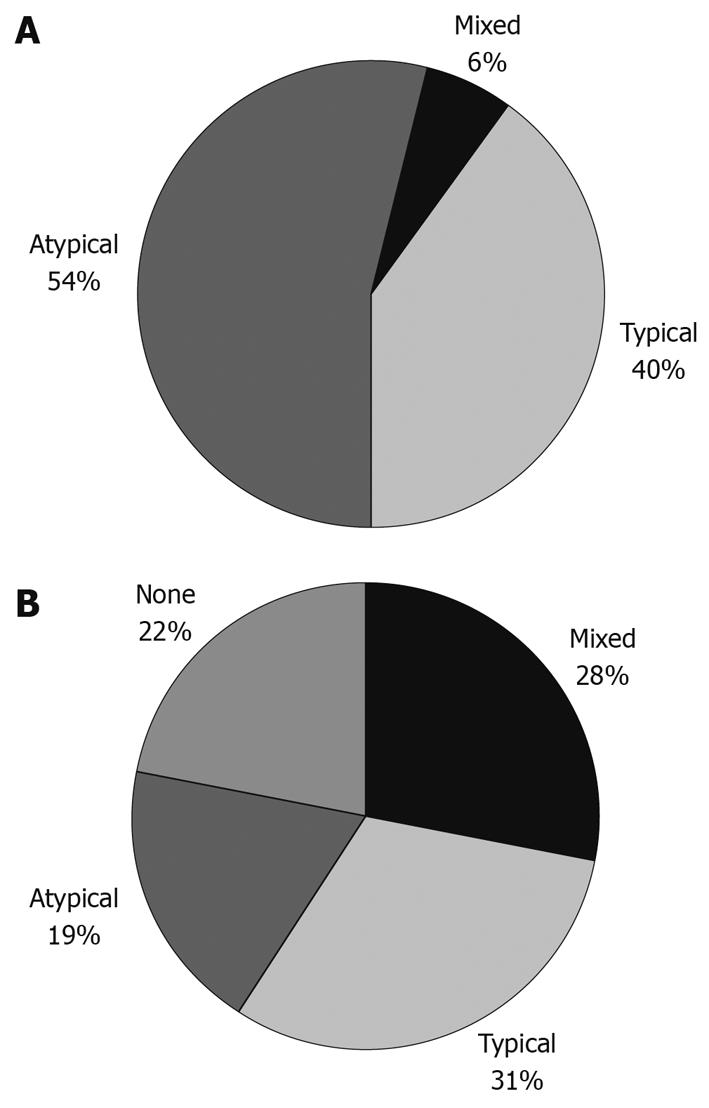
Figure 1 Distribution of gastro-esophageal reflux disease (GERD) symptoms at baseline (A) and at follow-up (B).
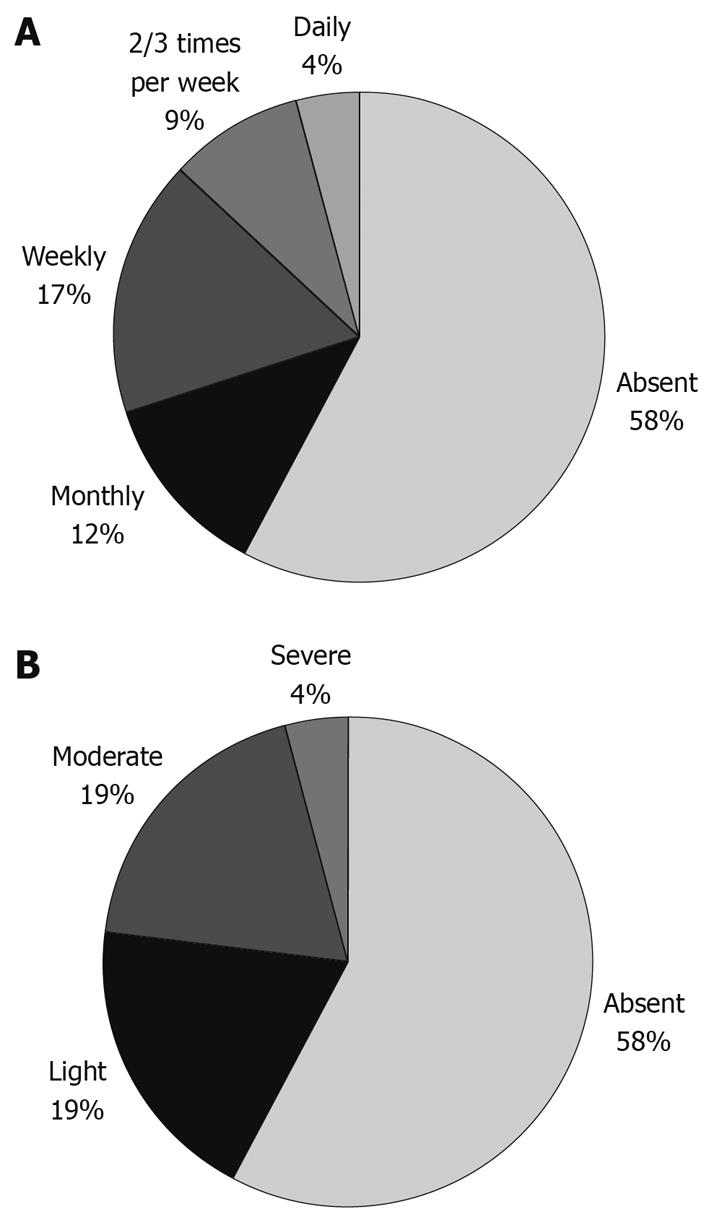
Figure 2 Frequency (A) and severity (B) of heartburn at follow-up.
Light: Not interfering with day or night activities; Moderate: Interfering with day or night activities, but bearable; Severe: Unbearable.
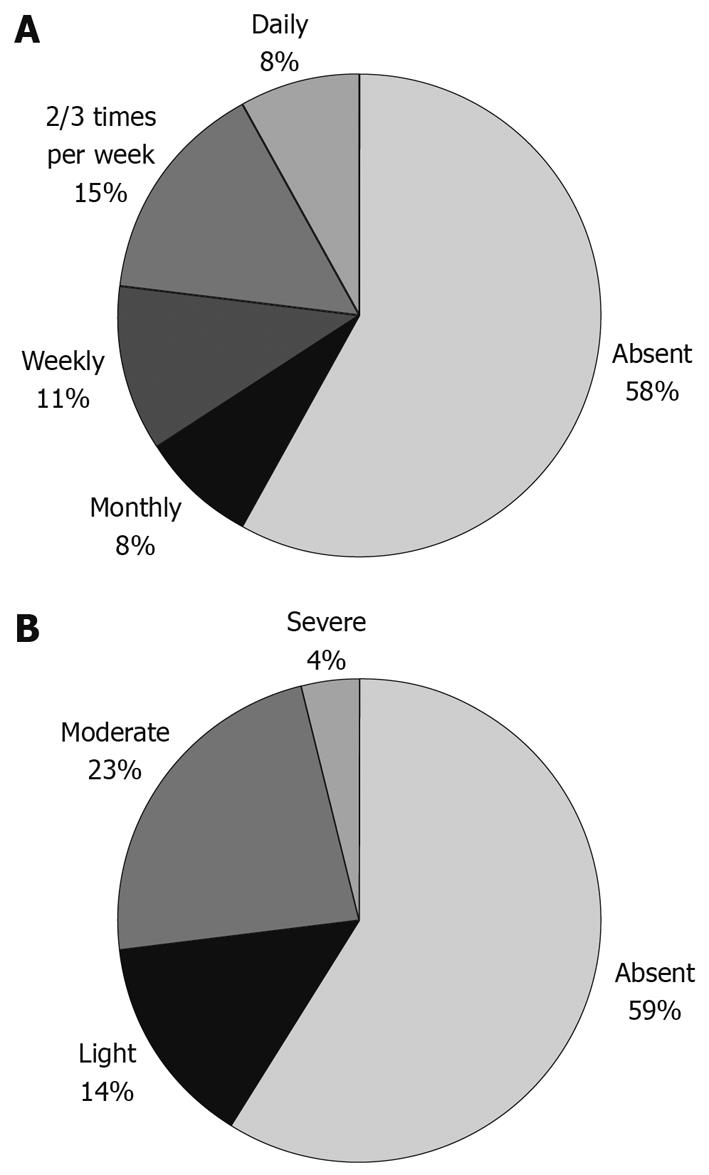
Figure 3 Frequency (A) and severity (B) of regurgitation at follow-up.
For explanation of definitions, see legend of Figure 2.
- Citation: Pace F, Pallotta S, Manes G, de Leone A, Zentilin P, Russo L, Savarino V, Neri M, Grossi E, Cuomo R. Outcome of nonerosive gastro-esophageal reflux disease patients with pathological acid exposure. World J Gastroenterol 2009; 15(45): 5700-5705
- URL: https://www.wjgnet.com/1007-9327/full/v15/i45/5700.htm
- DOI: https://dx.doi.org/10.3748/wjg.15.5700


