Copyright
©2009 The WJG Press and Baishideng.
World J Gastroenterol. Nov 21, 2009; 15(43): 5409-5417
Published online Nov 21, 2009. doi: 10.3748/wjg.15.5409
Published online Nov 21, 2009. doi: 10.3748/wjg.15.5409
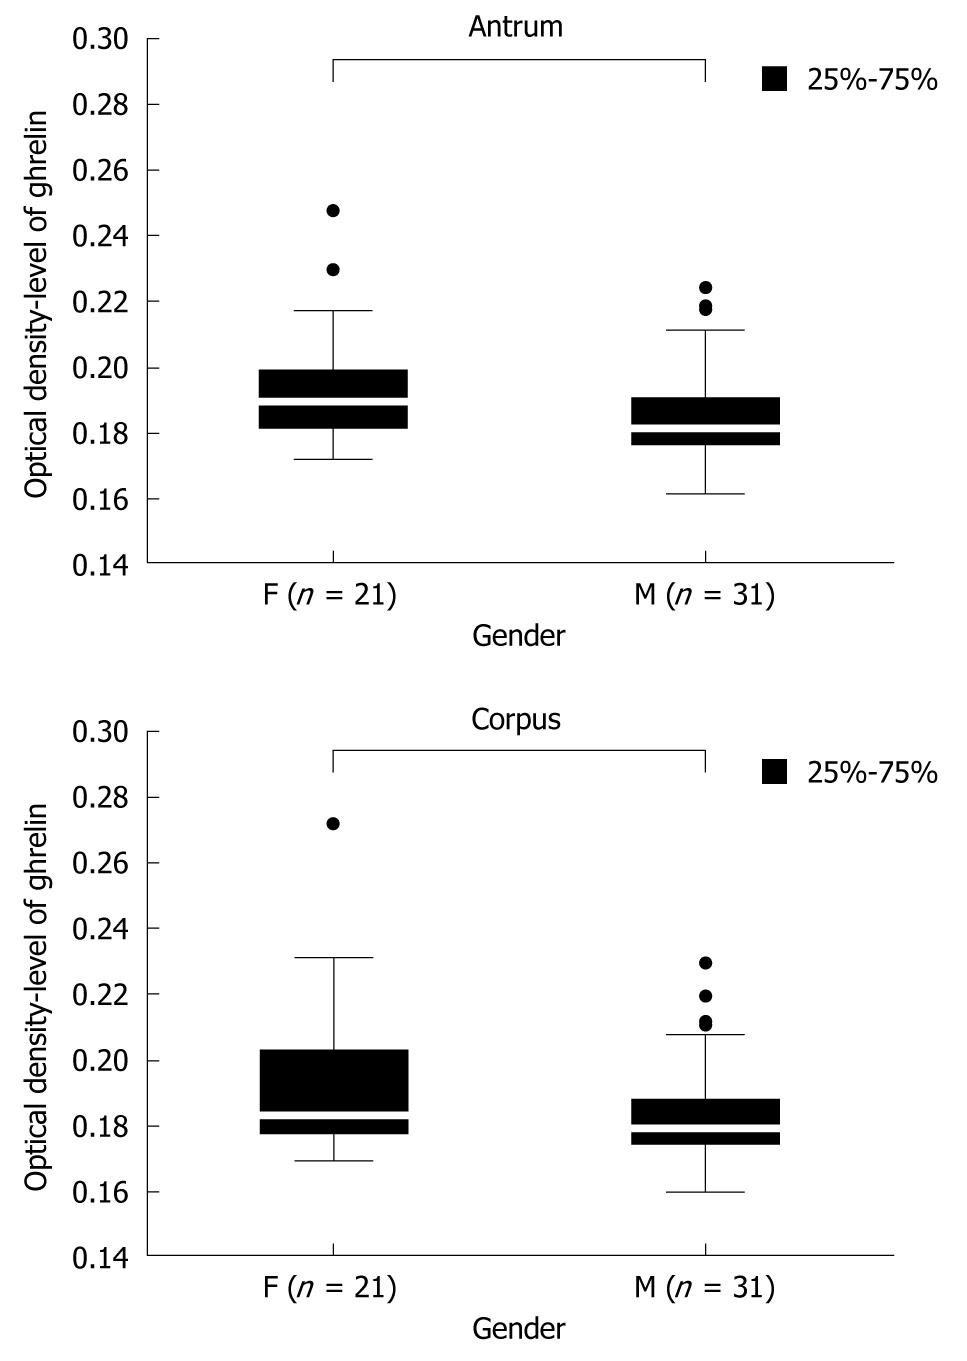
Figure 1 Ghrelin levels in gastric biopsy specimens from the antrum and corpus of patients without H pylori infection.
The numbers (n) of female (F) and male (M) patients are given.
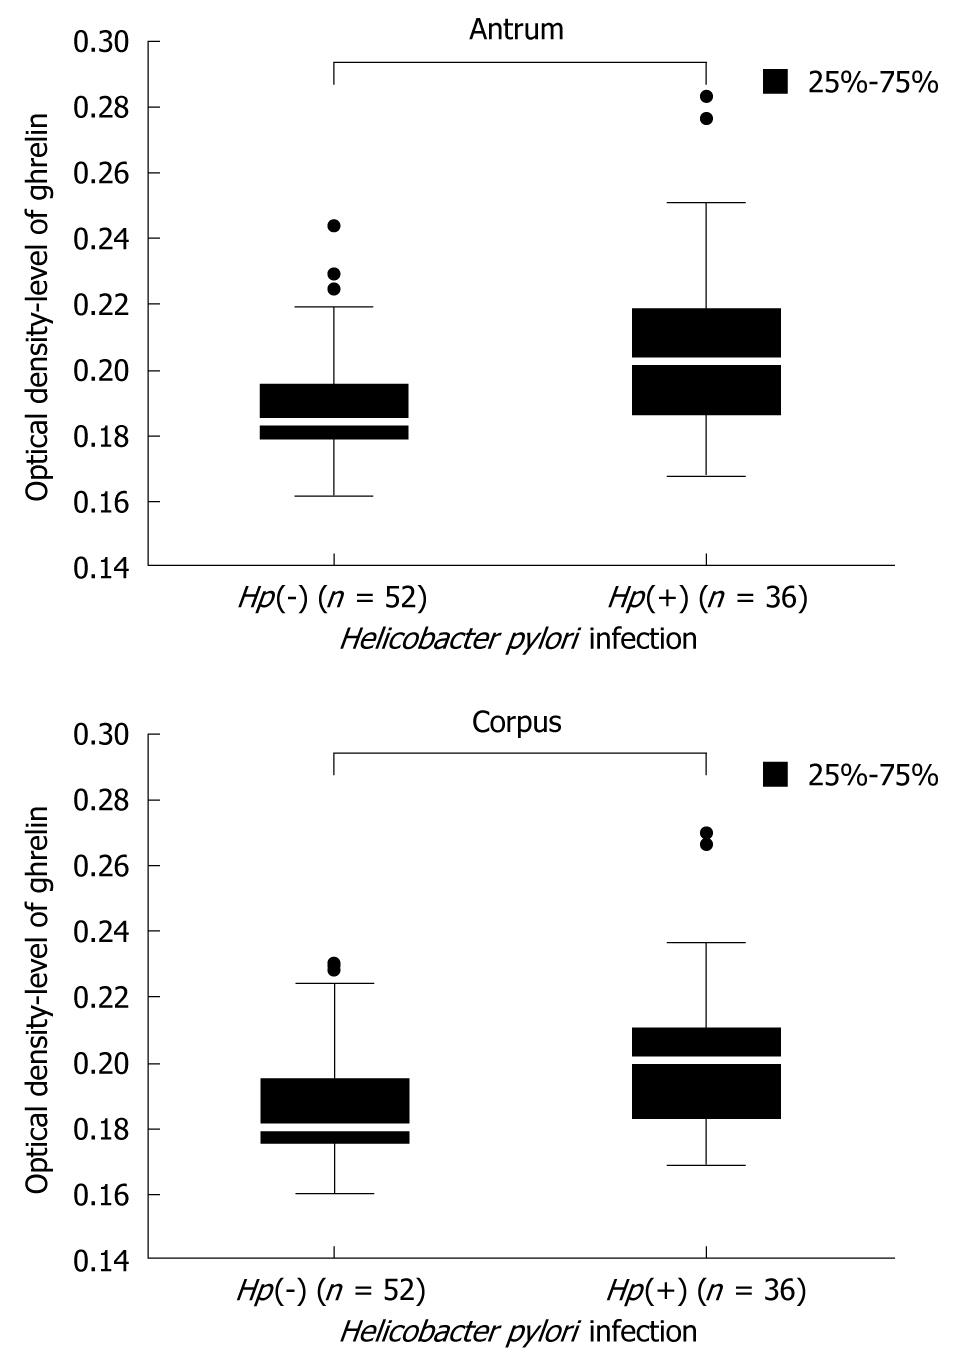
Figure 2 Comparison of ghrelin level in H pylori negative [Hp(-)] and H pylori positive [Hp(+)] samples from the antrum and corpus of all screened patients.
Population numbers are given.
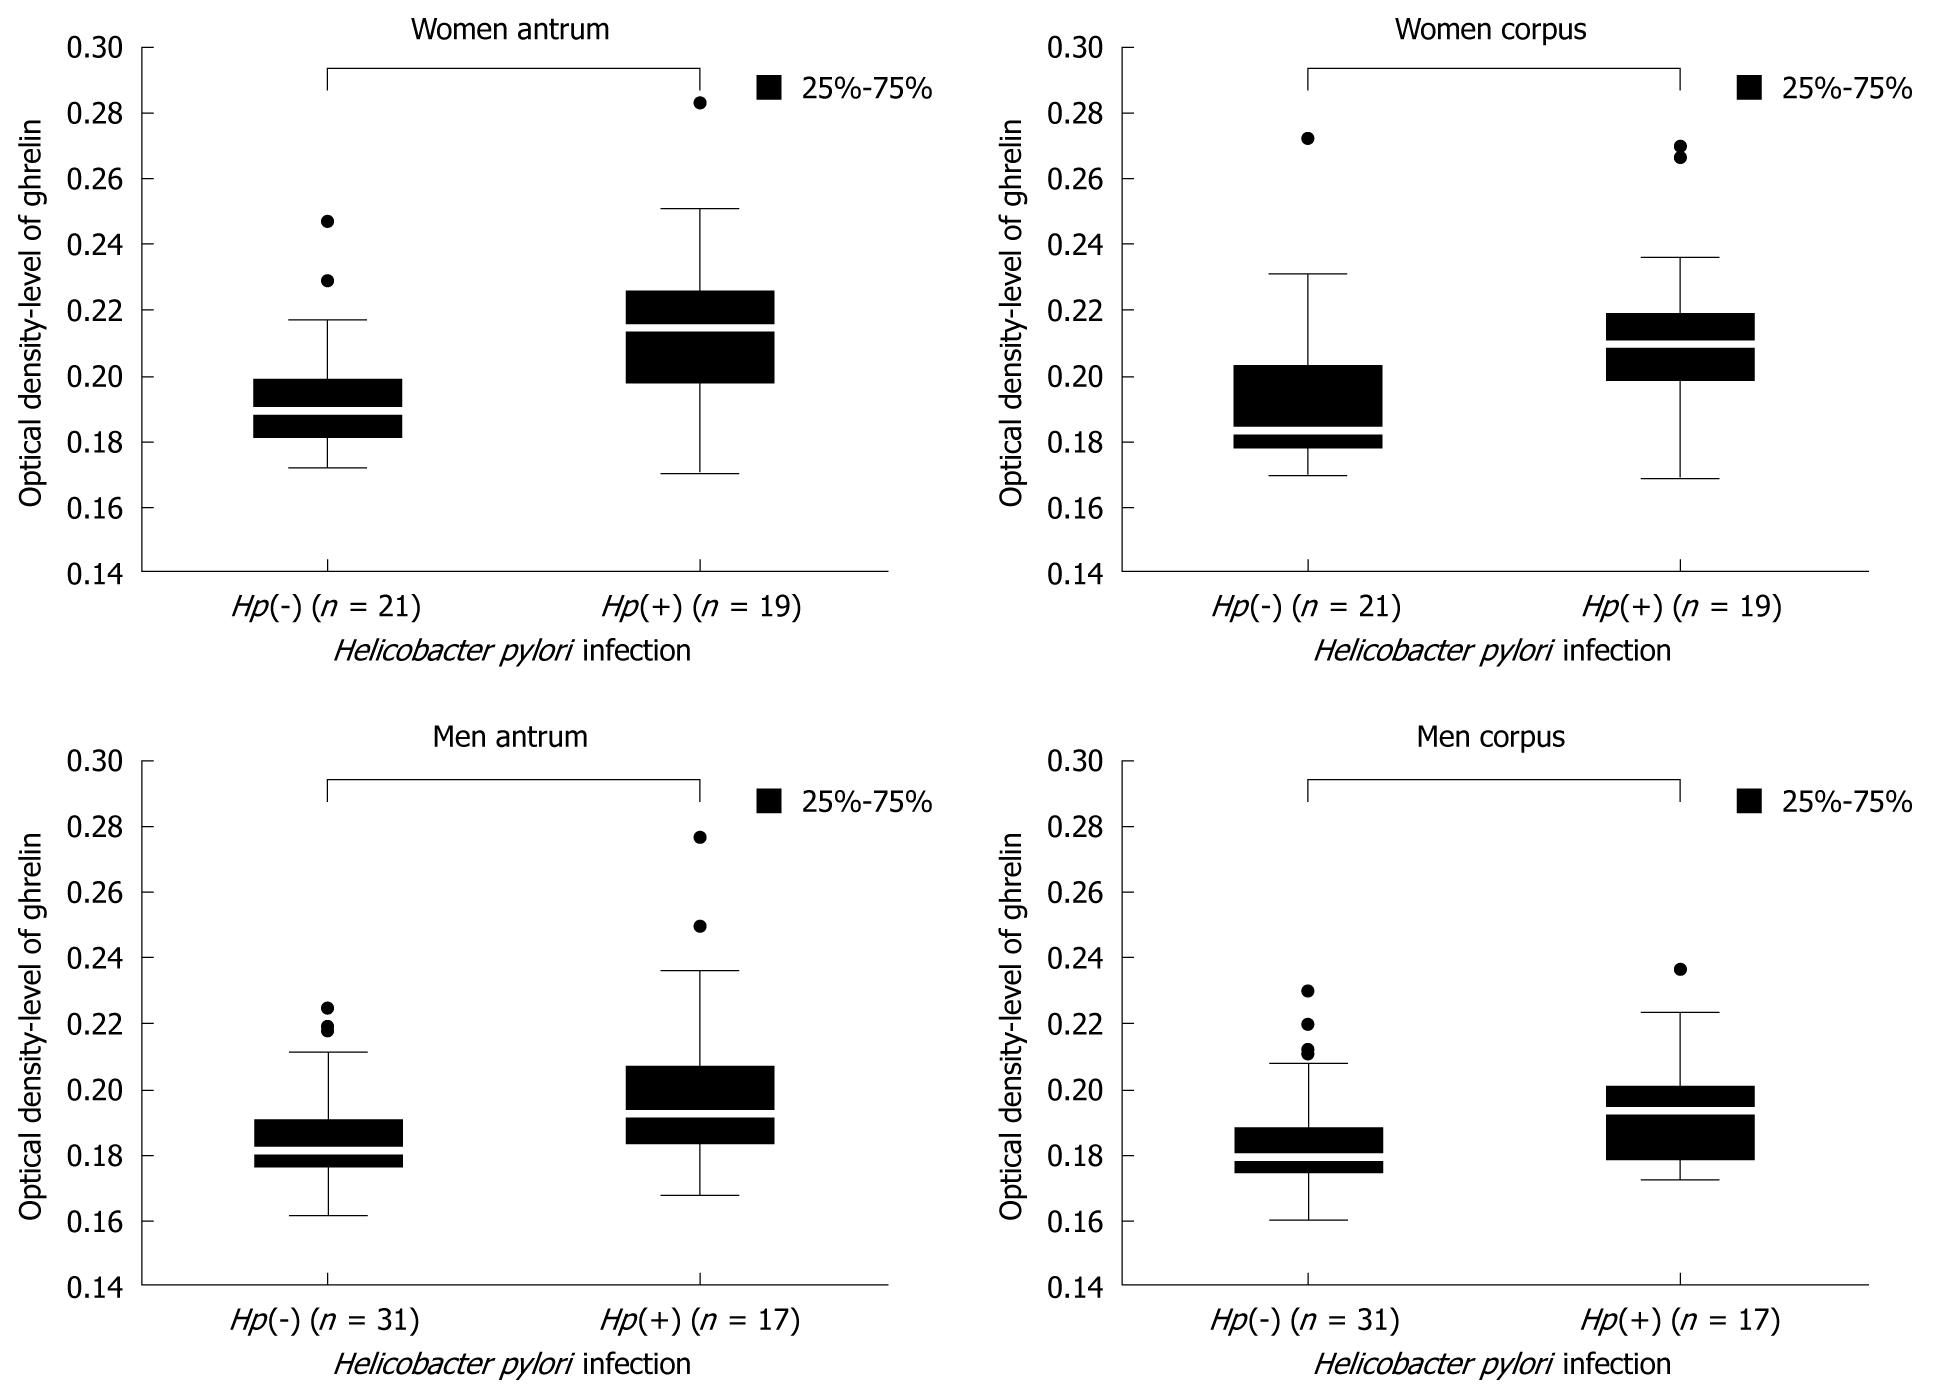
Figure 3 Comparison of ghrelin levels in H pylori negative [Hp(-)] and H pylori positive [Hp(+)] samples taken from the antrum and corpus of female and male patients.
Population numbers are given.
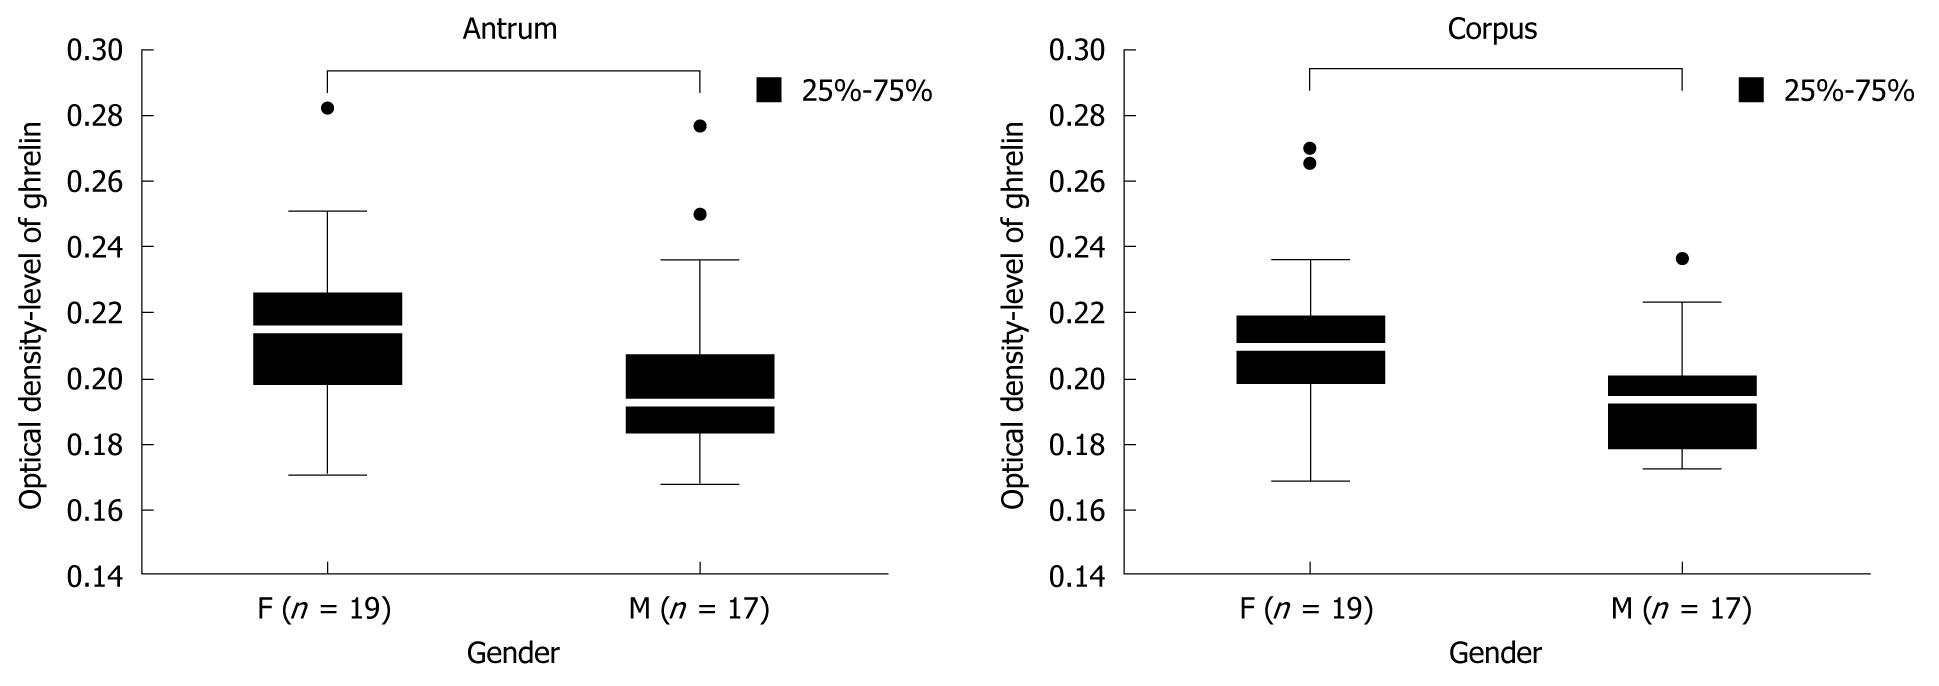
Figure 4 Ghrelin levels in gastric biopsy specimens taken from the antrum and corpus of female (F) and male (M) patients with H pylori infection.
The numbers in both gender groups are given.
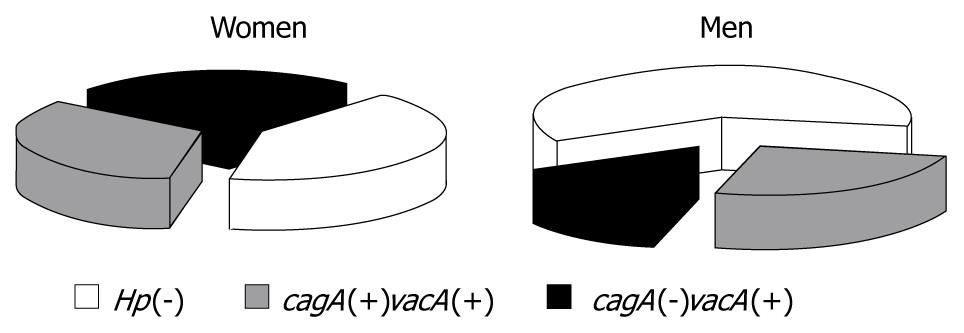
Figure 5 Distribution of subjects in each study group of female and male patients.
Subjects without H pylori infection are marked as Hp(-), while the remaining subjects are H pylori positive with and without cagA expression (cagA(+)vacA(+) and cagA(-)vacA(+), respectively.
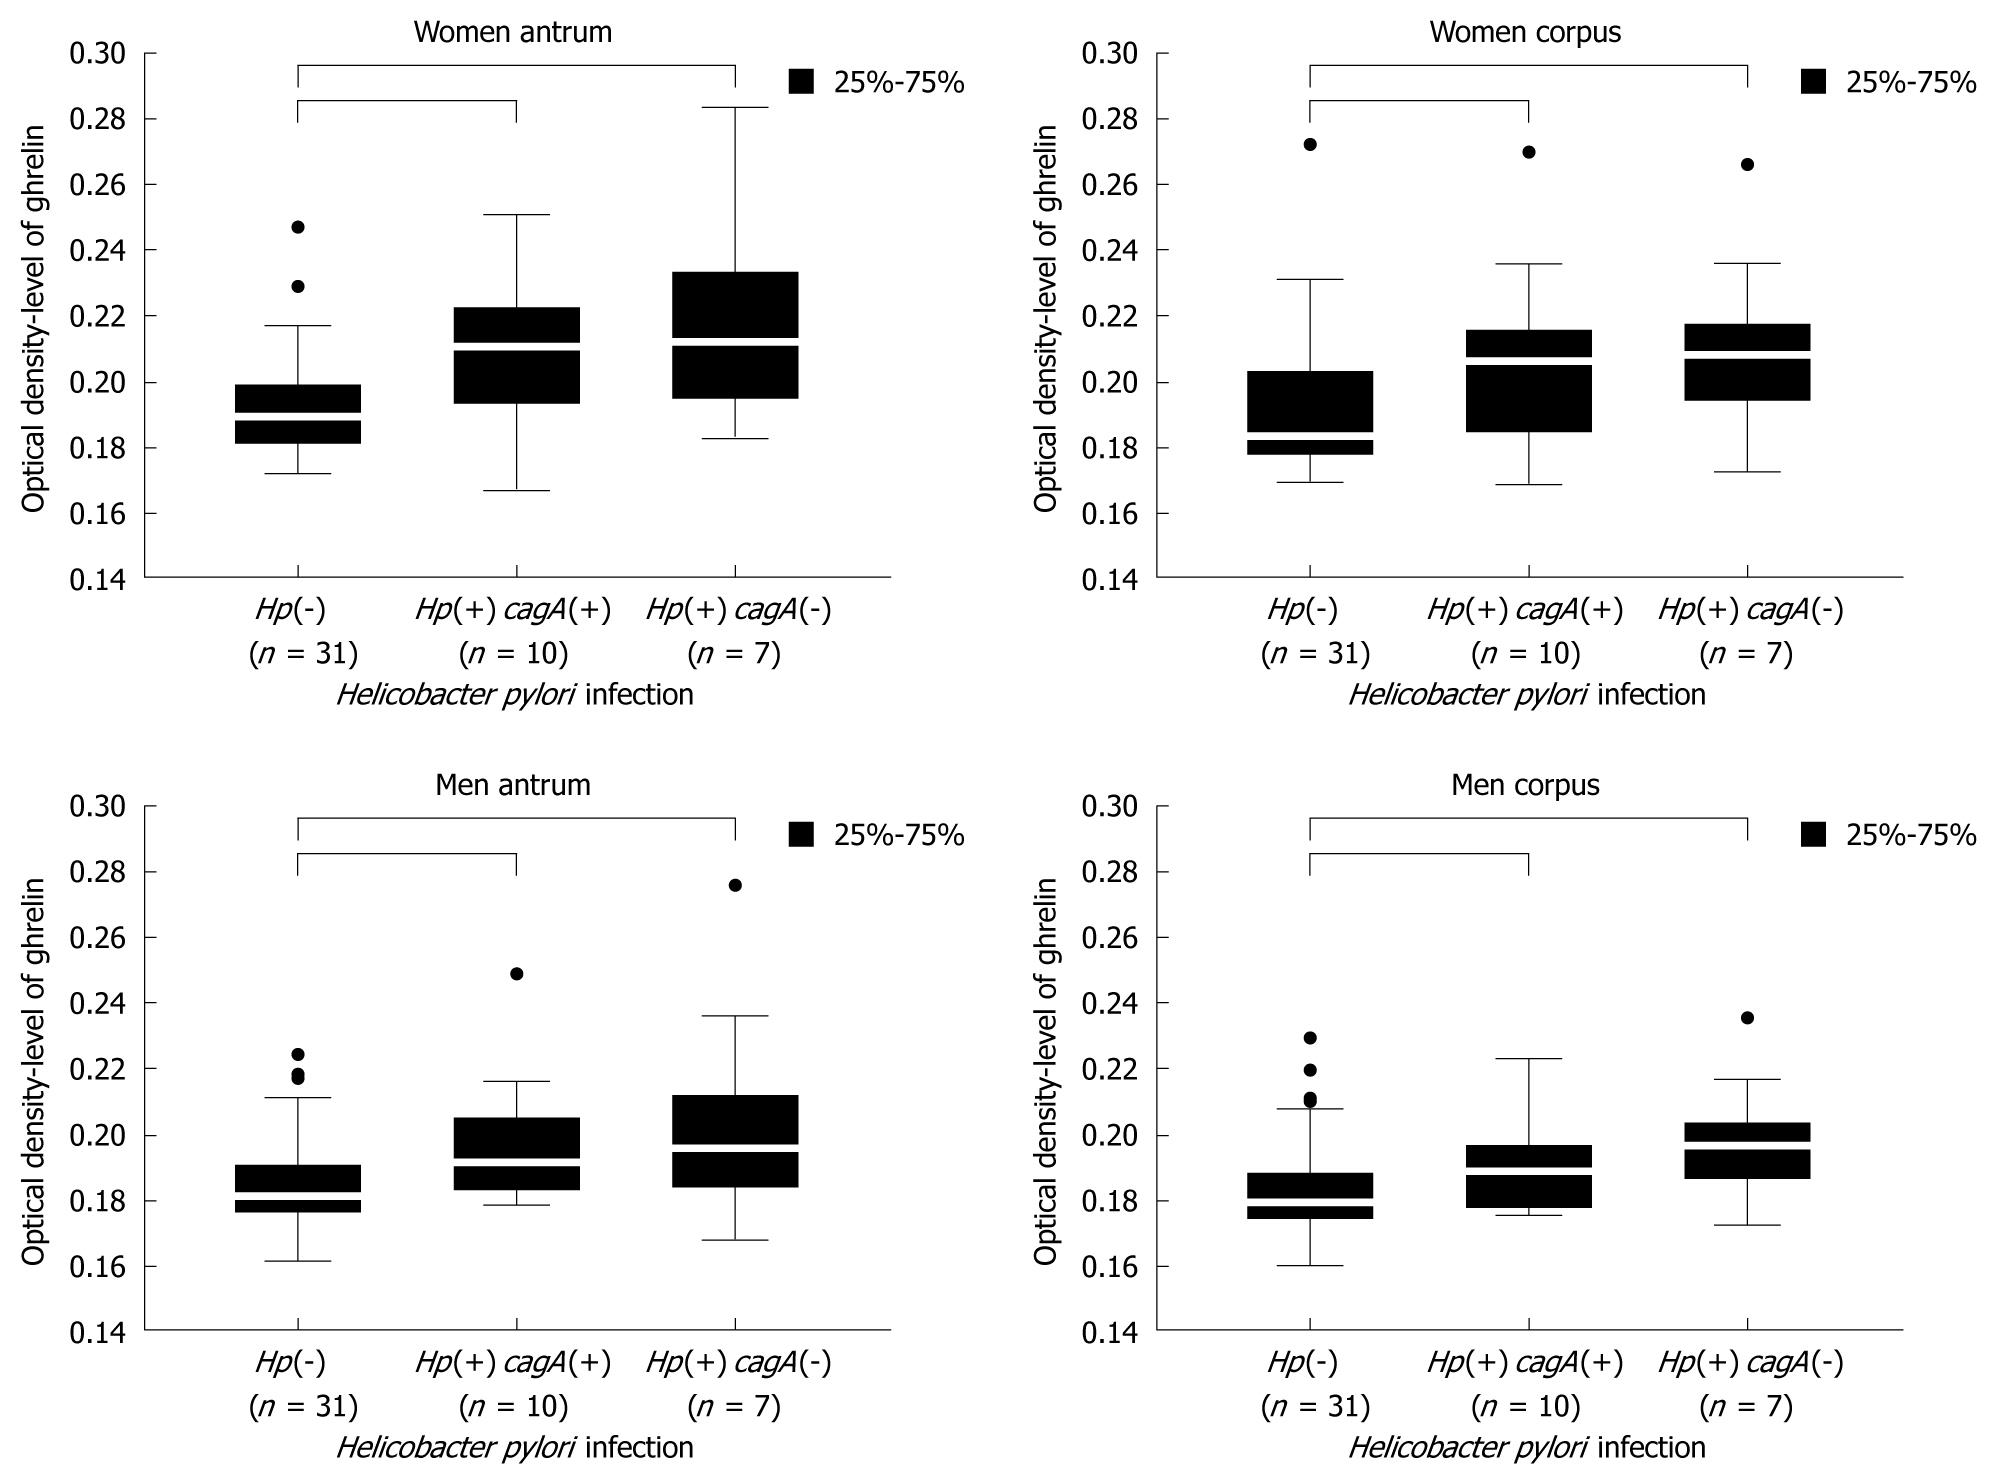
Figure 6 Ghrelin levels in female and male antrum and corpus gastric biopsies in relation to H pylori strain cytotoxicity.
The numbers in the patient populations are given.
-
Citation: Stec-Michalska K, Malicki S, Michalski B, Peczek L, Wisniewska-Jarosinska M, Nawrot B. Gastric ghrelin in relation to gender, stomach topography and
Helicobacter pylori in dyspeptic patients. World J Gastroenterol 2009; 15(43): 5409-5417 - URL: https://www.wjgnet.com/1007-9327/full/v15/i43/5409.htm
- DOI: https://dx.doi.org/10.3748/wjg.15.5409


