Copyright
©2009 The WJG Press and Baishideng.
World J Gastroenterol. Apr 14, 2009; 15(14): 1719-1729
Published online Apr 14, 2009. doi: 10.3748/wjg.15.1719
Published online Apr 14, 2009. doi: 10.3748/wjg.15.1719
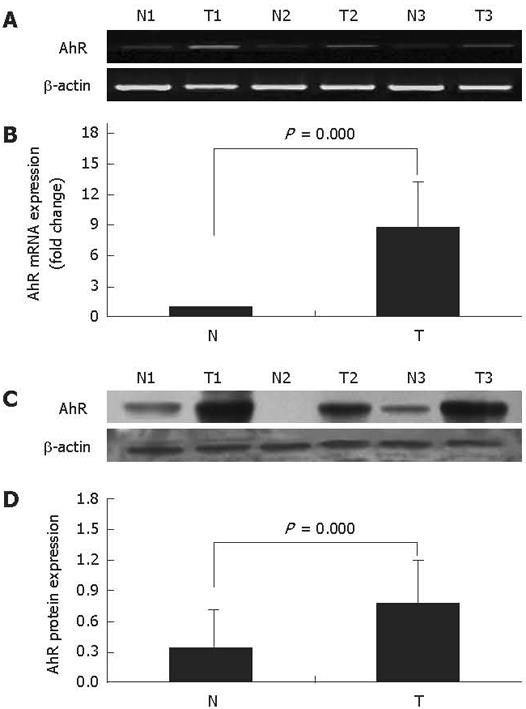
Figure 1 AhR mRNA and protein expression in GC tissues (T) and their corresponding adjacent non-cancerous tissues (N).
A: AhR mRNA was detected by RT-PCR; B: AhR mRNA was detected by real-time PCR; C and D: AhR protein expression was detected by Western blotting and band intensities of AhR were normalized with corresponding band intensities of β-actin. A and C represent three cases; B and D summarize the overall mRNA and protein expression levels of AhR in all 39 cases.
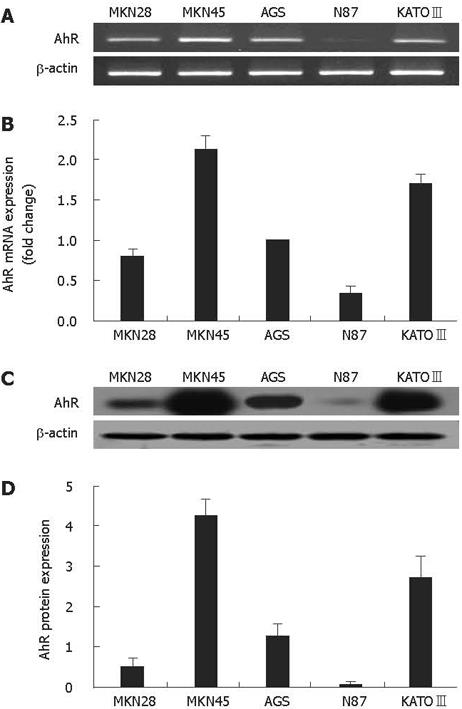
Figure 2 AhR mRNA and protein expression in five GC cell lines.
A: AhR mRNA was detected by RT-PCR; B: AhR mRNA was detected by real-time PCR, AhR mRNA of AGS cells was used as the experimental control to calculate the fold changes; C and D: AhR protein expression was detected by Western blotting and band intensities of AhR were normalized with corresponding band intensities of beta-actin.
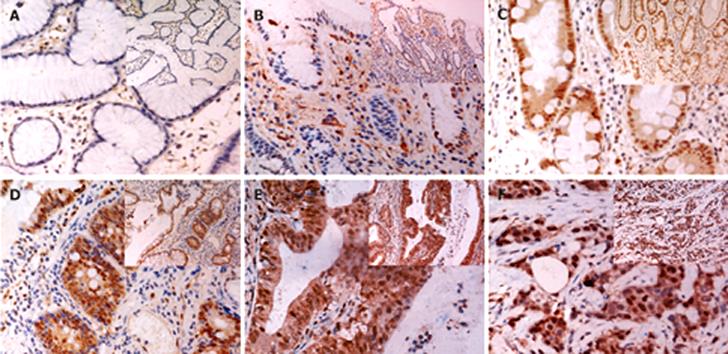
Figure 3 Immunohistochemical staining of AhR in gastric tissues.
A: CSG; B: CAG; C: IM; D: AH; E: i-GC; F: d-GC (Original magnification × 400 and × 200). Strong nuclear expression and weak cytoplasmic distribution of AhR were observed in epithelial cells and some stroma cells of both GC and pre-malignant tissues.
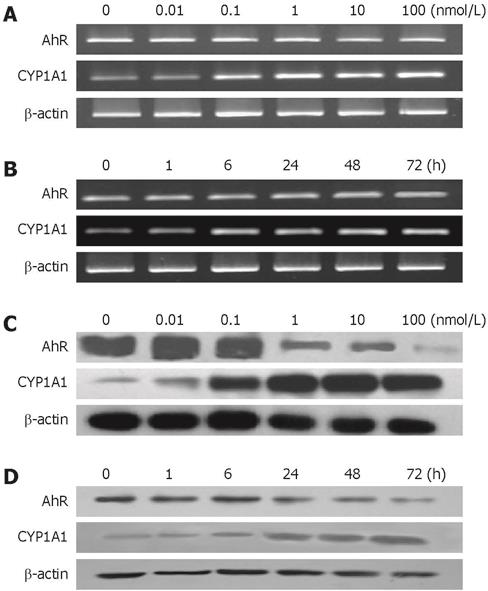
Figure 4 AhR and CYP1A1 expression in AGS cells after TCDD treatment.
A and B: RT-PCR; C and D: Western blotting. Treatment of AGS cells with specific AhR agonist TCDD resulted in a dose- (A and C) and time-dependent (B and D) induction of CYP1A1 expression. The results shown are representative of three independent experiments.
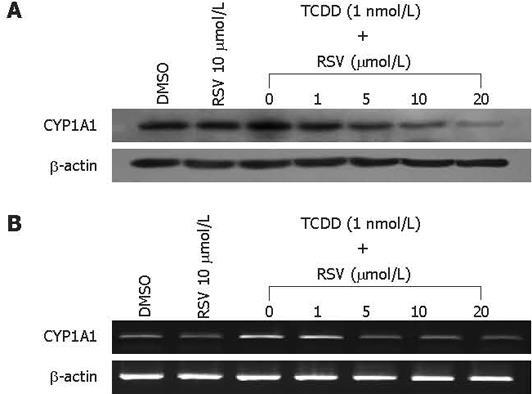
Figure 5 Inhibition of TCDD-induced CYP1A1 mRNA and protein expression by resveratrol.
A: CYP1A1 protein was detected by Western blotting; B: CYP1A1 mRNA was detected by RT-PCR. The results shown are representative of three independent experiments. Treatment of AGS cells with 1 nmol/L TCDD caused a remarkable increase in CYP1A1 expression. This TCDD-induced CYP1A1 expression was partially reversed by resveratrol in a dose-dependent manner.
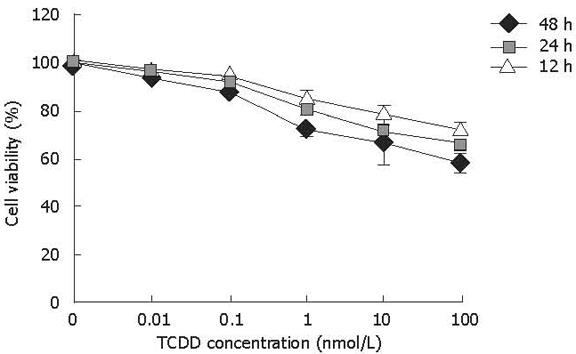
Figure 6 Viability of AGS cells after TCDD treatment was assessed by MTT assay.
Viability of AGS cells was significantly decreased in a dose-dependent manner after TCDD treatment.
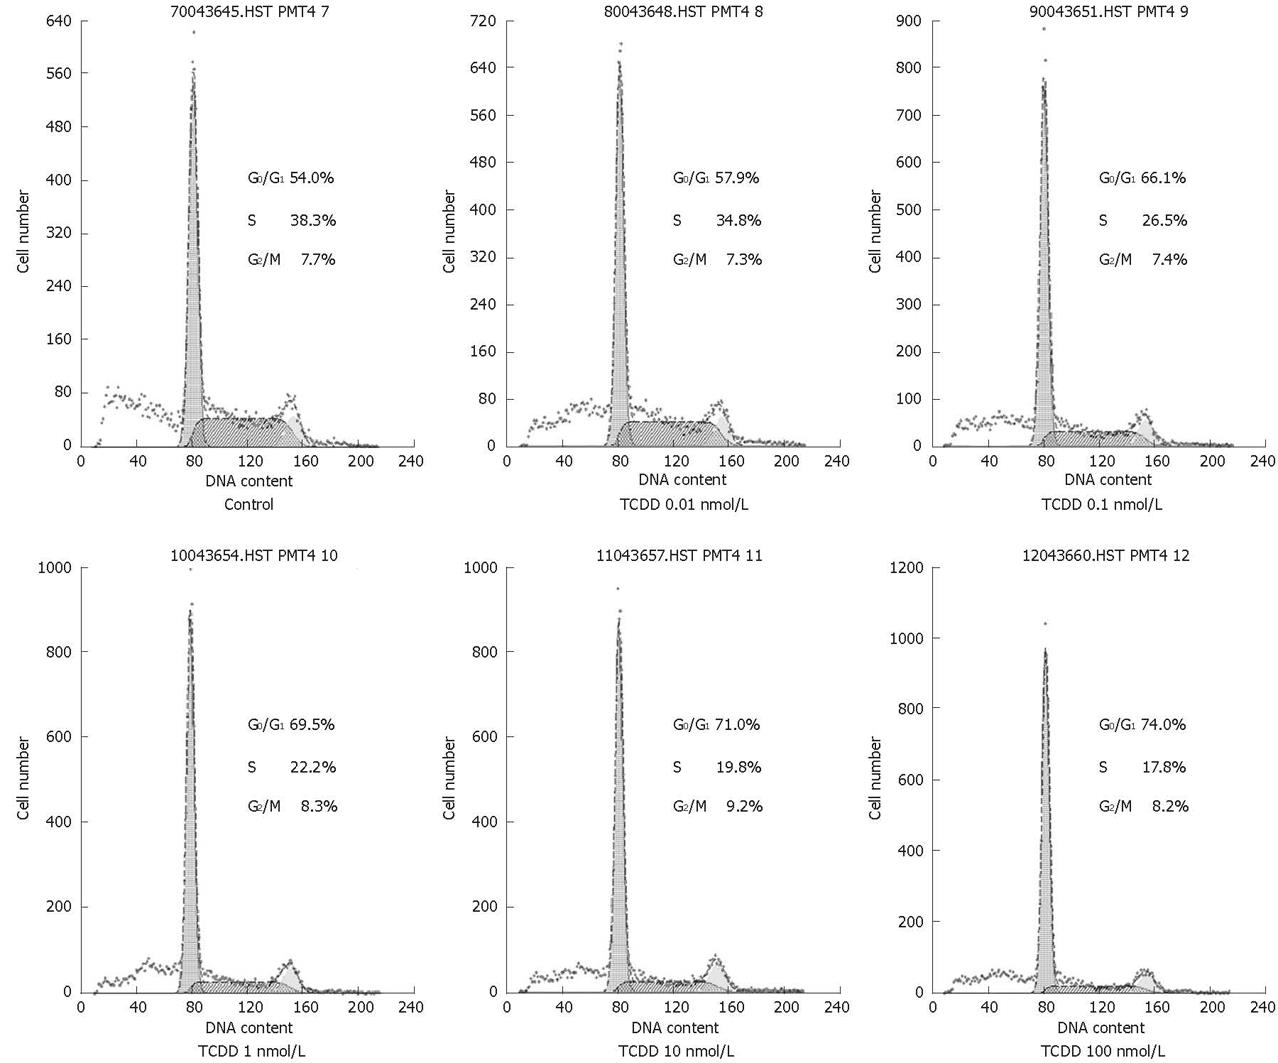
Figure 7 The effect of TCDD on AGS cell cycle distribution.
AGS cells were treated with different concentrations of TCDD and subjected to flow cytometric analysis. The percentage of each phase is indicated in each panel. The results shown are representative of three independent experiments.
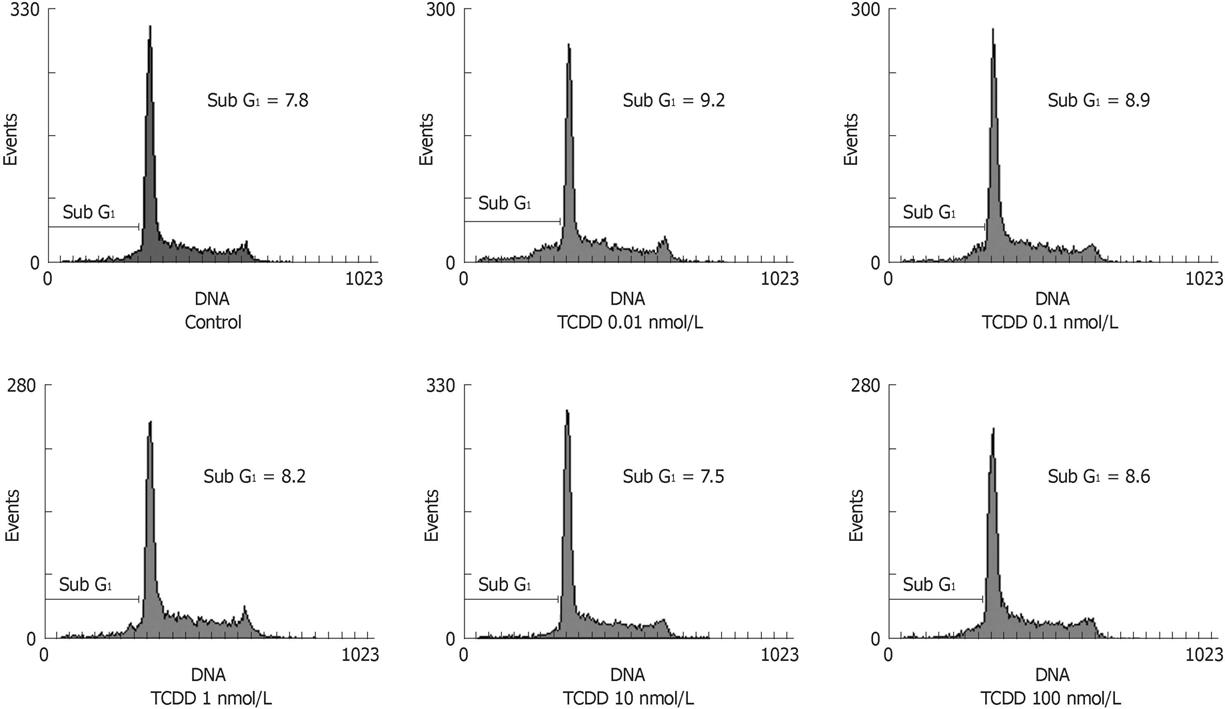
Figure 8 The effect of TCDD on apoptosis of AGS cells.
AGS cells were treated with different concentrations of TCDD and subjected to flow cytometric analysis. Cellular apoptosis was evaluated by fragmented DNA (sub-G1) analysis using winMDI2.9. The results shown are representative of three independent experiments.
- Citation: Peng TL, Chen J, Mao W, Liu X, Tao Y, Chen LZ, Chen MH. Potential therapeutic significance of increased expression of aryl hydrocarbon receptor in human gastric cancer. World J Gastroenterol 2009; 15(14): 1719-1729
- URL: https://www.wjgnet.com/1007-9327/full/v15/i14/1719.htm
- DOI: https://dx.doi.org/10.3748/wjg.15.1719


