Copyright
©2008 The WJG Press and Baishideng.
World J Gastroenterol. Oct 14, 2008; 14(38): 5834-5841
Published online Oct 14, 2008. doi: 10.3748/wjg.14.5834
Published online Oct 14, 2008. doi: 10.3748/wjg.14.5834
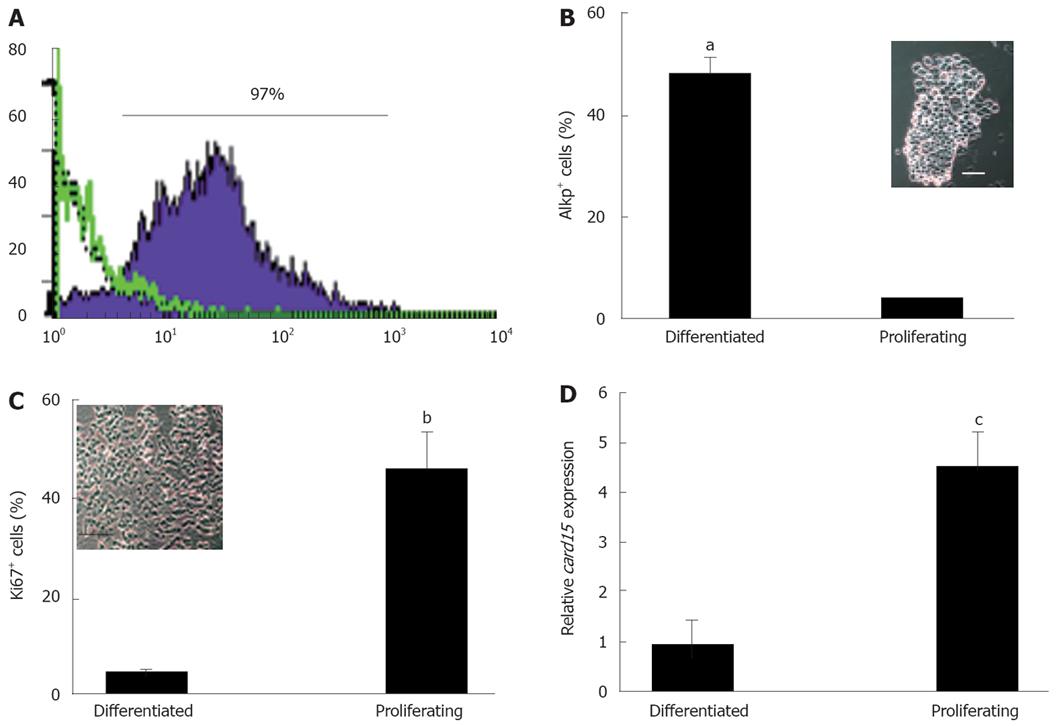
Figure 1 NOD2 expression by CECs.
A: Colonic epithelial cells were isolated by incubating segments of colon with increasing concentrations of EDTA. Purity was assessed by staining with anti-cytokeratin (filled profile) and -CD45 (green open profile) antibodies and by flow cytometry using isotype matched antibodies to determine levels of background staining (dotted open profile). The % value shown represents the frequency of cytokeratin+ cells in a representative 10 mmol/L EDTA fraction. B and C: 1 mmol/L and 10 mmol/L EDTA fractions of CECs were evaluated for the presence of differentiated and proliferating epithelial using alkaline phosphatase (AlkP) activity and Ki67 expression, respectively, as described in the Methods section. aP < 0.03 in B and bP < 0.015 in C. The morphology of cells in 1 mmol/L and 10 mmol/L EDTA fractions is depicted in the phase contrast photomicrograph insets in B (10 mmol/L) and C (1 mmol/L). Magnification is 160. Scale bar in B = 10 μm and in C = 40 μm. D: The relative levels of Card15 mRNA in fractions of colonic crypts enriched for proliferating and differentiated epithelial cells were determined by real time RT-PCR using β-actin as a reference gene. The data represents averaged values (± SE) of four experiments. cP < 0.05.
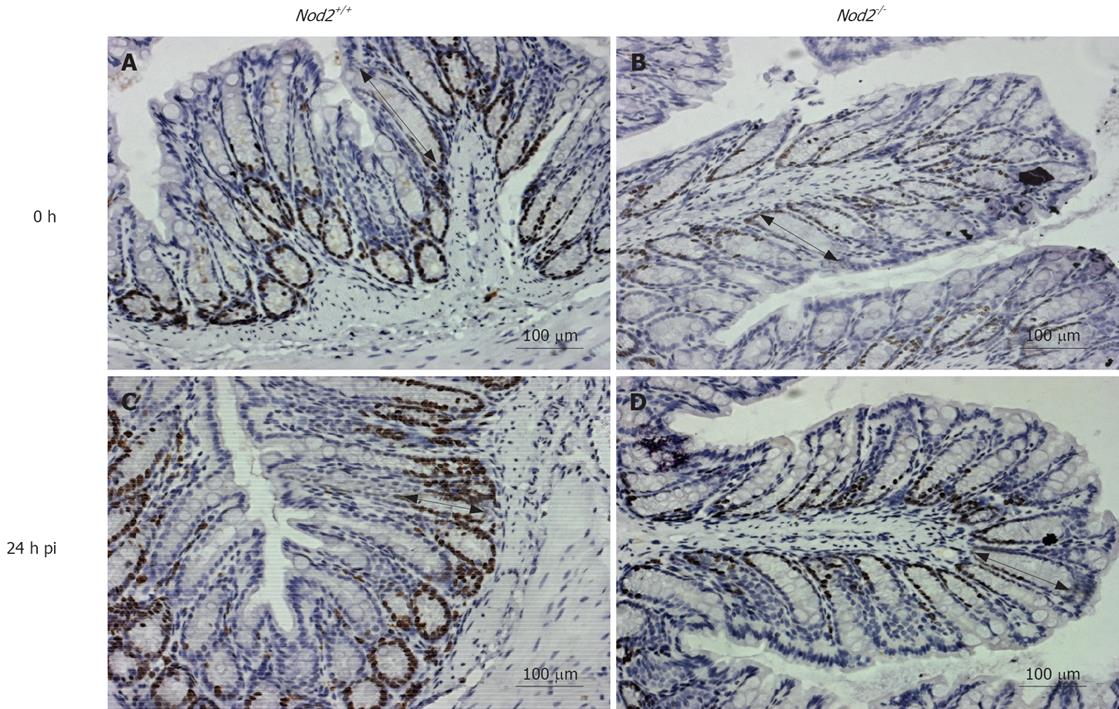
Figure 2 Decreased proliferation of NOD2-deficient CECs.
Sections of colon from Nod2+/+ (wild type: WT) and Nod2-/- mice obtained prior to (0 h) and 24 h after enteric Salmonella infection were stained with an anti-Ki67 antibody and DAB and then counterstained with H&E. Ki67-reactive cells within the crypt regions are identified by the darkly stained nuclei. The arrows indicate the crypt-villous height with the scale bar representing 100 μm.
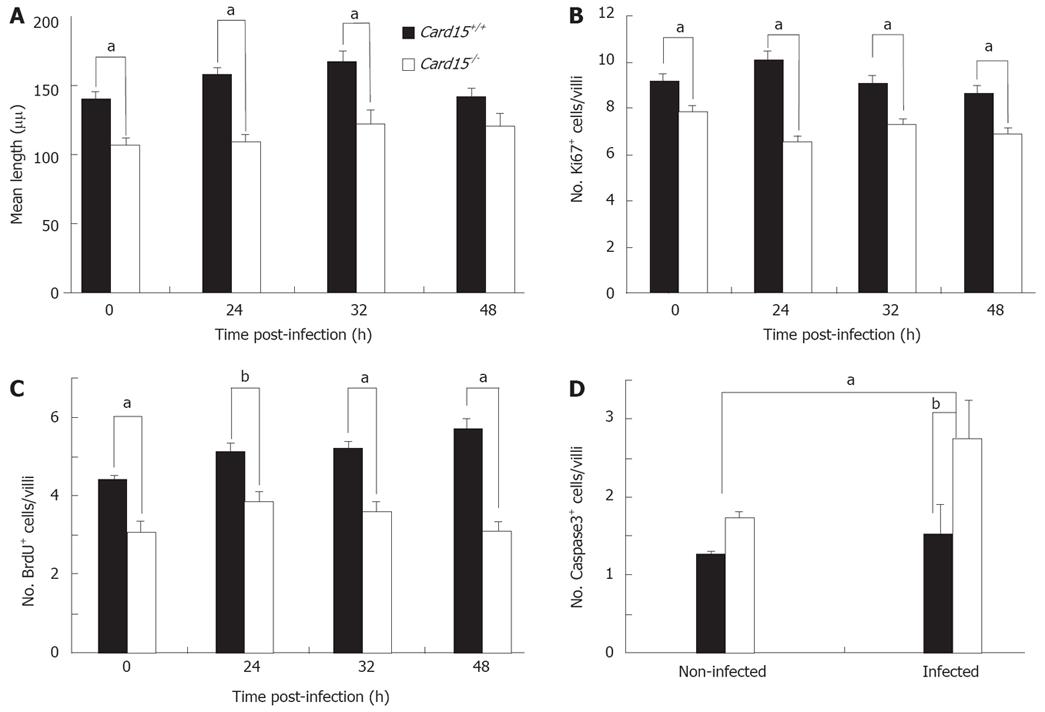
Figure 3 Decreased proliferation of Nod2-/- CECs in vivo.
A: Mean crypt-villous height measurements were determined by measuring distances from the base to the tip of the crypt of at least 20 crypts from sections taken at the distal, mid and proximal parts of the colon of Nod2+/+ and Nod2-/- mice (n = 5) prior to (0 h) and at different times after peroral Salmonella infection. The mean (± SE) of counting at least 20 crypts in 3-4 sections of 4-5 mice of each strain is shown. B: Sections of Nod2+/+ and Nod2-/- colon were stained with anti-Ki67 antibody with the mean (± SE) number of stained cells in 5-6 sections from three mice of each strain shown. aP < 0.05. C: BrdU-incorporation was assessed by injecting Nod2+/+ and Nod2-/- mice with BrdU 1 h prior to removing the colons, which were then sectioned and stained with an anti-BrdU antibody. The graph represents the mean (± SE) number of BrdU+ epithelial cells per crypt as determined by counting stained cells in > 20 crypts from 5-6 sections taken from proximal, mid and distal regions of the colons from three mice of each strain. aP < 0.05, bP < 0.001. D: Sections of colon from Nod2+/+ and Nod2-/- mice were stained with anti-active caspase3 antibodies with the mean (± SE) number of caspase3+ cells in 4-5 sections from three mice of each strain shown. aP < 0.05, bP < 0.001.
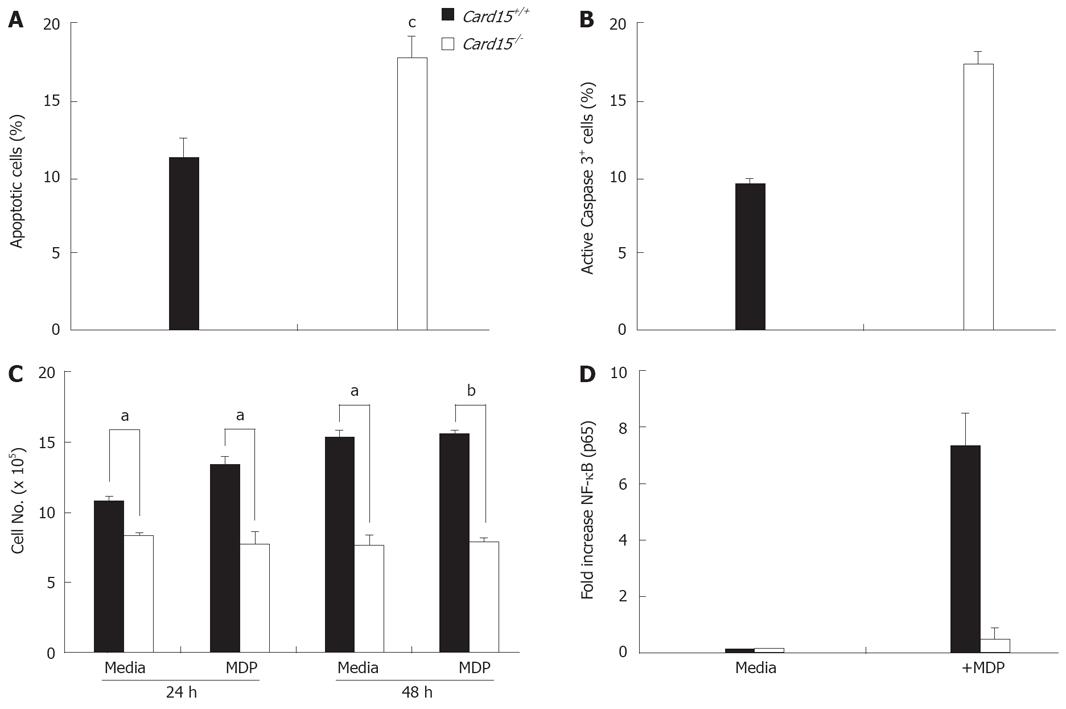
Figure 4 Decreased survival of Nod2-/- CECs in vitro.
A: The level of apoptotic cells in cultures of primary CECs from Nod2+/+ and Nod2-/- mice was determined by annexin V and propidium iodide (PI) staining and flow cytometry. Data was collected from 5 experiments and shows the mean (± SE) values. cP < 0.01 B: The frequency of Nod2+/+ and Nod2-/- CECs containing caspase3 activity was determined using the flow cytometry based NucViewTM488 Caspase-3 assay. The data represents the mean (± SE) values collected from two experiments. C: The growth of Nod2+/+ and Nod2-/- CECs in the absence (Media) or presence of 10 μg/mL muramyl dipeptide (MDP) was determined by comparing the number of viable CEC at the initiation of culture and after 24 h and 48 h. The data shown represents the mean (± SE) of 3 experiments. aP < 0.05, bP < 0.001. D: NF-κB activation in Nod2+/+ (filled bars) and Nod2-/- (open bars) CEC after exposure to muramyl dipeptide (MDP) was determined by quantitating NF-κB p65 levels in nuclear extracts using a Transfactor Kit as described in Methods section. Values were normalized to control values of cells grown in media alone. The data shown represents the mean (± SE) values from 3 independent experiments.
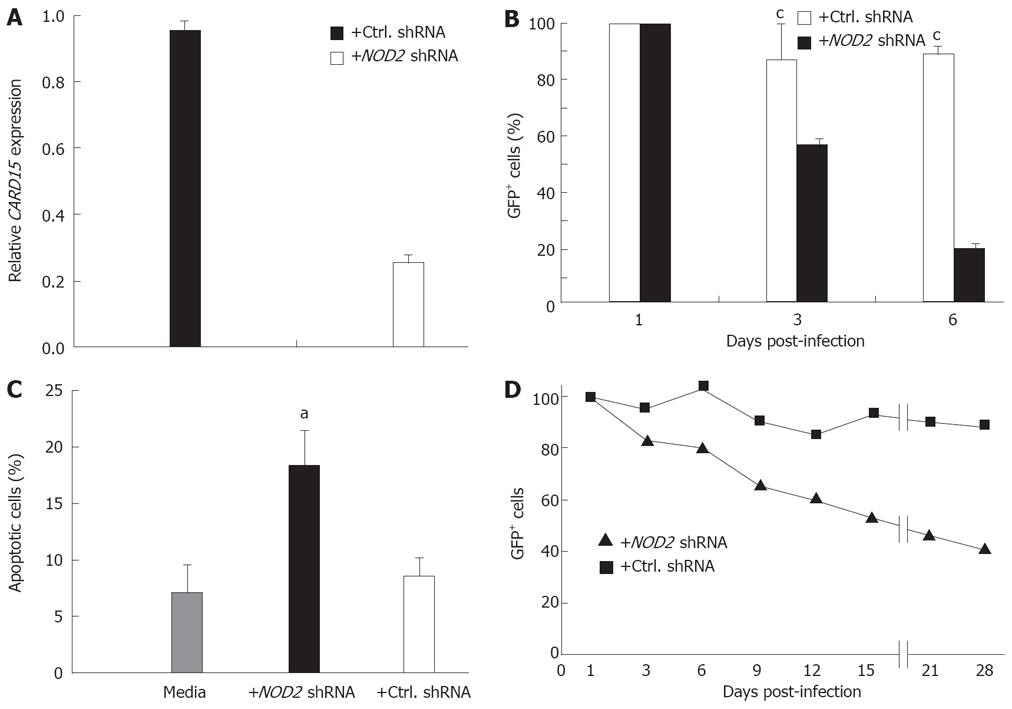
Figure 5 Neutralization of CARD15 gene expression in colon carcinoma cells reduces their survival.
A: The level of NOD2 mRNA in HT-29 cells transfected with green fluorescent (GFP) containing lentiviral vectors expressing either NOD2 (NOD2 shRNA) or scrambled NOD2 shRNA sequences (Ctrl. shRNA) was determined by real time RT-PCR after 4 h stimulation with TNFα. Levels were compared to that of nontreated cells (= 1.0). Data are averaged values (± SE) of 3 experiments. B: The impact of CARD15 and control shRNA on the growth of HT-29 cells was assessed by determining the frequency of GFP+ and GFP-cells by flow cytometry at 1 d, 3 d and 6 d post infection. Data are averaged values (± SE) of 3 experiments. cP < 0.01. C: Frequency of apoptotic cells in cultures of non-infected HT-29 cells (Media) and in cells 2 d after infection with NOD2 shRNA or Ctrl shRNA was determined by staining with Annexin V and 7AAD and flow cytometry. The graph represents the averaged frequency (± SE) of apoptotic cells from three experiments. aP < 0.05. D: The survival of SW480 cells after transfection with lentiviral vectors expressing either NOD2 or scrambled shRNA sequences was analysed by determining the frequency of GFP+ cells remaining at various times after infection by flow cytometry. The data is representative of two independent experiments.
- Citation: Cruickshank SM, Wakenshaw L, Cardone J, Howdle PD, Murray PJ, Carding SR. Evidence for the involvement of NOD2 in regulating colonic epithelial cell growth and survival. World J Gastroenterol 2008; 14(38): 5834-5841
- URL: https://www.wjgnet.com/1007-9327/full/v14/i38/5834.htm
- DOI: https://dx.doi.org/10.3748/wjg.14.5834


