Copyright
©2008 The WJG Press and Baishideng.
World J Gastroenterol. Apr 21, 2008; 14(15): 2343-2348
Published online Apr 21, 2008. doi: 10.3748/wjg.14.2343
Published online Apr 21, 2008. doi: 10.3748/wjg.14.2343
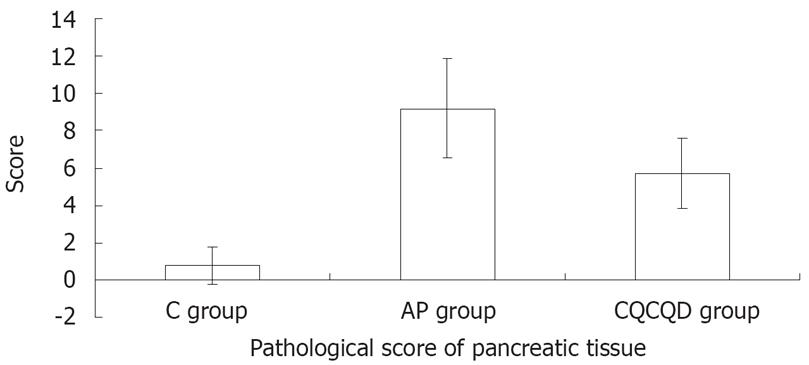
Figure 1 Scores of pancreatic tissues in three groups (n = 10, mean ± SD).
The pathological score of pancreatic tissues was the highest in the AP group (9.2 ± 2.7) and followed by CQCQD group (5.7 ± 1.9) and C group (0.8 ± 1.0), (P < 0.05).
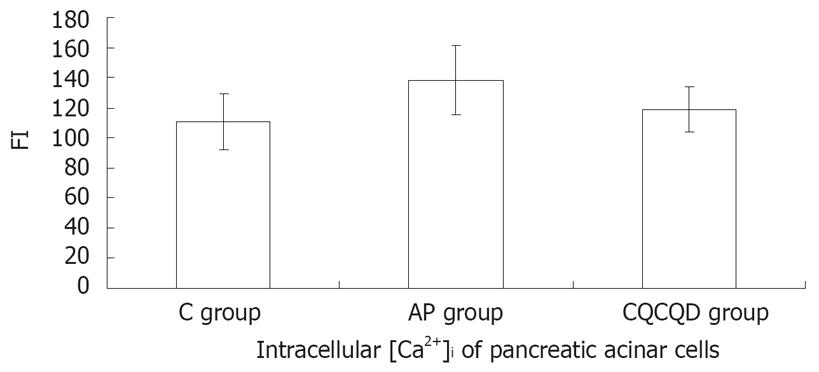
Figure 2 Intracellular [Ca2+]i of pancreatic acini (n = 10, mean ± SD).
The fluorescence intensity (FI) of intracellular [Ca2+]i of pancreatic acinar in AP group (138.2 ± 23.1) was higher than C group (111.0 ± 18.4) and CQCQD group (118.7 ± 15.2 , P < 0.05), but there was no statistical difference between the C group and the CQCQD group (P > 0.05).
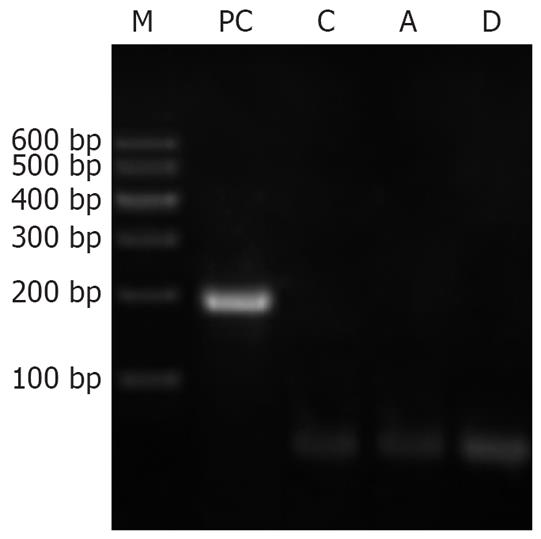
Figure 3 Agar gel electrophoresis photograph of PCR products of SERCA1 mRNA.
The PCR products of sarcoplasmic reticulum Ca2+-ATPase (SERCA1) mRNA was 199 bp. M: Marker; PC: Positive control with skeletal muscle; C: Control group; A: Acute pancreatitis group; D: Acute pancreatitis group treated with Chaiqinchengqi decoction.
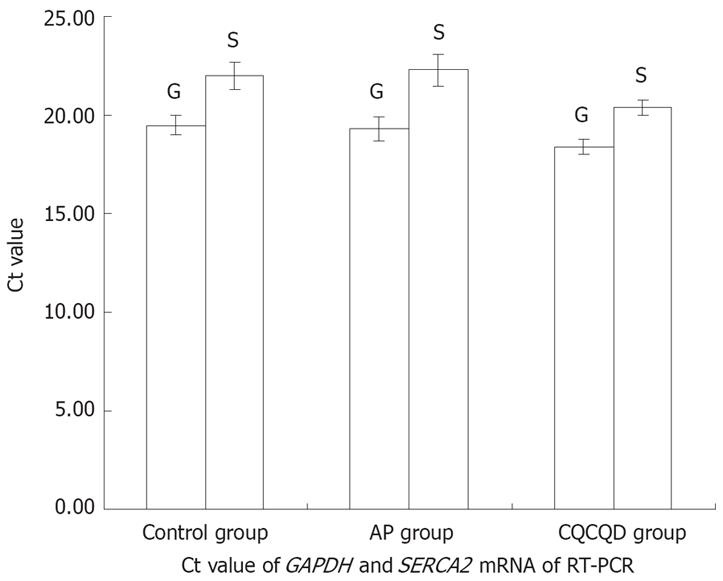
Figure 4 Ct value of GAPDH and SERCA2 mRNA of RT-PCR.
Ct: Cycle threshold; G: Glyceraldehyde-3-phosphate dehydrogenase (GAPDH), the internal housekeeping; S: Sarco/endoplasmic reticulum Ca2+-ATPase 2 (SERCA2).
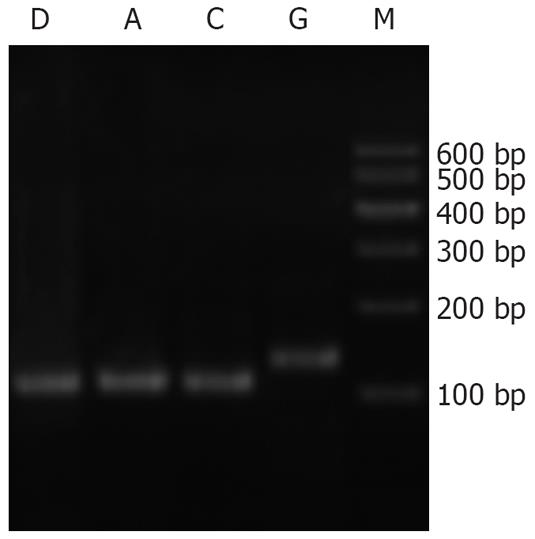
Figure 5 Agar gel electrophoresis photograph of PCR products of SERCA2 mRNA.
D: Acute pancreatitis group treated with Chaiqinchengqi decoction; A: Acute pancreatitis group; C: Control group; G: Internal housekeeping gene (GAPDH gene); M: Marker.
- Citation: Xue P, Deng LH, Zhang ZD, Yang XN, Xia Q, Xiang DK, Huang L, Wan MH. Effect of Chaiqinchengqi decoction on sarco/endoplasmic reticulum Ca2+-ATPase mRNA expression of pancreatic tissues in acute pancreatitis rats. World J Gastroenterol 2008; 14(15): 2343-2348
- URL: https://www.wjgnet.com/1007-9327/full/v14/i15/2343.htm
- DOI: https://dx.doi.org/10.3748/wjg.14.2343


