Copyright
©2005 Baishideng Publishing Group Inc.
World J Gastroenterol. Mar 7, 2005; 11(9): 1303-1316
Published online Mar 7, 2005. doi: 10.3748/wjg.v11.i9.1303
Published online Mar 7, 2005. doi: 10.3748/wjg.v11.i9.1303
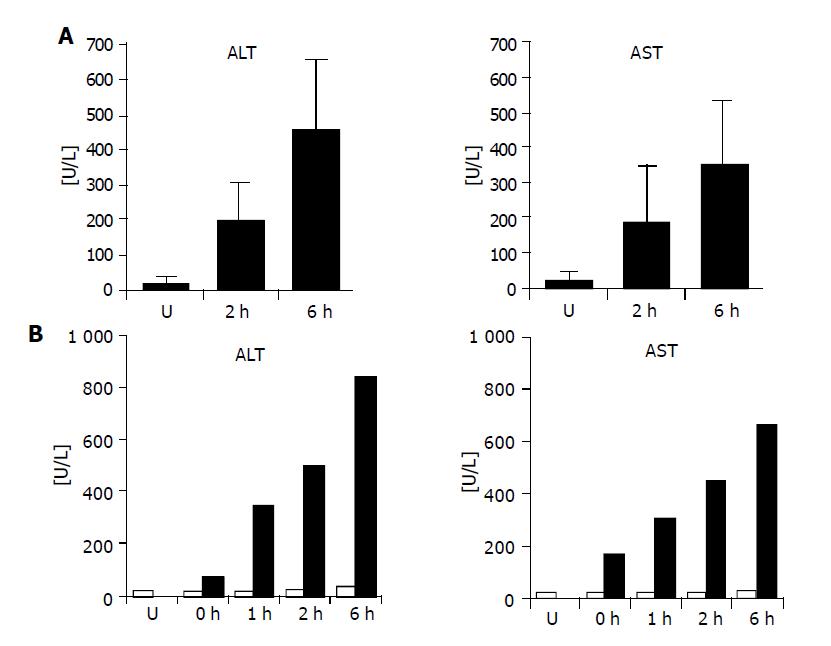
Figure 1 Serum AST/ALT levels after WI/R compared to untreated animals.
A: AST/ ALT levels in untreated (U) animals and rats subjected to 1 h warm ischemia and 2 or 6 h reperfusion (2, 6 h) indicating strongest liver damage after 6 h reperfusion (n = 5 per experimental group); B: Serum AST/ALT levels in untreated animals (U; n = 3) and rat livers of the additionally prepared reperfusion time kinetics (1 h ischemia, 0, 1, 2, 6 h reperfusion; n = 1/time point). Liver enzymes were measured immediately after laparotomy (white bars) and after WI/R (black bars).
Figure 2 Liver histology after WI/R compared to untreated animals.
HE stained sections of untreated rat livers and after WI/R. Almost normal liver architecture in untreated animals (A) and after 2 h reperfusion (B). Vacuolation and hepatocyte swelling after 6 h reperfusion (C).
Figure 3 Second screening of SSH-clones and ‘Atlas Arrays’.
Two identical sets of Southern blots and two Atlas-Arrays were hybridized with complex probes of four pooled C-lobes or matched I-lobes after partial WI/R (1 h/2 h). A: Typical results of two corresponding Southern blots. The upper membranes were screened with the C-lobe probe (pool-C) and the lower membranes show the result after hybridization with the I-lobe probe (pool-I) pool-C/pool-I ratios of signal intensities after densitometry: 0.4 (1, 4), 1.1 (2, 3), 0.2 (5), 2.0 (6), 2.6 (7), 2.8 (8), 2.2 (9), 7.0 (10). β-Actin-positive controls (150 ng/lane, 2200 ng/lane); B: Ethidium bromide-stained agarose gels before blotting; C: Distribution of pool-C/pool-I ratios of all 89 analyzed genes; D: Exemplary hybridization results of the two cDNA arrays after 4 h exposition. Numbered black or white arrows indicate spots of up- or down-regulated genes in the I-lobe cDNA-pool, which were among others chosen for Northern blot hybridizations. Jun (1), Hsp27 (2), Hsp70 (3), IL-1RI (4) and Fgb (5). Arrow heads point to spotted housekeeping gene cDNAs; β-Actin (6), ribosomal protein S29 (7), 1 spotted genomic DNA to assess contaminations in the RNA preparations, used for probe synthesis.
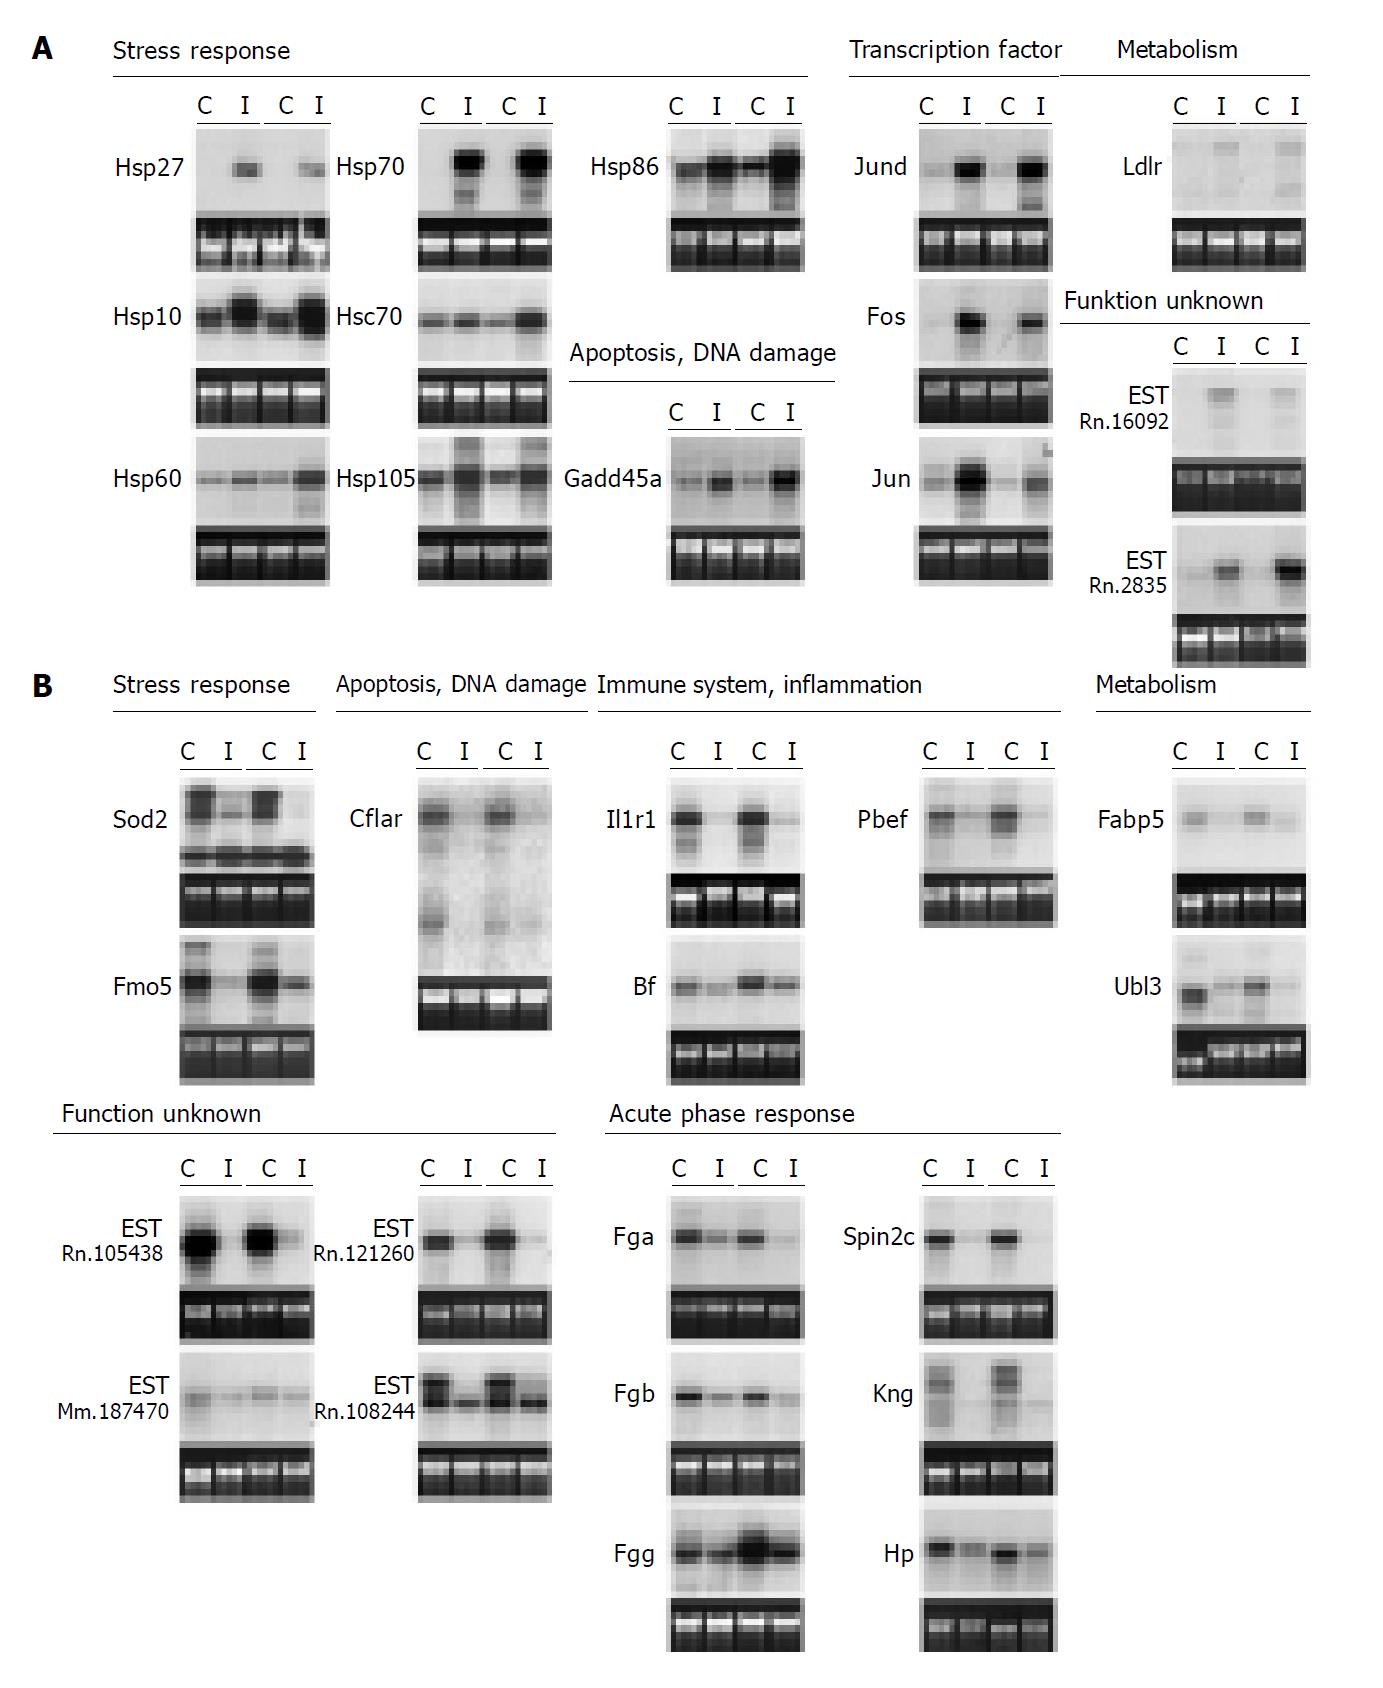
Figure 4 Northern blot data of verified target genes (SSH and ‘Atlas Array’) after partial WI/R (1 h/2 h).
Exemplarily, liver lobes of two animals are shown. Matched liver lobes (C- and I-lobe) are underlined. Abbreviations of the analyzed genes are written on the left of every Northern blot. For full titles see Table 2. 28s rRNA bands of the ethidium bromide-stained gels are shown below the respective blots as loading controls. 14 genes with enriched RNA (A) and 18 down-regulated genes (B) in the I-lobes.
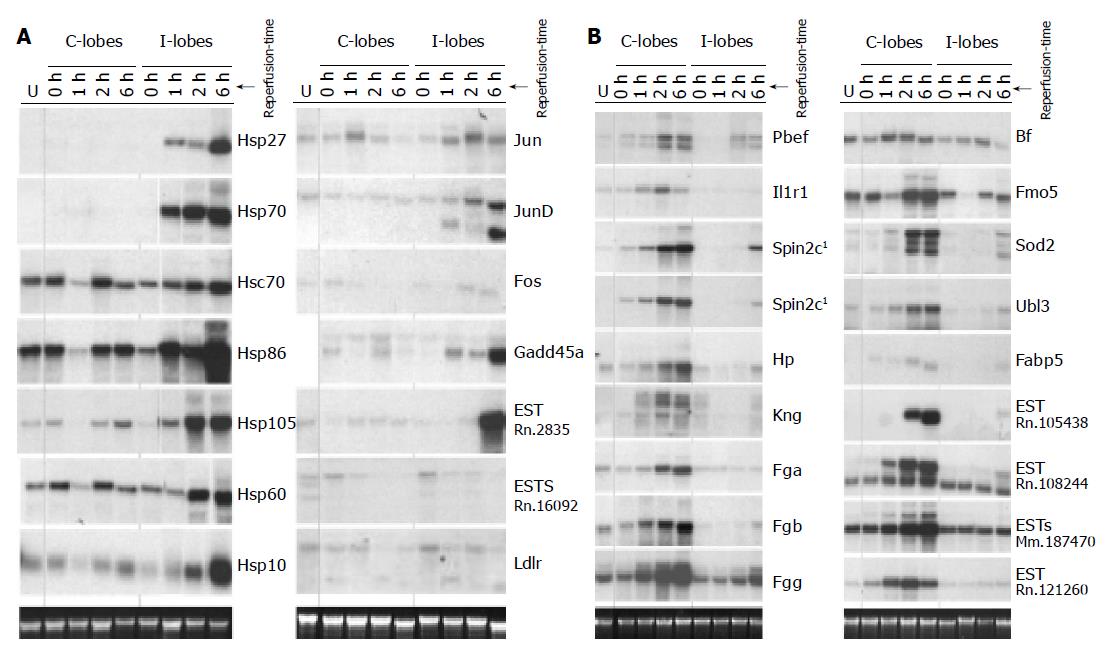
Figure 5 Expression profiling (Northern blot analysis) of 31 genes, untreated and postischemic rat livers after partial WI/R in a reperfusion time kinetics.
A: Twelve I-lobe up-regulated genes and two down-regulated sequences after WI/R; B: Genes with enriched RNA in the C-lobes, untreated liver (U), two overlapping Spin2c probes used for independent Northern blot experiments (1).
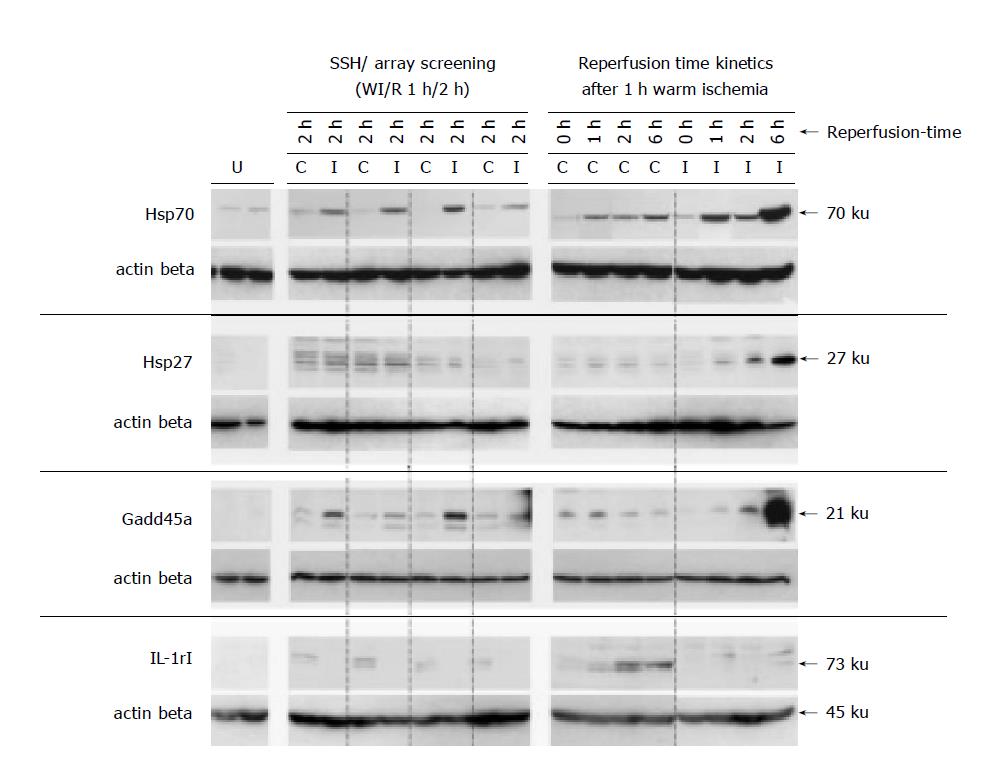
Figure 6 Expression of Hsp70, Hsp27, Gadd45a, IL-1rI and β-Actin proteins in rat livers after partial WI/R (Western blot data).
Two untreated rat livers (U); C-lobes and I-lobes after WI/R (C and I).
Figure 7 Gadd45a immunohistochemistry exemplarily after 1h/6h WI/R (cryosections).
A: C-lobe after WI/R (1 h/6 h); B: I-lobe after WI/R (1 h/6 h); C: Negative control, lacking the primary antibody in the immunohistochemical staining procedure.
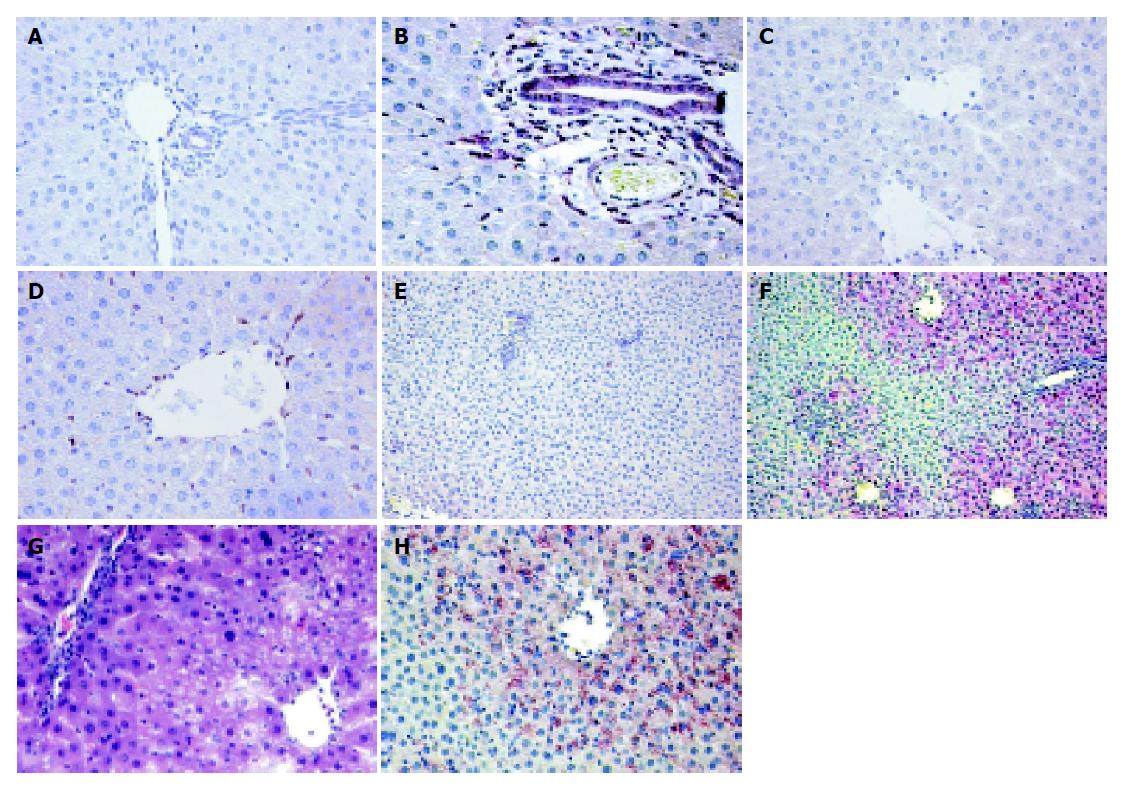
Figure 8 Hsp70 protein localization in rat livers after WI/R (paraffin-embedded sections).
Hsp70 staining of paraffin-embedded liver tissues after partial WI/R. Up to 2 h of reperfusion Hsp70 was located in sinusoidal cells and cholangiocytes, connective cells, endothelial cells of portal areas only in the I-lobes (I-lobes after 1 h/2 h WI/R: B+D), while Hsp70 was not detectable in the C-lobes at these time points (C-lobes after 1 h/2 h WI/R: A+C). Parenchymal Hsp70 staining was only noticed after 6 h reperfusion (C-lobe: E; I-lobe: F+H).Comparison of perivenular vacuolization (HE staining: G) and Hsp70 protein expression in the affected hepatocytes after 1 h/6 h WI/R (H).
- Citation: Fallsehr C, Zapletal C, Kremer M, Demir R, von Knebel Doeberitz M, Klar E. Identification of differentially expressed genes after partial rat liver ischemia/reperfusion by suppression subtractive hybridization. World J Gastroenterol 2005; 11(9): 1303-1316
- URL: https://www.wjgnet.com/1007-9327/full/v11/i9/1303.htm
- DOI: https://dx.doi.org/10.3748/wjg.v11.i9.1303


