Copyright
©2005 Baishideng Publishing Group Inc.
World J Gastroenterol. Oct 28, 2005; 11(40): 6277-6280
Published online Oct 28, 2005. doi: 10.3748/wjg.v11.i40.6277
Published online Oct 28, 2005. doi: 10.3748/wjg.v11.i40.6277
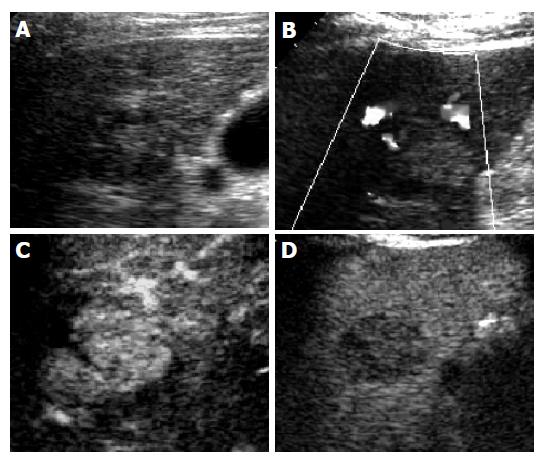
Figure 1 Typical HCC in contrast-enhanced sonography of hypervascular HCC before RFA.
A: Hypoechoic lesion in the right lobe of the liver on B-mode sonography; B: Blood signals of the lesion on CDFI; C: Intratumoral enhancement in the early arterial phase of contrast-enhanced sonography; D: Hypoechoic lesion compared to the peripheral liver tissue in the late phase.
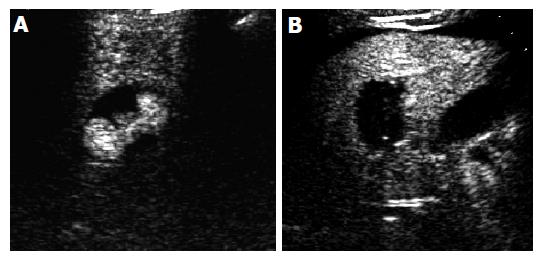
Figure 2 HCC after RFA.
A: Incomplete necrosis of the lesion in the early arterial phase of contrast-enhanced sonography; B: Complete necrosis of the lesion after further RFA.
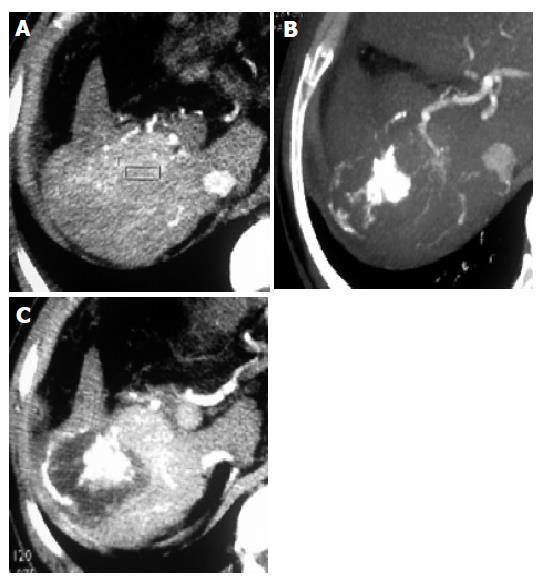
Figure 3 HCC treated with TACE and RFA.
A: Enhancement of the recurrent HCC after resection in the early arterial phase; B: After TACE, lesion restrained with iodine (red arrow) and an un-embolized feeding artery (yellow arrow) in the arterial phase; C: After RFA, no enhancement in the lesion in the early arterial phase (red arrow) and enhancement in the inner part of the lesion (yellow arrows) indicating incomplete necrosis.
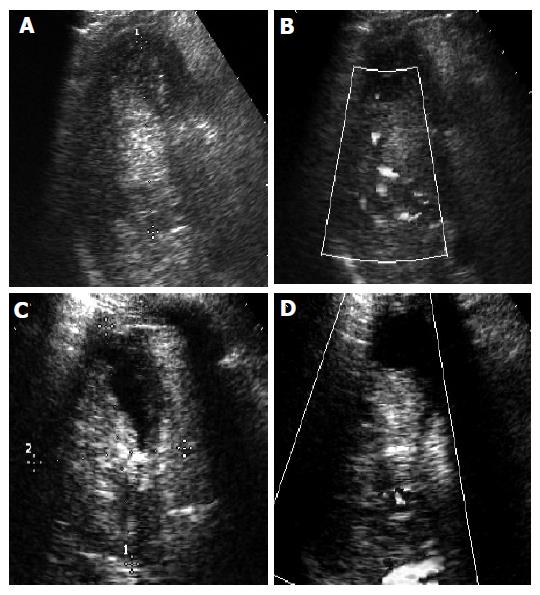
Figure 4 Recurrent HCC treated with TACE and RFA.
A: hyperechoic lesion on B-mode image; B: Color blood signals on CDFI; C: Irregular echo-free area in the lesion on B-mode image after combined treatment, indicating partial colliquation of the necrotic tumor; D: Color blood signals inside the tumor on CDFI, suggesting incomplete treatment.
- Citation: Luo BM, Wen YL, Yang HY, Zhi H, Xiao XY, Ou B, Pan JS, Ma JH. Percutaneous ethanol injection, radiofrequency and their combination in treatment of hepatocellular carcinoma. World J Gastroenterol 2005; 11(40): 6277-6280
- URL: https://www.wjgnet.com/1007-9327/full/v11/i40/6277.htm
- DOI: https://dx.doi.org/10.3748/wjg.v11.i40.6277


