Copyright
©The Author(s) 2022.
Artif Intell Gastroenterol. Oct 28, 2022; 3(4): 105-116
Published online Oct 28, 2022. doi: 10.35712/aig.v3.i4.105
Published online Oct 28, 2022. doi: 10.35712/aig.v3.i4.105
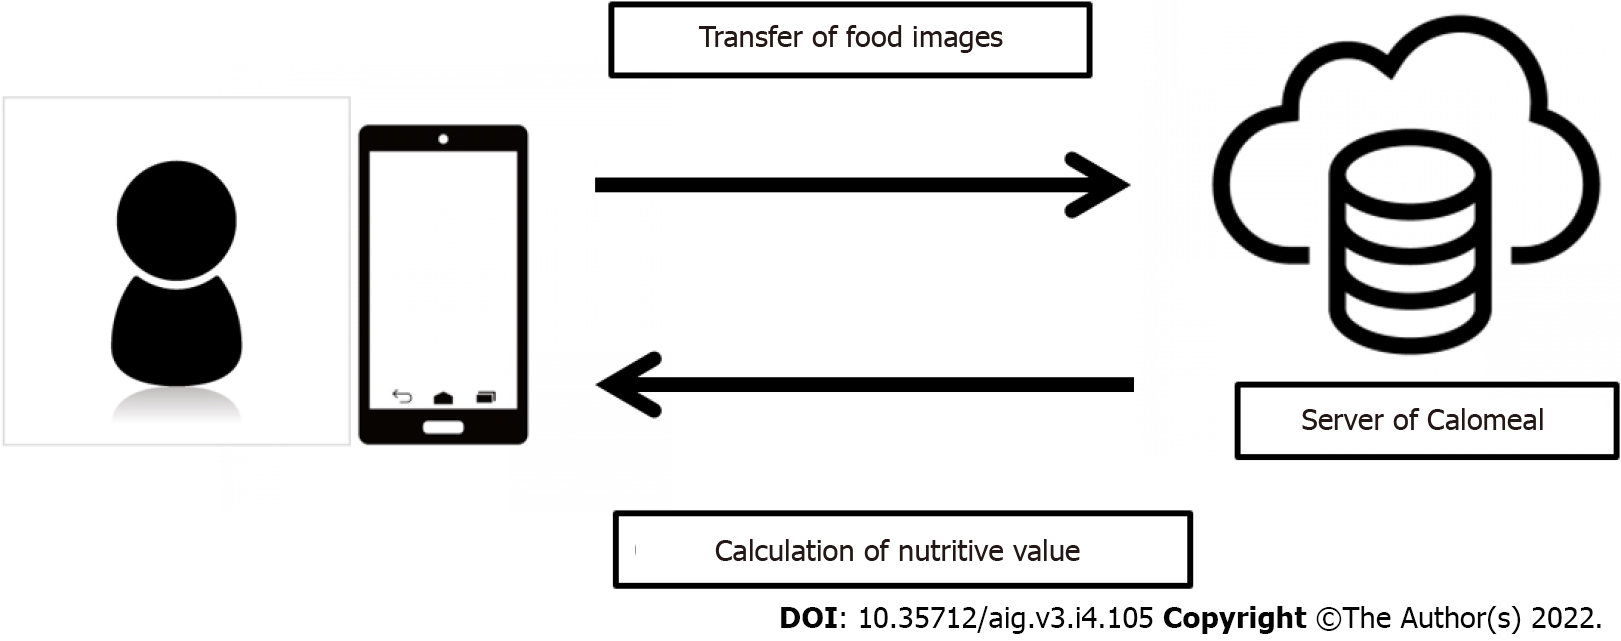
Figure 1 The concept of Calomeal.
When users take a photograph of their meals with their smartphones, the artificial intelligence on the Calomeal server calculates the nutritive value of the food included in the photograph, and the results are sent to the user’s device.
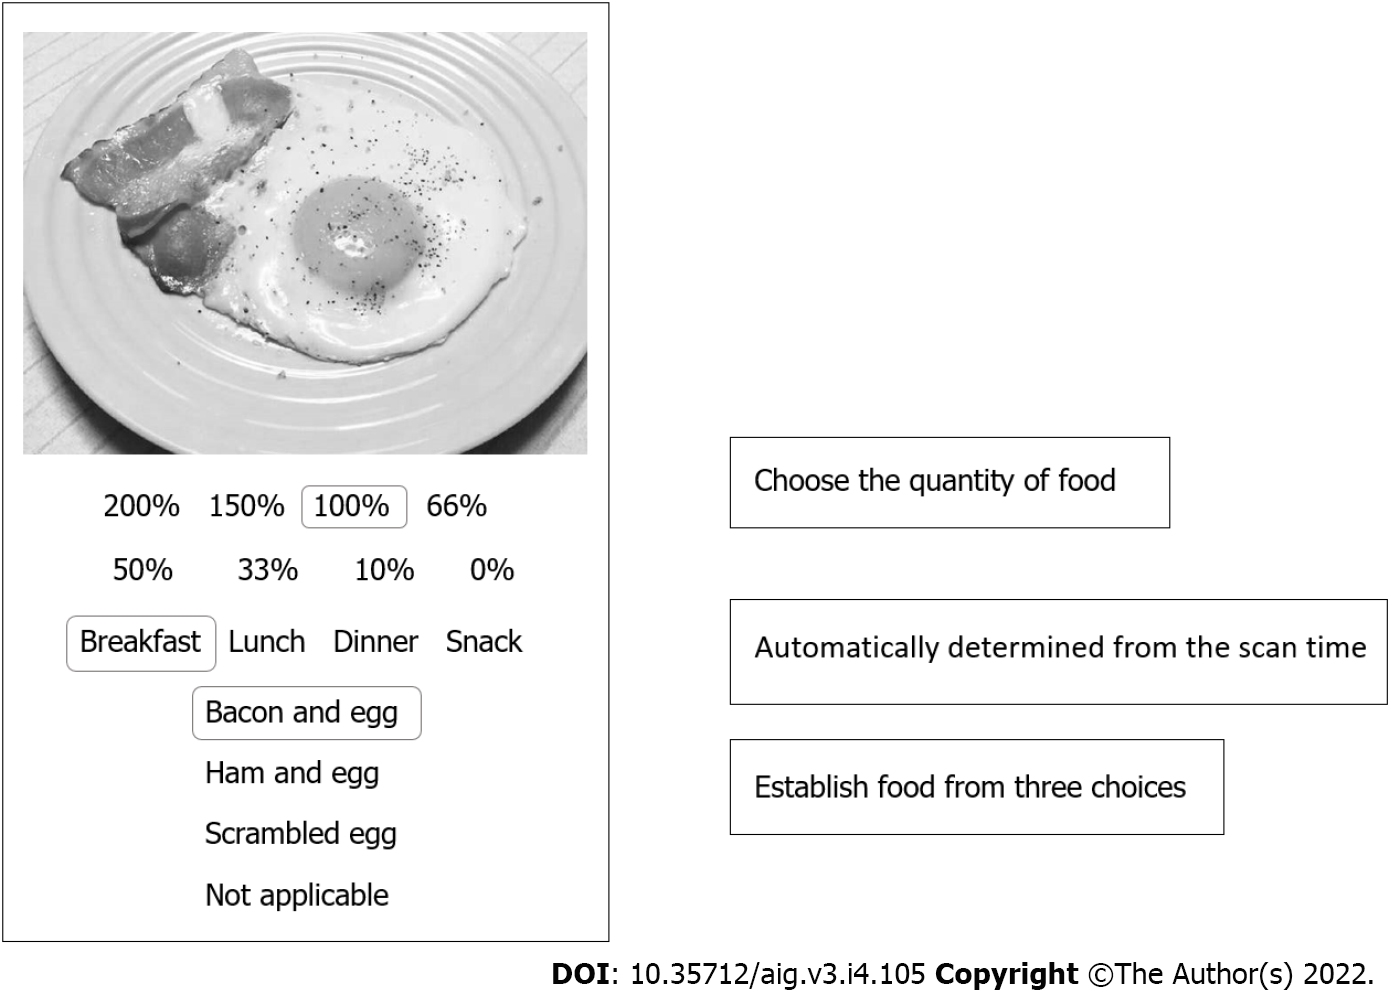
Figure 2 Display on the iPad Mini.
Instead of using a smartphone as the device, an iPad Mini, which has a larger screen, is used. When a patient photographs a food item, the artificial intelligence suggests the names of three possible food choices. The patient selects the food that he or she ate from one of the three choices. If none of the three choices matches, the patient chooses “no suitable choice.” Next, the patient selects the quantity of food consumed from the list of options. Eight options are available. Setting 100% as the normal serving size, the choices are as follows: 200%, 150%, 100%, 66% (about two-thirds), 50%, 33% (about one-third), 10% (about one bite), and 0% (picture was taken but no food was consumed). Breakfast, lunch, dinner, or snacks are automatically determined based on the time that the foods were photographed.
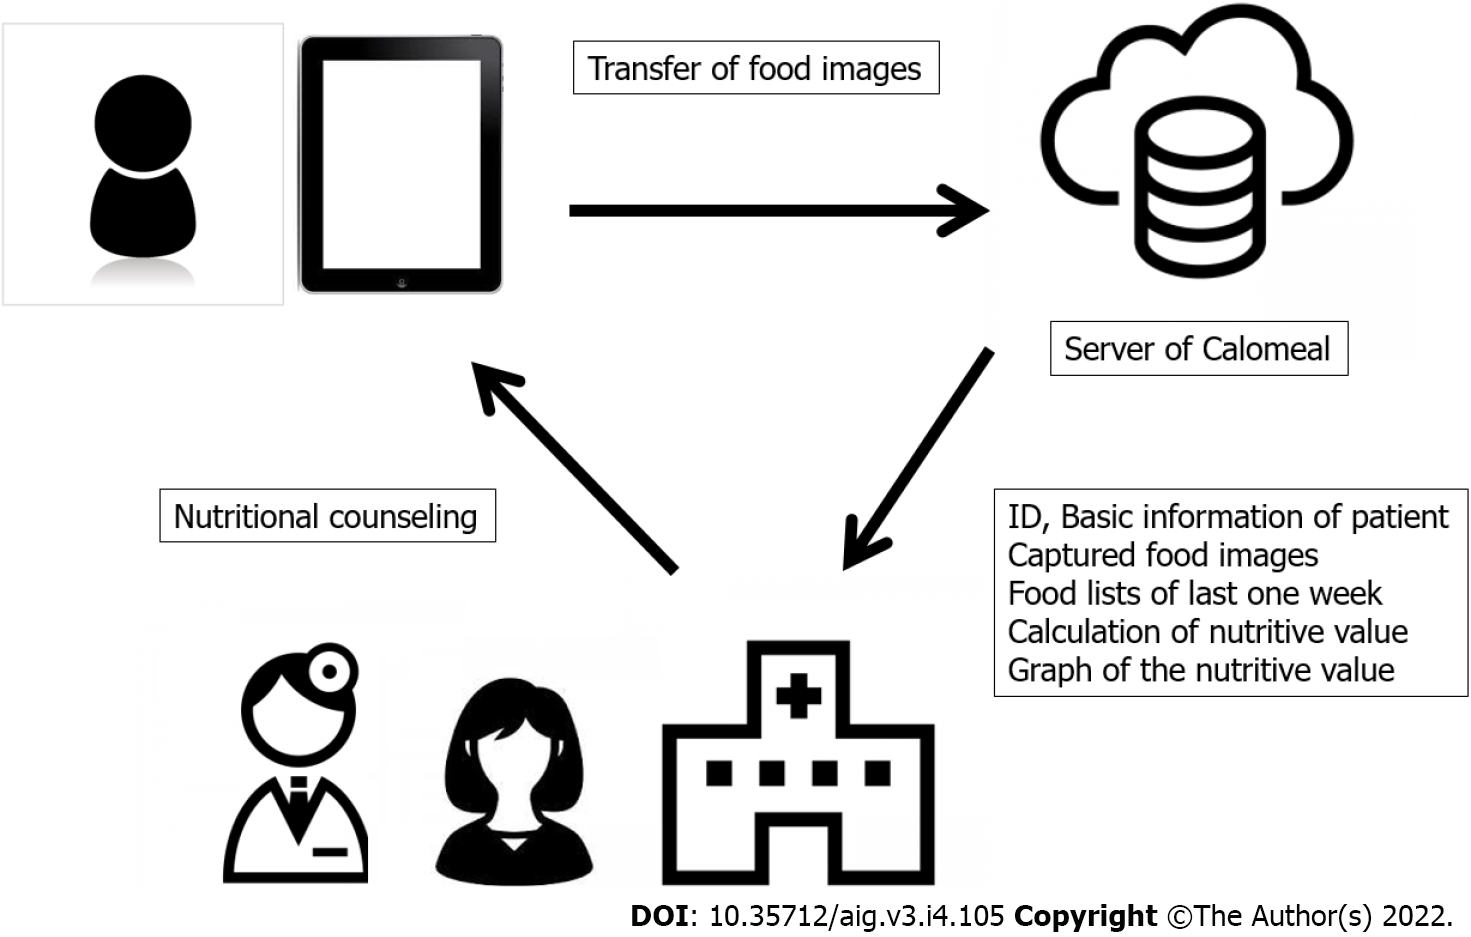
Figure 3 Calomeal concepts that were customized in this study.
The food images photographed with an iPad Mini are analyzed by the artificial intelligence on the Calomeal server. The following information is sent to the dedicated personal computer at the authors’ hospital: ID, basic information of patients, captured food images, food lists of last one week, calculation of nutritive value, and bar charts of the nutritive value. Registered dietitians conduct dietary counseling based on these data.
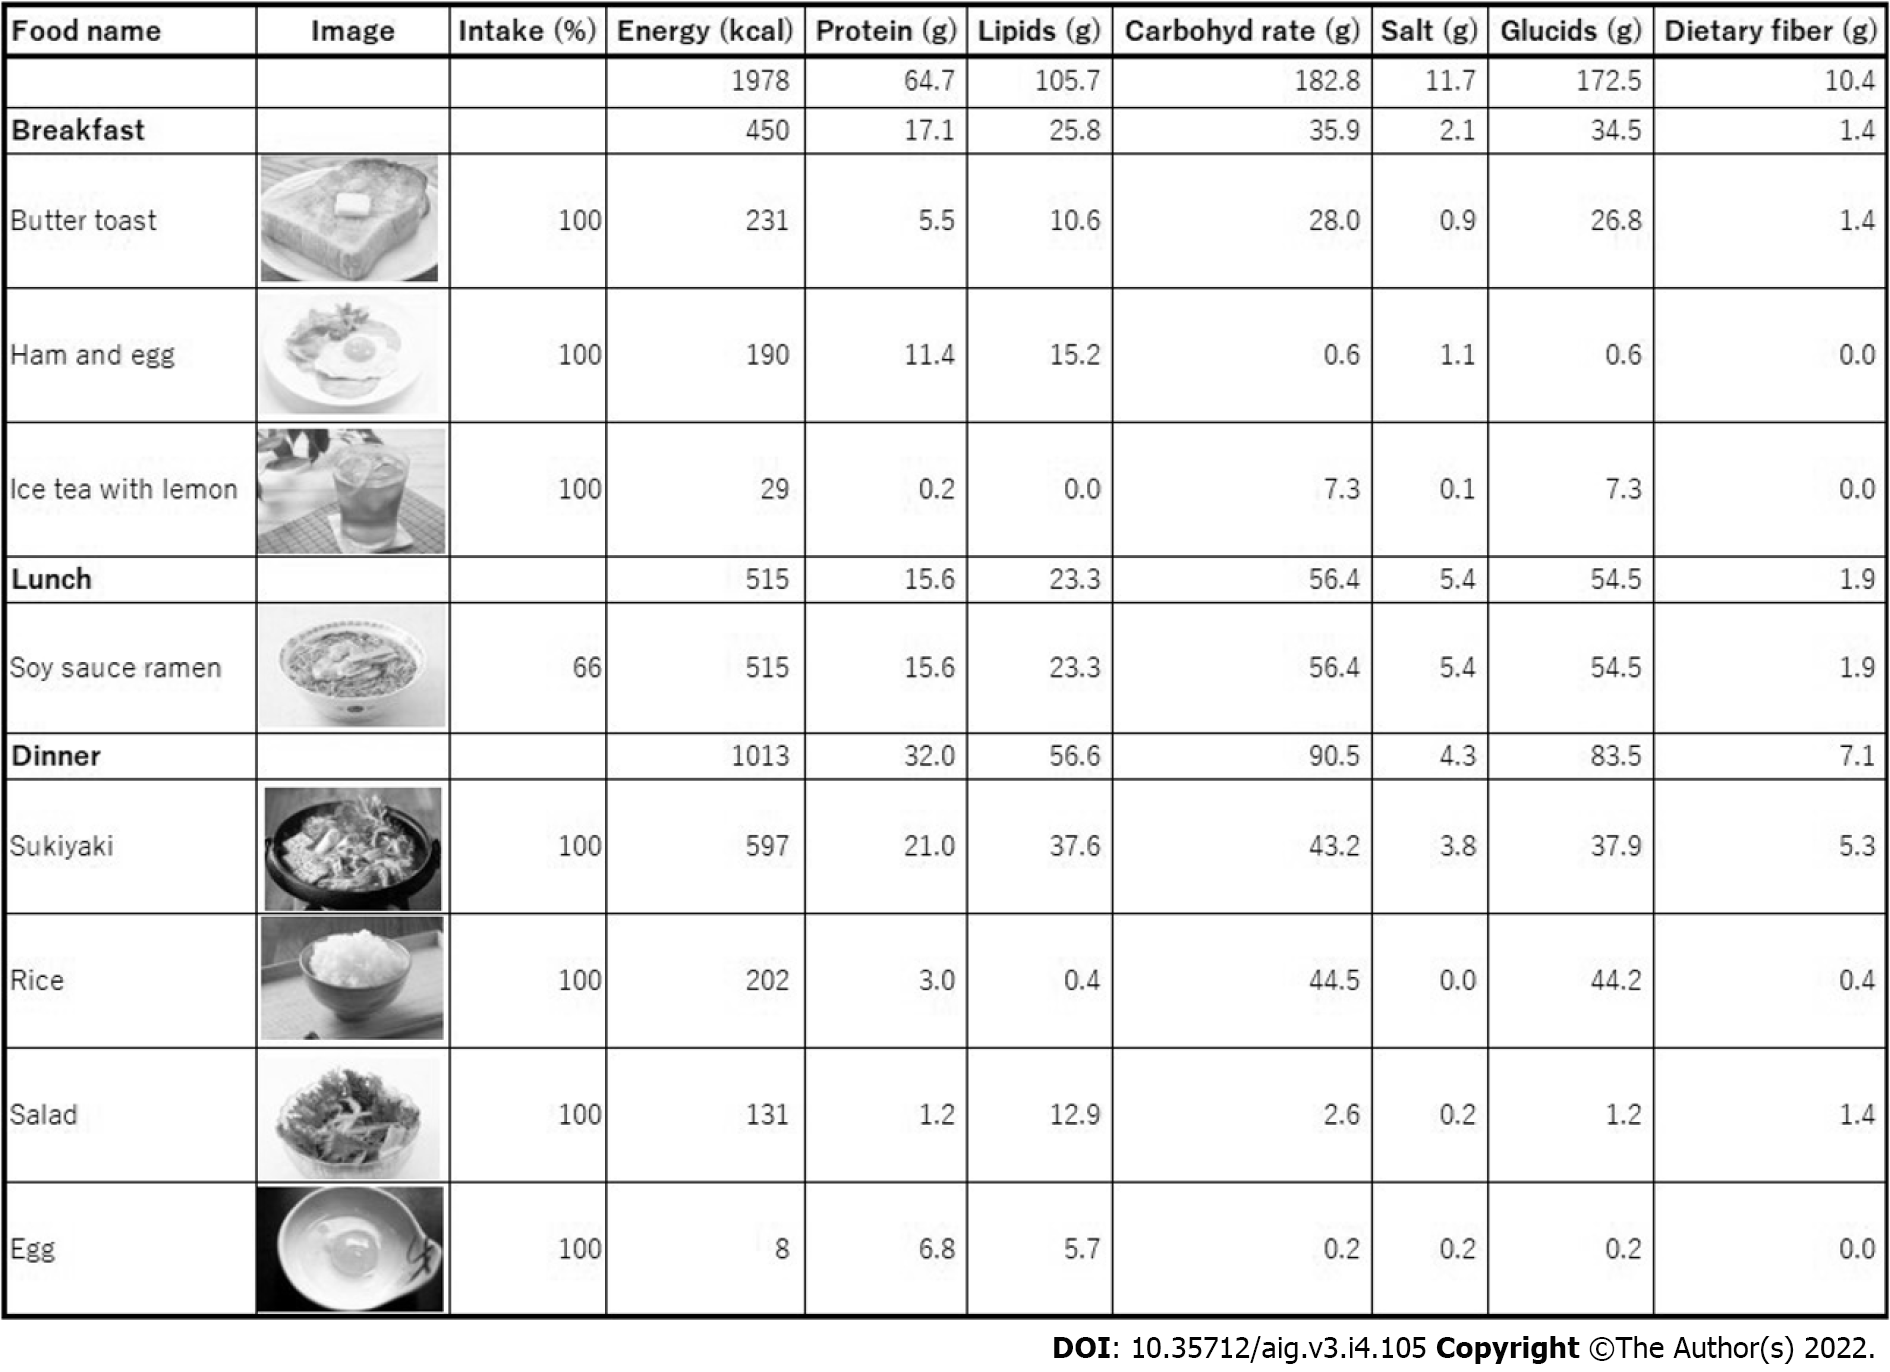
Figure 4 Analysis results of the photographed food images.
A list is created based on the results of the artificial intelligence calculation using food names and intakes (%) selected by patients. Energy, protein, lipid, carbohydrate, salt, glucide, and dietary fiber content of each meal over 1 wk are shown.
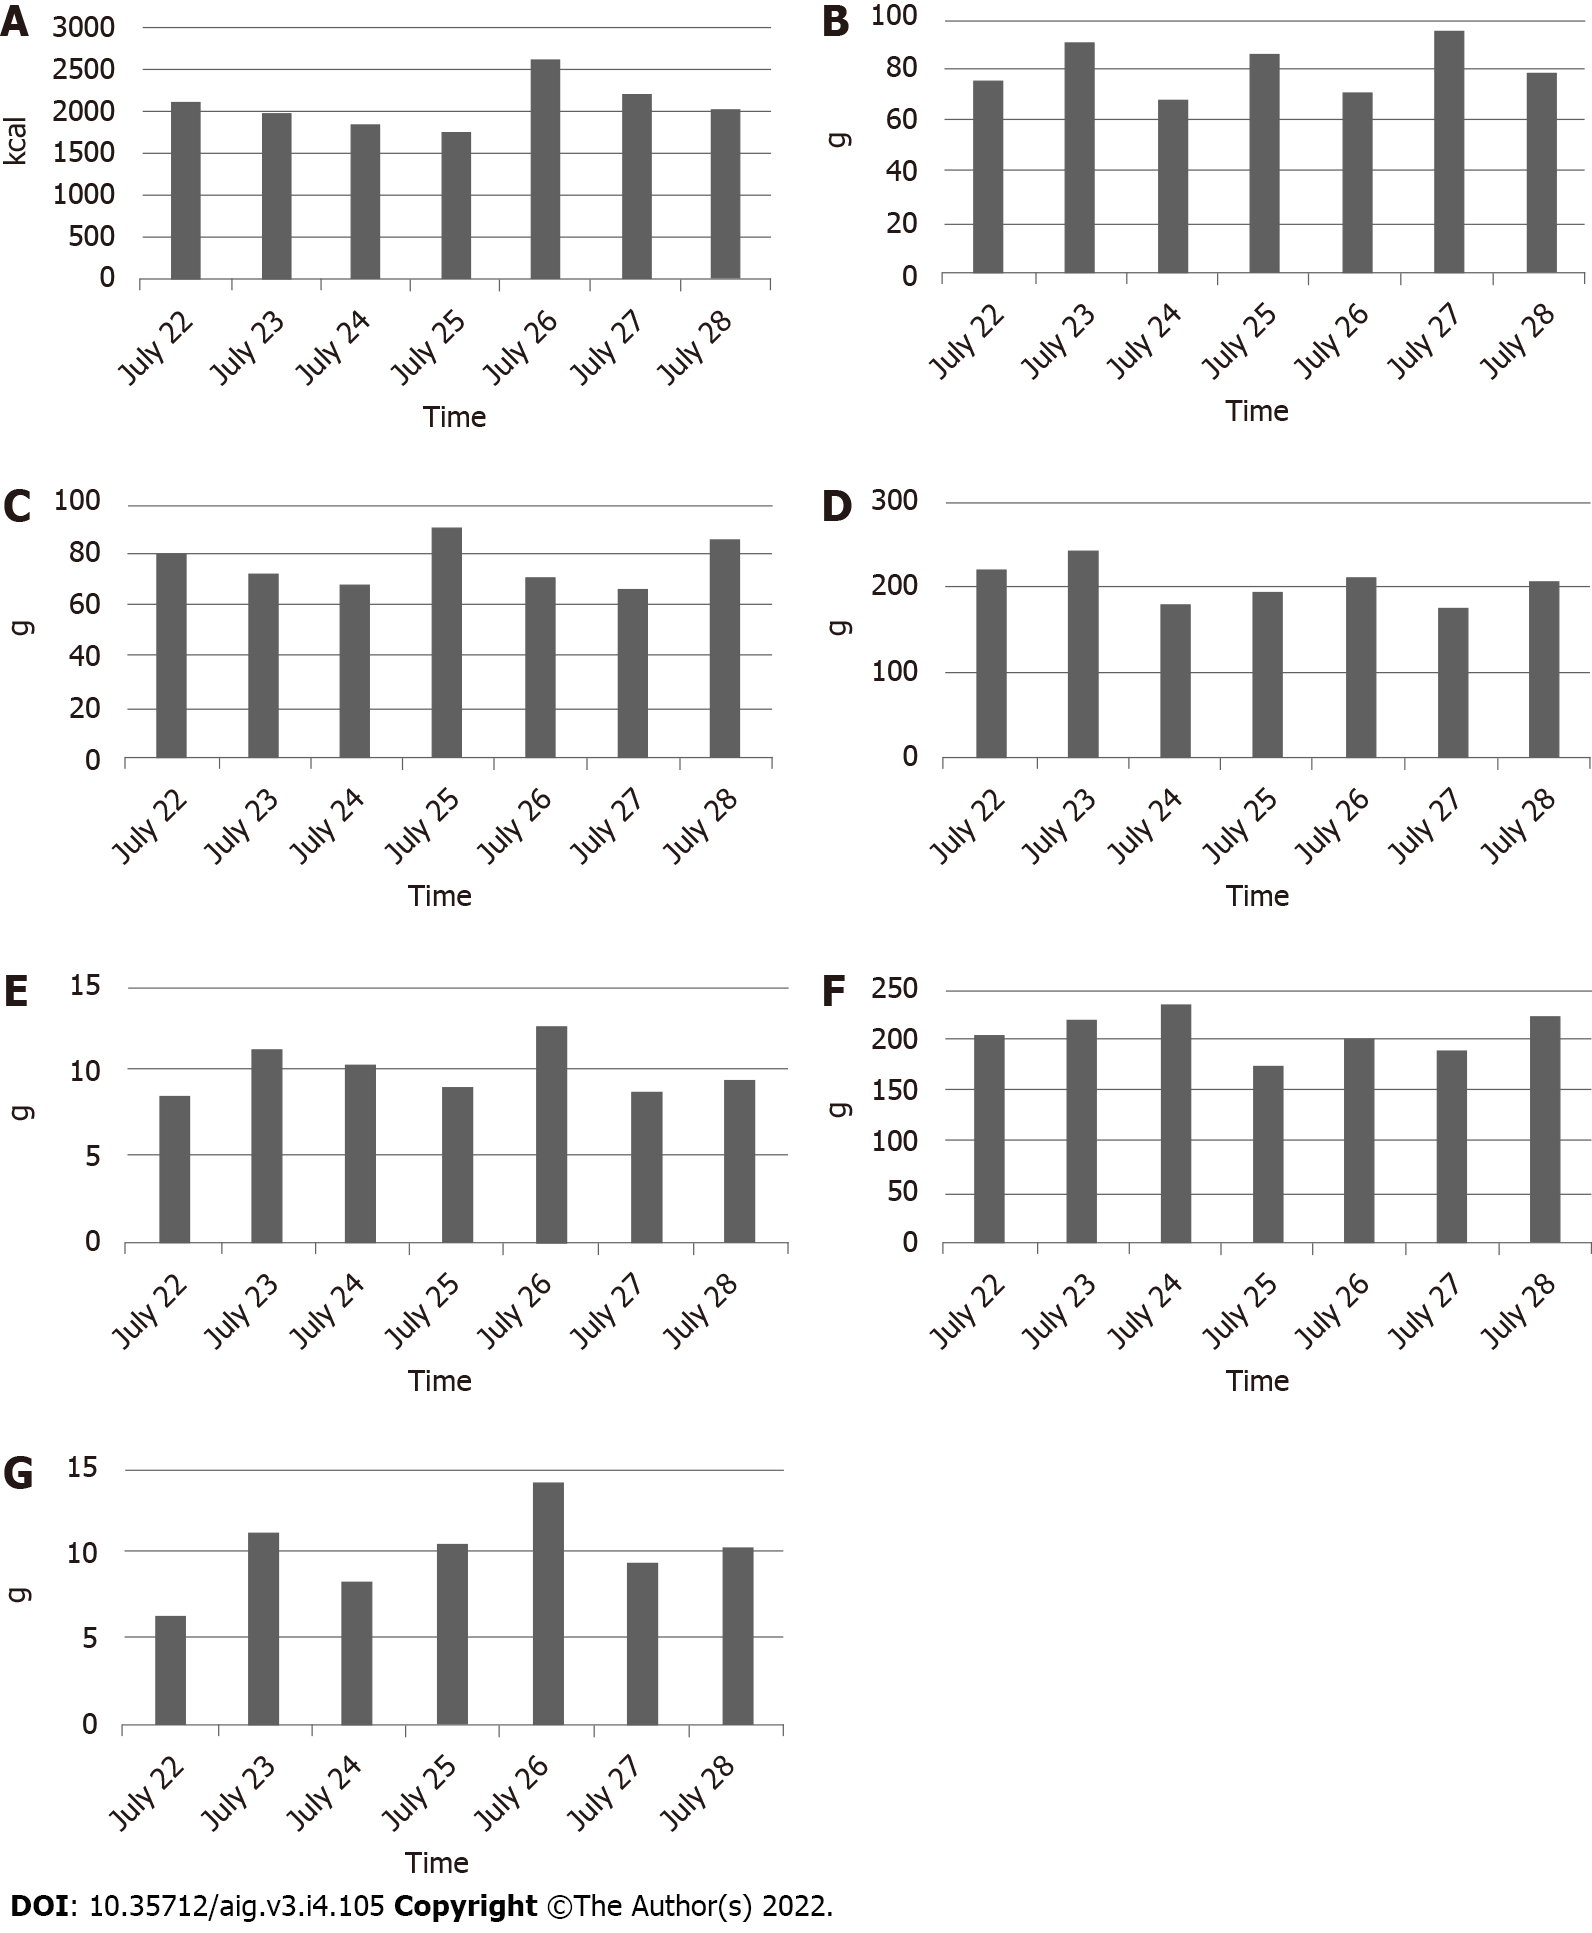
Figure 5 Bar charts of nutritive values for 1 wk.
A: Daily energy intake; B: Daily protein intake; C: Daily lipid intake; D: Daily carbohydrate intake; E: Daily salt intake; F: Daily glucide intake; G: Daily dietary fiber intake. The bar charts show the daily energy, protein, lipid, carbohydrate, salt, glucide, and dietary fiber intakes for 1 wk.
- Citation: Kusano Y, Funada K, Yamaguchi M, Sugawara M, Tamano M. Dietary counseling based on artificial intelligence for patients with nonalcoholic fatty liver disease. Artif Intell Gastroenterol 2022; 3(4): 105-116
- URL: https://www.wjgnet.com/2644-3236/full/v3/i4/105.htm
- DOI: https://dx.doi.org/10.35712/aig.v3.i4.105


