Published online Nov 26, 2014. doi: 10.13105/wjma.v2.i4.179
Revised: October 16, 2014
Accepted: October 28, 2014
Published online: November 26, 2014
Processing time: 280 Days and 10.3 Hours
AIM: To propose a new meta-analysis method for bivariate P value which account for the paired structure.
METHODS: Studies that look to test two different features from the same sample gives rise to bivariate P value. A relevant example of this is testing for periodicity as well expression from time-course gene expression studies. Kocak et al (2010) uses George and Mudholkar’ (1983) “Difference of Two Logit-Sums” method to pool bivariate P value across independent experiments, assuming independence within a pair. As bivariate P value need not to be independent within a given study, we propose a new meta-analysis approach for pooling bivariate P value across independent experiments, which accounts for potential correlation between paired P-values. We compare the “Difference of Two Logit Sums”method with our novel approach in terms of their sensitivity and specificity through extensive simulations by generating P value samples from most commonly used tests namely, Z test, t test, chi-square test, and F test, with varying sample sizes and correlation structure.
RESULTS: The simulations results showed that our new meta-analysis approach for correlated and uncorrelated bivariate P value has much more desirable sensitivity and specificity features compared to the existing method, which treats each member of the paired P value as independent. We also compare these meta-analysis approaches on bivariate P value from periodicity and expression tests of 4936 S.Pombe genes from 10 independent time-course experiments and we showed that our new approach ranks the periodic, conserved, and cycling genes significantly higher, and detects many more periodic, “conserved” and “cycling” genes among the top 100 genes, compared to the ‘Difference of Two Logit-Sums’ method. Finally, we used our meta-analytic approach to compare the relative evidence in the association of pre-term birth with preschool wheezing versus pre-school asthma.
CONCLUSION: The new meta-analysis method has much better sensitivity and specific characteristics compared to the “Difference of Two-Logit Sums” method and it is not computationally more expensive.
Core tip: In meta-analysis of bivariate P value, keeping the inherent paired structure and thus reserving the correlation between the each member of the paired P-values is critical. In this work, we propose a novel meta-analysis technique which does keep this paired structure intact and thus results in much more favorable sensitivity and specificity characteristics compared to the existing method by George and Mudholkar’ (1983), which treats the P value as independent.
-
Citation: Kocak M. Meta-analysis of bivariate
P values. World J Meta-Anal 2014; 2(4): 179-185 - URL: https://www.wjgnet.com/2308-3840/full/v2/i4/179.htm
- DOI: https://dx.doi.org/10.13105/wjma.v2.i4.179
It is common to combine independent P values when pooling data from independent experiments. For meta-analysis of univariate P values, Fisher[1] proposed a simple transformation of P values to reach a chi-square distribution. Similarly, Stouffer et al[2] used a probit transformation and George et al[3] proposed the use of sum of logit transformations of the P values. All these approaches exploit the fact that the P values has a uniform distribution under the null hypothesis. Each of these approaches also has a weighted version.
Bivariate (or multivariate) P values arise when two (or more) different hypotheses are tested on the same data to summarize the evidence for two (or more) features. For example, in cell-cycle gene expression setting, two running hypotheses can be the test for periodicity (FEATURE-I) and test for expression (FEATURE-II). The main interest here is to show which of the two features has relatively more evidence of significance. This “relative evidence” can provide practical advantages when the researcher wants to pick one factor over the other. For example, in clinical trials, a researcher may want to stratify the patients based on a single diagnostic or prognostic factor, while other significant factors may also be present. In such a case, comparing the “relative evidence” for a given factor (feature) over the others may be quite practical as the researcher may want to choose the factor that has the highest relative evidence of significance for stratification.
As the tests are applied to the same data, some types of correlation are expected between the resulting P values. For example, it can be argued that genes that follow a cyclic pattern overtime are more likely to be highly expressed than genes that do not follow a cyclic pattern. Due to this nature of these types of concurrent hypothesis tests, a meta-analytic method that takes the correlation structure between the two P values testing (i.e., two different features) using the same dataset is highly needed.
In the following sections, we briefly describe a meta-analysis method for bivariate P values by George et al[4], which is based on logit transformation of P values, followed by a new proposal for meta-analysis of bivariate P values. We compare the two approaches using extensive simulations and through an application to the time-course cell cycle gene expression data from 10 independent S.Pombe experiments. We also utilize our meta-analytic approach to compare the relative evidence in the association of pre-term birth with preschool wheezing versus pre-school asthma, and we finish with discussions.
In Kocak et al[5], the difference of two logit sums method by George et al[4] was used as described in Section 2.3. The test statistic for this approach is a simple difference of the sums of logits of P values as follows:
For a sample of pairs of P values,
Math 4
, Math 5
which can be rewritten as
Math 6
Then under the intersection of null hypotheses,
Math 7
and,
Math 8
Math 9
, and
Math 10
are convolutions of logistic random variables. George et al[4] computed the exact distribution of such convolutions and showed that this distribution can be accurately approximated using a t distribution. Specifically, T1 and T2 are both distributed as
Math 11
. Consequently, under the intersection of null hypotheses,
Math 12
and
Math 13
T1 - T2 is a convolution of 2n logistic random variables. Thus,
Math 14
is accurately approximated by
Math 15
. Although the above test statistic is in fact the sum of the log of the odds ratios, it is clear that the “paired” nature of the P values is broken and irrelevant as the test statistic is invariant to swapping the member of a pair with another member from another independent experiment. We believe that the “paired” structure should not be broken as it preserves the correlation structure between the P values intact.
To keep the “paired” structure of the pairs of P values, we employ the following approach: For pairs of P values,
Math 16
, representing the evidence for Feature-I and Feature-IIrespectively from n independent experiments, we keep the “paired” structure through the test statistic,
Math 17
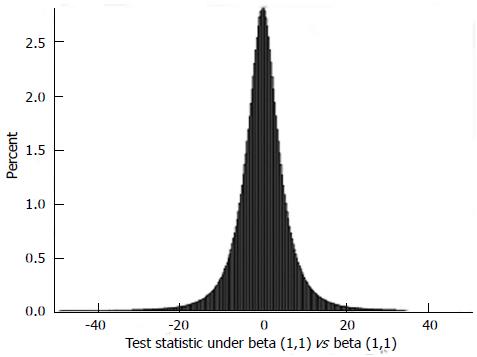
. This test statistic has a symmetric probability density function about zero (μ0 = 0) and has sharply reducing left and right tails as shown in Figure 1 below, where the P-values for two features come from two independent uniform distributions [i.e., Beta(1,1) vs Beta(1,1)] :Then, we test the following hypotheses: H1:μ0≤ 0 vs H1:μ0 > 0, where the null hypothesis states that the meta-evidence for Feature-II is at least as much as the meta-evidence for Feature-I whereas the alternative hypothesis states the exact opposite.
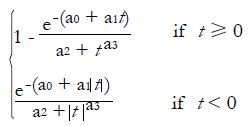
After numerous attempts to find an approximating cumulative distribution function (CDF) for Tmeta, we observed that a CDF of the form
Math 18
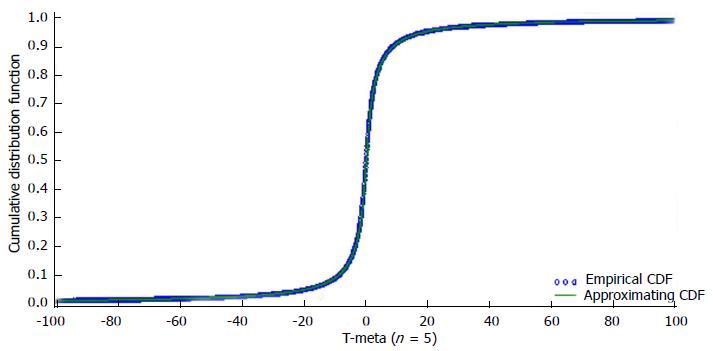
provides very close approximation to the CDF of our meta-test statistic (Tmeta) under the null hypothesis. For a sample of bivariate P-values, we estimate the four parameters involved in this approximating CDF (namely, α0, α1, α2, α3) by fitting a non-linear regression model to the value of the test statistic for 10000000 P value samples generated from independent standard uniform distributions as Beta(1,1) and Beta(1,1) with varying sizes. For sample size n = 5, Figure 2 illustrates the closeness of such an approximation to the empirical CDF for Tmeta, and we provide the estimates of α0, α1, α2, α3 in Table 1.
| Sample size | α0 | α1 | α2 | α3 |
| 3 | -0.7842 | 0.0822 | 4.5194 | 1.4353 |
| 4 | -1.2092 | 0.071 | 6.9087 | 1.5018 |
| 5 | -1.5419 | 0.0639 | 9.6286 | 1.5474 |
| 6 | -1.8161 | 0.0596 | 12.6637 | 1.5761 |
| 7 | -2.0475 | 0.0557 | 15.9471 | 1.6005 |
| 8 | -2.2507 | 0.0528 | 19.555 | 1.6202 |
| 9 | -2.4347 | 0.0511 | 23.4612 | 1.6324 |
| 10 | -2.5823 | 0.0493 | 27.1803 | 1.6403 |
The null case was generated from a pair of beta distributions, [Beta(1,1),Beta(1,1)]. To generate the alternative cases, we used the following strategy: (1) Generate samples of P-values from a pair of Z tests, t Tests, χ2 tests, and F-tests. At this point, we have a sample of pairs of P values,
Math 19
where n = 100000; (2) Apply the probit transformation
Math 20
and compute the corresponding mean and variance,
Math 21
, of
Math 22
and (3) Generate two samples of desired size from standard normal distributions,
Math 23
and for each pair,
Math 24
, obtain the corresponding correlated pair via
Math 25
for a given ρ.
In our simulations, we set the r to be -0.8, -0.5, 0, 0.5, and 0.8, and generated 1000 paired samples of P values with sample sizes 5 and 10 based on the bivariate tests listed in Table 2.
| Scenario | Distribution-1 | Distribution-2 | Comment |
| 1 | Beta(1,1) | Beta(1,1) | Null Case |
| 2 | Z test, Δ = 0.5 | Z test, Δ = 0.25 | One-sample Z test with sample size = 10 |
| 3 | T test, Δ = 0.5 | T test, Δ = 0.25 | One-sample t test with sample size = 10 |
| 4 | χ2 test, Δ = 1.5 | χ2 test, Δ = 1.25 | One-sample χ2 test of variance with sample size = 10 |
| 5 | F test, Δ = 0.5 | F test, Δ = 0.25 | One-way ANOVA with three class-levels of size = 10 |
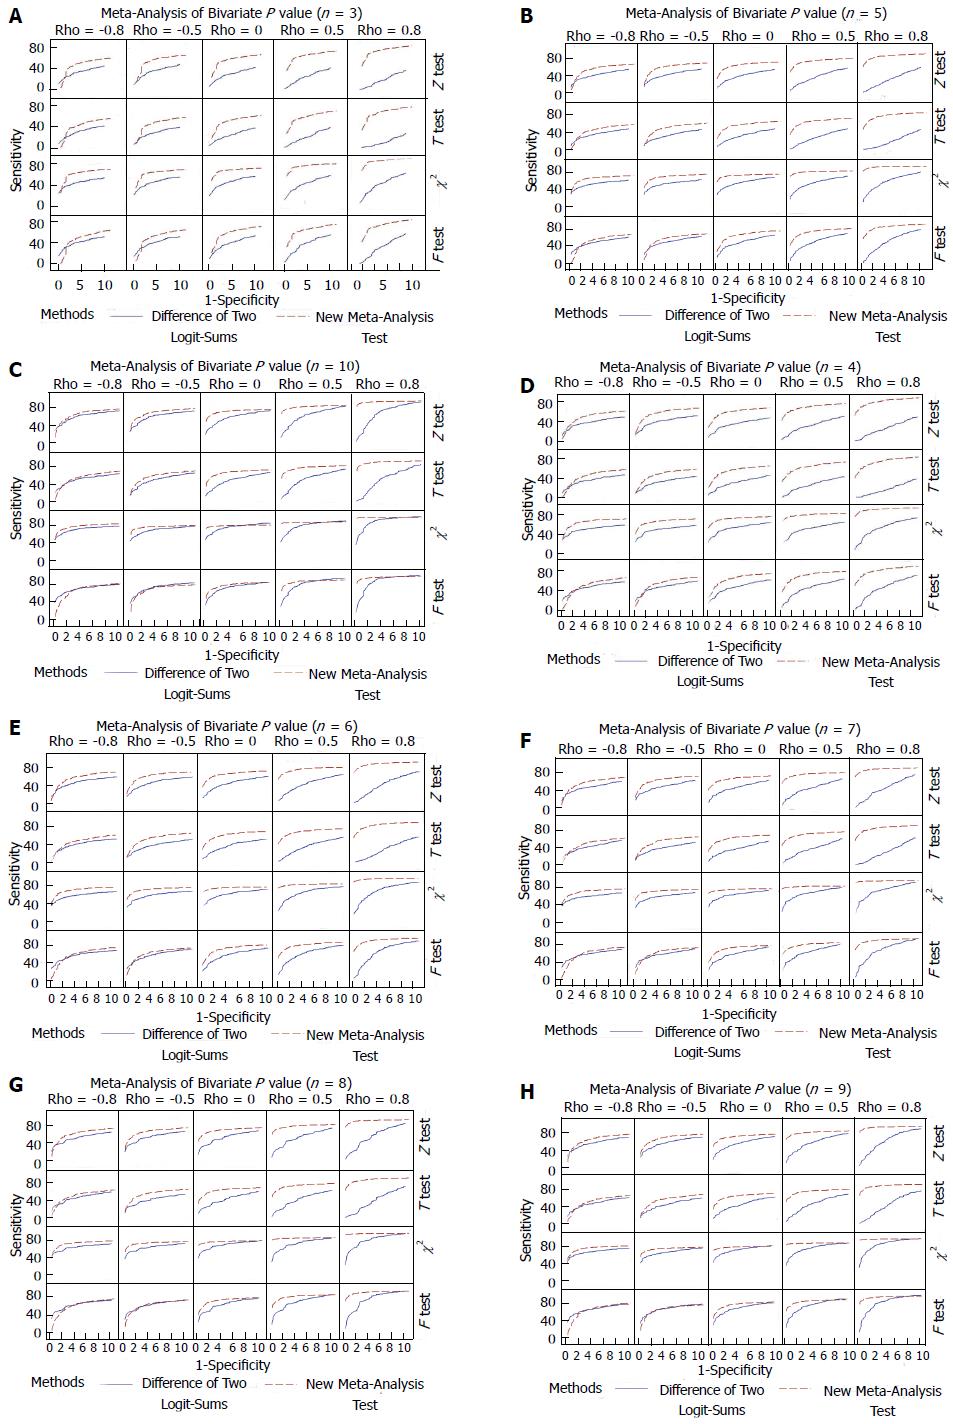
We present the results of the simulations below in Figure 3 for Bivariate P value samples of size 3, 5, and 10, respectively, and for the remaining sample sizes (n = 4, 6, 7, 8, 9) where the first row of the graph shows the degree of correlation between the P values in a given pair.
Clearly, our new meta-analysis approach has much more desirable sensitivity and specificity, which is more pronounced when the correlation between the P value pairs gets stronger towards the positive end of the correlation spectrum. It is worth noting that the sensitivity and specificity get weaker for the Difference of Two Logit-sums method as the correlation gets stronger towards positive correlations, while the sensitivity and specificity of our new meta-analysis method increases as the correlation between the P values increases.
Kocak et al[6] investigated the cyclic behavior of 4936 genes from 10 independent time-course experiments conducted on Schizosaccharomyces Pombe (S. Pombe) yeast cells (Rustici et al[7], Oliva et al[8], Peng et al[9]. We have utilized the P-values from their Empirical Bayes Periodicity test as FEATURE-1 of the bivariate P values. Kocak et al[5] analyzed data from the same set of experiments in terms of whether or not a given gene is expressed, which served as FEATURE-2 of the bivariate P values. In short, we have a pair of P values for a given S. Pombe gene: one for the testing of periodicity, and the other for the testing for expression. Our aim in this analysis is to identify genes that are “relatively more periodic and being expressed” and we will compare the two meta-analytic approaches in terms of their ability to detect truly periodic genes. To do that, we used a benchmark set of 40 periodic genes reported by Marguerat et al[10], and sets of 52 “conserved” genes 235 “cycling” genes reported by Lu et al[11].
From Table 3, it is clear that our new meta-analysis approach ranked the periodic genes much higher and detected 20 of the periodic genes in Top 100 while the “Difference of Two Logit Sums” method did not detect any of them in Top 100.
| Method | Periodic genes by Marguerat et al[10] (2006) n = 40 | Conserved genes by Lu et al[11] (2007) n = 52 | Cycling genes by Lu et al[11] (2007)n = 235 | |||
| Median rank | No. of genes in top 100 genes | Median rank | No. of genes in top 100 genes | Median rank | No. of genes in top 100 genes | |
| Difference of two logit sums | 4072 | 0 | 3738 | 2 | 3405 | 5 |
| New meta-analysis method | 102 | 20 | 697 | 13 | 745 | 37 |
Similarly, the new Meta-analysis method ranked the conserved and cycling genes significantly higher compared to the other three methods, and among the top 100 genes, it detected 13 “Conserved” genes and 37 “Cycling” genes while the “Difference of two Logit Sums” method detected only 2 and 5, respectively.
Sonnenschein-van der Voort et al[12] conduct a meta-analysis of 28 independent European studies investigating the association between pre-term birth and pre-school wheezing, and 18 European studies investigating pre-term birth and pre-school asthma. There were 16 studies reporting the results for both pre-school wheezing and asthma. We applied our bivariate meta-analysis approach to assess the relative evidence for the pre-school wheezing compared to the pre-school asthma. The resulting meta-pvalue from those 16 studies is 0.0000054, suggesting that there is significantly more evidence for an association of pre-school wheezing with pre-term birth compared to that of pre-school asthma.
The above authors similarly investigated the association of pre-school wheezing and asthma in relation with low birth weight and there were 14 studies with results for both pre-school wheezing and asthma. Meta-pvalue based on our meta-analysis method for these 14 studies turned out to be 0.016, suggesting that there exists slightly more evidence for an association between pre-school asthma and low birth weight compared to that of pre-school wheezing.
We proposed a new approach for pooling bivariate P-values and we have shown through simulations that the proposed method for bivariate P values has much better sensitivity and specificity under varying degree of correlation between the P values in a given pair of P values. Our new approach for meta-analysis of bivariate P values preserves the “paired” structure between the P values in a given P values pair, which in term keeps the possible correlation within a pair intact.
In application to bivariate P values testing for periodicity and expression of S.Pombe genes, we have shown that our new meta-analysis method ranked the periodic, “conserved” and “cycling” genes much higher compared to the “Difference of Two Logit Sums” method, which ignores the “paired” nature of the P value pairs while this “paired” nature is especially relevant in periodicity and expression testing since it is expected that the periodic genes are expected to be more expressed as the gene expression oscillates as the cell division process moves from a cell cycle phase to another phase.
We also applied our meta-analysis method for a collection of European studies investigating the association between pre-school wheezing and asthma with pre-term birth and as well as low birth weight. We showed that there is relatively more evidence for an association between pre-school wheezing and pre-term birth compared to that of pre-school asthma. This finding supports the results of the meta-analysis conducted by Sonnenschein-van der Voort et al[12] who reported a meta odds ratios (95%CI) of 1.34 (1.25, 1.43) for the former association and 1.40 (1.18, 1.67) for the latter association, where it is clear that the former meta-odds ratio has much lower standard error.
Currently, we are using the empirical approximating cumulative distribution function of our meta-analysis test statistic (Tmeta) and an analytic version of the probability density and distribution functions of our test statistic is needed to be identified. We also plan to approach the meta-analysis of bivariate (and multivariate) P values on a Bayesian setting without breaking the “paired” (or “joint” in the multivariate case) nature of the P values.
I like to thank Dr. Ebenezer O George of the University of Memphis, and Dr. Stanley Pounds of St. Jude Children’s Research Hospital for the helpful discussions on the new meta-analysis method on the results of the simulations.
Meta-analysis of p-values is an efficient way of utilizing and summarizing study results coming from similar experimentation conditions. Meta-analysis of univariate P values was of interest for almost a century now and several competing methods were introduced. Meta-analysis of bivariate P values did not attract much interest as most research focused on single endpoints and carried out multiple parallel univariable meta-analysis instead of meta-analysis with bivariate or multivariate P values.
There is no readily available meta-analysis method for bivariate P values coming from two concurrent hypotheses on the same data, which take into account the correlation structure between the two hypothesis tests.
The only existing method of the meta-analysis of bivariate p-values assumes that the pairs of P values are independent of each other, which is limitation to be statistically addressed as pairs of P values stemming from the same study are expected to be correlated. In this manuscript, the authors introduce a new meta-analytic technique that takes into account the correlation structure between the P in a given pair.
The authors have applied their new method on cell-cycle gene expression data from ten independent studies as well as the pre-term birth outcome data.
Meta-Analysis: Combining statistical results from independent yet similar studies to produce an overall finding in a specific area of research. Bivariate P values: A pair of P values produced from concurrent hypothesis tests for two associations in the same dataset.
The author showed that the meta-analysis approach has much more desirable sensitivity and specificity, which is more pronounced when the correlation between the P values pairs gets stronger towards the positive end of the correlation spectrum (Figure 2).
P- Reviewer: Puddu PE S- Editor: Ji FF L- Editor: A E- Editor: Wu HL
| 1. | Fisher RA. Statistical Methods for Research Workers. 14th ed. Edinburg and London: Oliver and Boyd 1970; . |
| 2. | Stouffer SA, Suchman EA, Devinney LC, Star SA, Williams RM. The American soldier: Adjustment ring army life. Princeton, NJ: Princeton University Press 1949; 43-53. |
| 3. | George EO, Mudholkar GS. (1977). The logit method for combining independent tests. Institute of Mathematical Statistics Bulletin. 1977;6:212. |
| 4. | George EO, Mudholkar GS. On the Convolution of Logistic Random Variables. Metrika. 1983;30:1-14. [RCA] [DOI] [Full Text] [Cited by in Crossref: 22] [Cited by in RCA: 14] [Article Influence: 0.3] [Reference Citation Analysis (0)] |
| 5. | Kocak M, Zheng G, Narasimhan G, George EO, Pyne S. Differential meta-analysis for testing the relative importance of two competing null hypotheses over multiple experiments. J Indian Soc Agr Stat. 2010;64:1-10. |
| 6. | Kocak M, George EO, Pyne S, Pounds S. An empirical Bayes approach for analysis of diverse periodic trends in time-course gene expression data. Bioinformatics. 2013;29:182-188. [RCA] [PubMed] [DOI] [Full Text] [Cited by in Crossref: 3] [Cited by in RCA: 4] [Article Influence: 0.3] [Reference Citation Analysis (0)] |
| 7. | Rustici G, Mata J, Kivinen K, Lió P, Penkett CJ, Burns G, Hayles J, Brazma A, Nurse P, Bähler J. Periodic gene expression program of the fission yeast cell cycle. Nat Genet. 2004;36:809-817. [RCA] [PubMed] [DOI] [Full Text] [Cited by in Crossref: 381] [Cited by in RCA: 359] [Article Influence: 17.1] [Reference Citation Analysis (0)] |
| 8. | Oliva A, Rosebrock A, Ferrezuelo F, Pyne S, Chen H, Skiena S, Futcher B, Leatherwood J. The cell cycle-regulated genes of Schizosaccharomyces pombe. PLoS Biol. 2005;3:e225. [RCA] [PubMed] [DOI] [Full Text] [Full Text (PDF)] [Cited by in Crossref: 143] [Cited by in RCA: 142] [Article Influence: 7.1] [Reference Citation Analysis (0)] |
| 9. | Peng X, Karuturi RK, Miller LD, Lin K, Jia Y, Kondu P, Wang L, Wong LS, Liu ET, Balasubramanian MK. Identification of cell cycle-regulated genes in fission yeast. Mol Biol Cell. 2005;16:1026-1042. [RCA] [PubMed] [DOI] [Full Text] [Cited by in Crossref: 131] [Cited by in RCA: 135] [Article Influence: 6.4] [Reference Citation Analysis (0)] |
| 10. | Marguerat S, Jensen TS, de Lichtenberg U, Wilhelm BT, Jensen LJ, Bähler J. The more the merrier: comparative analysis of microarray studies on cell cycle-regulated genes in fission yeast. Yeast. 2006;23:261-277. [RCA] [PubMed] [DOI] [Full Text] [Full Text (PDF)] [Cited by in Crossref: 47] [Cited by in RCA: 48] [Article Influence: 2.5] [Reference Citation Analysis (0)] |
| 11. | Lu Y, Mahony S, Benos PV, Rosenfeld R, Simon I, Breeden LL, Bar-Joseph Z. Combined analysis reveals a core set of cycling genes. Genome Biol. 2007;8:R146. [RCA] [PubMed] [DOI] [Full Text] [Full Text (PDF)] [Cited by in Crossref: 28] [Cited by in RCA: 35] [Article Influence: 2.1] [Reference Citation Analysis (0)] |
| 12. | Sonnenschein-van der Voort AM, Arends LR, de Jongste JC, Annesi-Maesano I, Arshad SH, Barros H, Basterrechea M, Bisgaard H, Chatzi L, Corpeleijn E. Preterm birth, infant weight gain, and childhood asthma risk: a meta-analysis of 147,000 European children. J Allergy Clin Immunol. 2014;133:1317-1329. [RCA] [PubMed] [DOI] [Full Text] [Cited by in Crossref: 233] [Cited by in RCA: 268] [Article Influence: 24.4] [Reference Citation Analysis (0)] |


