Copyright
©The Author(s) 2019.
World J Meta-Anal. May 31, 2019; 7(5): 234-248
Published online May 31, 2019. doi: 10.13105/wjma.v7.i5.234
Published online May 31, 2019. doi: 10.13105/wjma.v7.i5.234
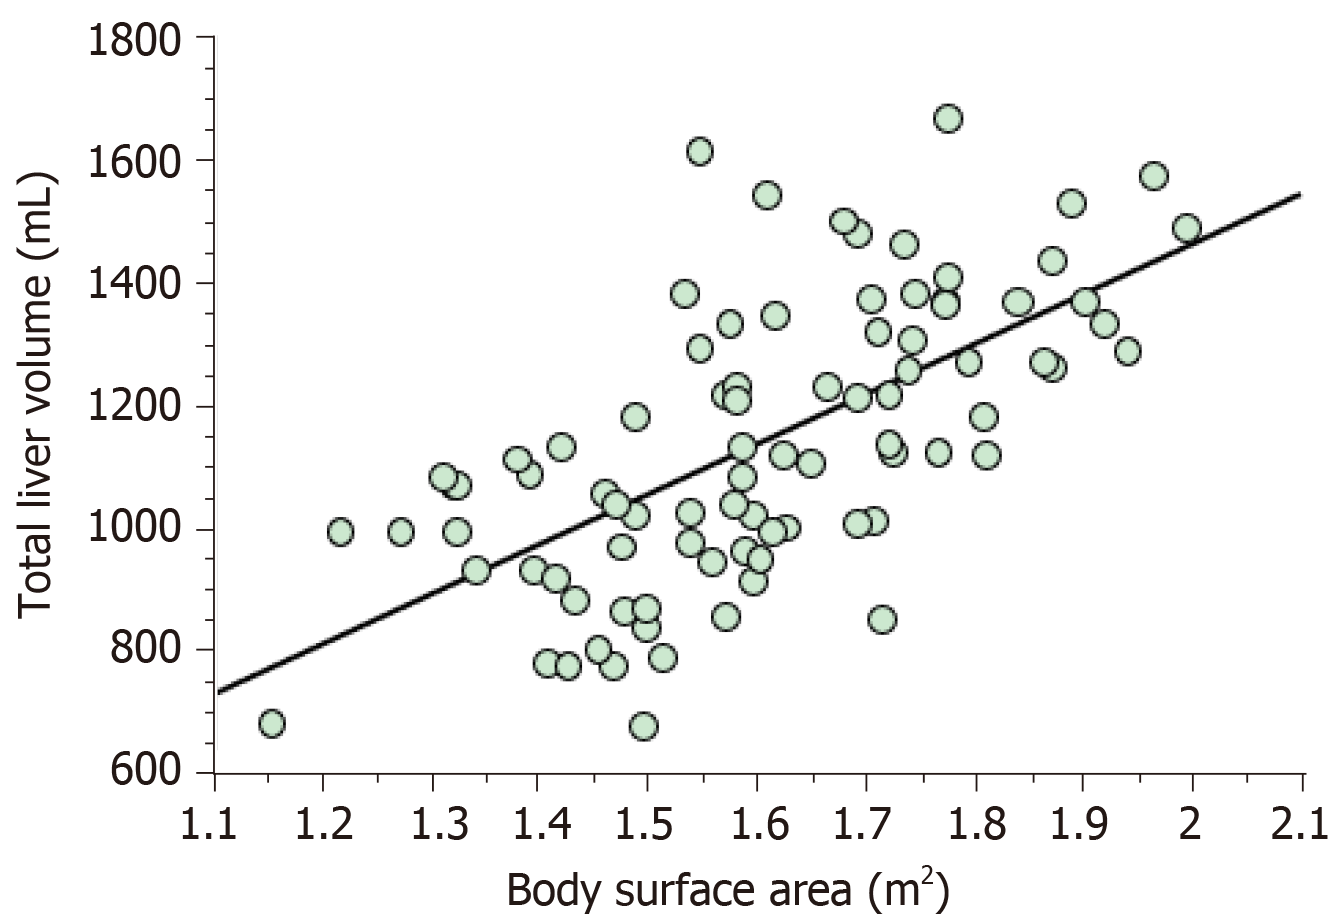
Figure 1 Linear regression analysis of total liver volume and body surface area.
Standard liver volume (mL) = 822.7 × BSA - 183.2; R2 = 0.419, R = 0.644; P < 0.001.
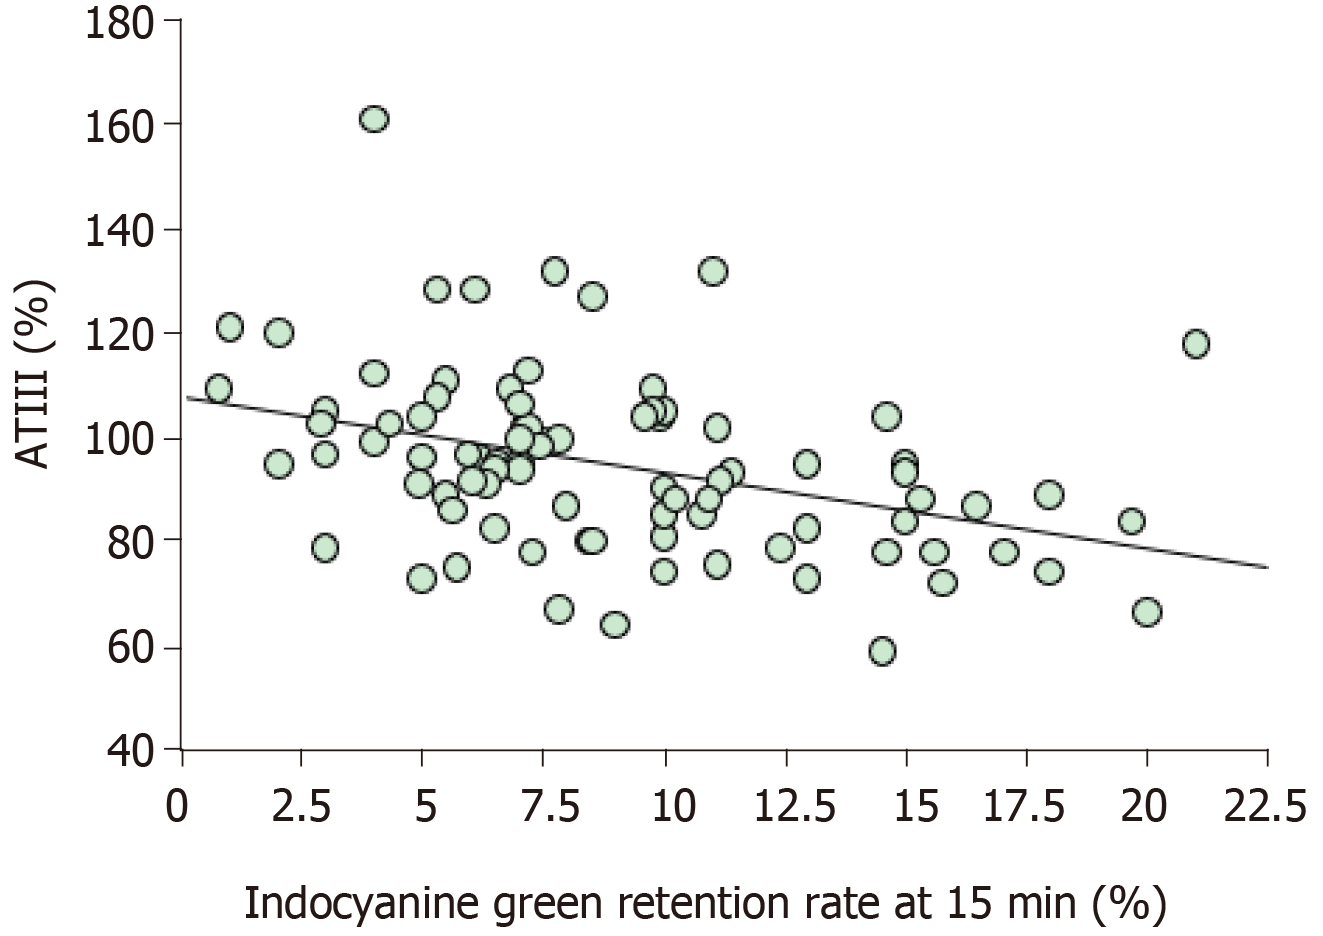
Figure 2 Linear regression analysis of serum antithrombin III levels and the indocyanine green retention rate at 15 min.
ATIII + 1.461 × ICGR15 = 108.068; R2 = 0.151, R = 0389: P < 0.001. ATIII: Antithrombin III; ICGR15: Indocyanine green retention rate at 15 min.
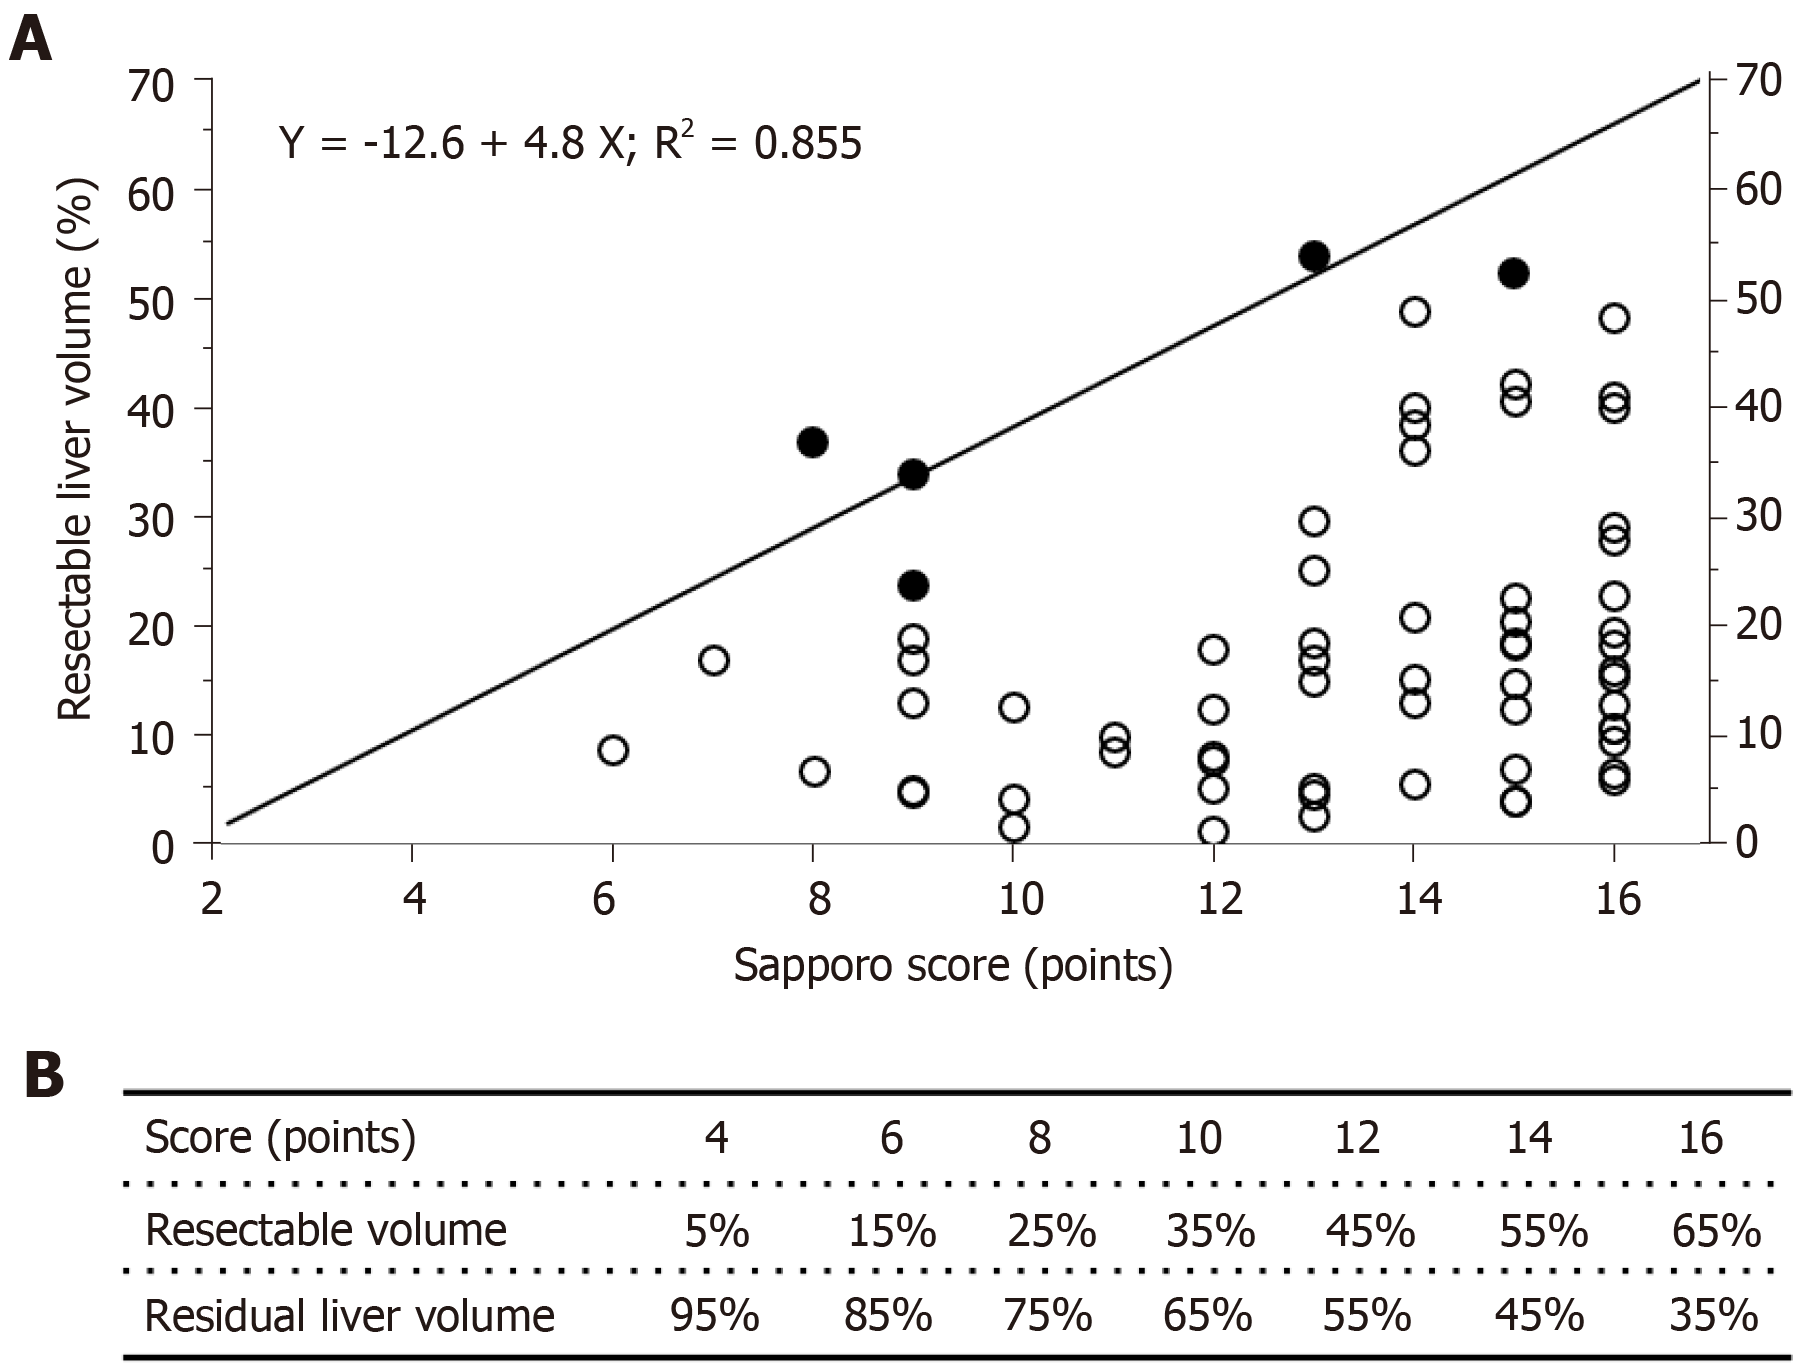
Figure 3 The results of the linear regression analysis of the reduction in liver volume and the Sapporo score.
A: Linear regression analysis of the reduction in liver volume and the Sapporo score; Closed circles: Grade IV and V postoperative liver failure/dysfunction Open circles: Complication-free cases; B: Relationships between the Sapporo score, resectable liver volume, and residual liver volume.
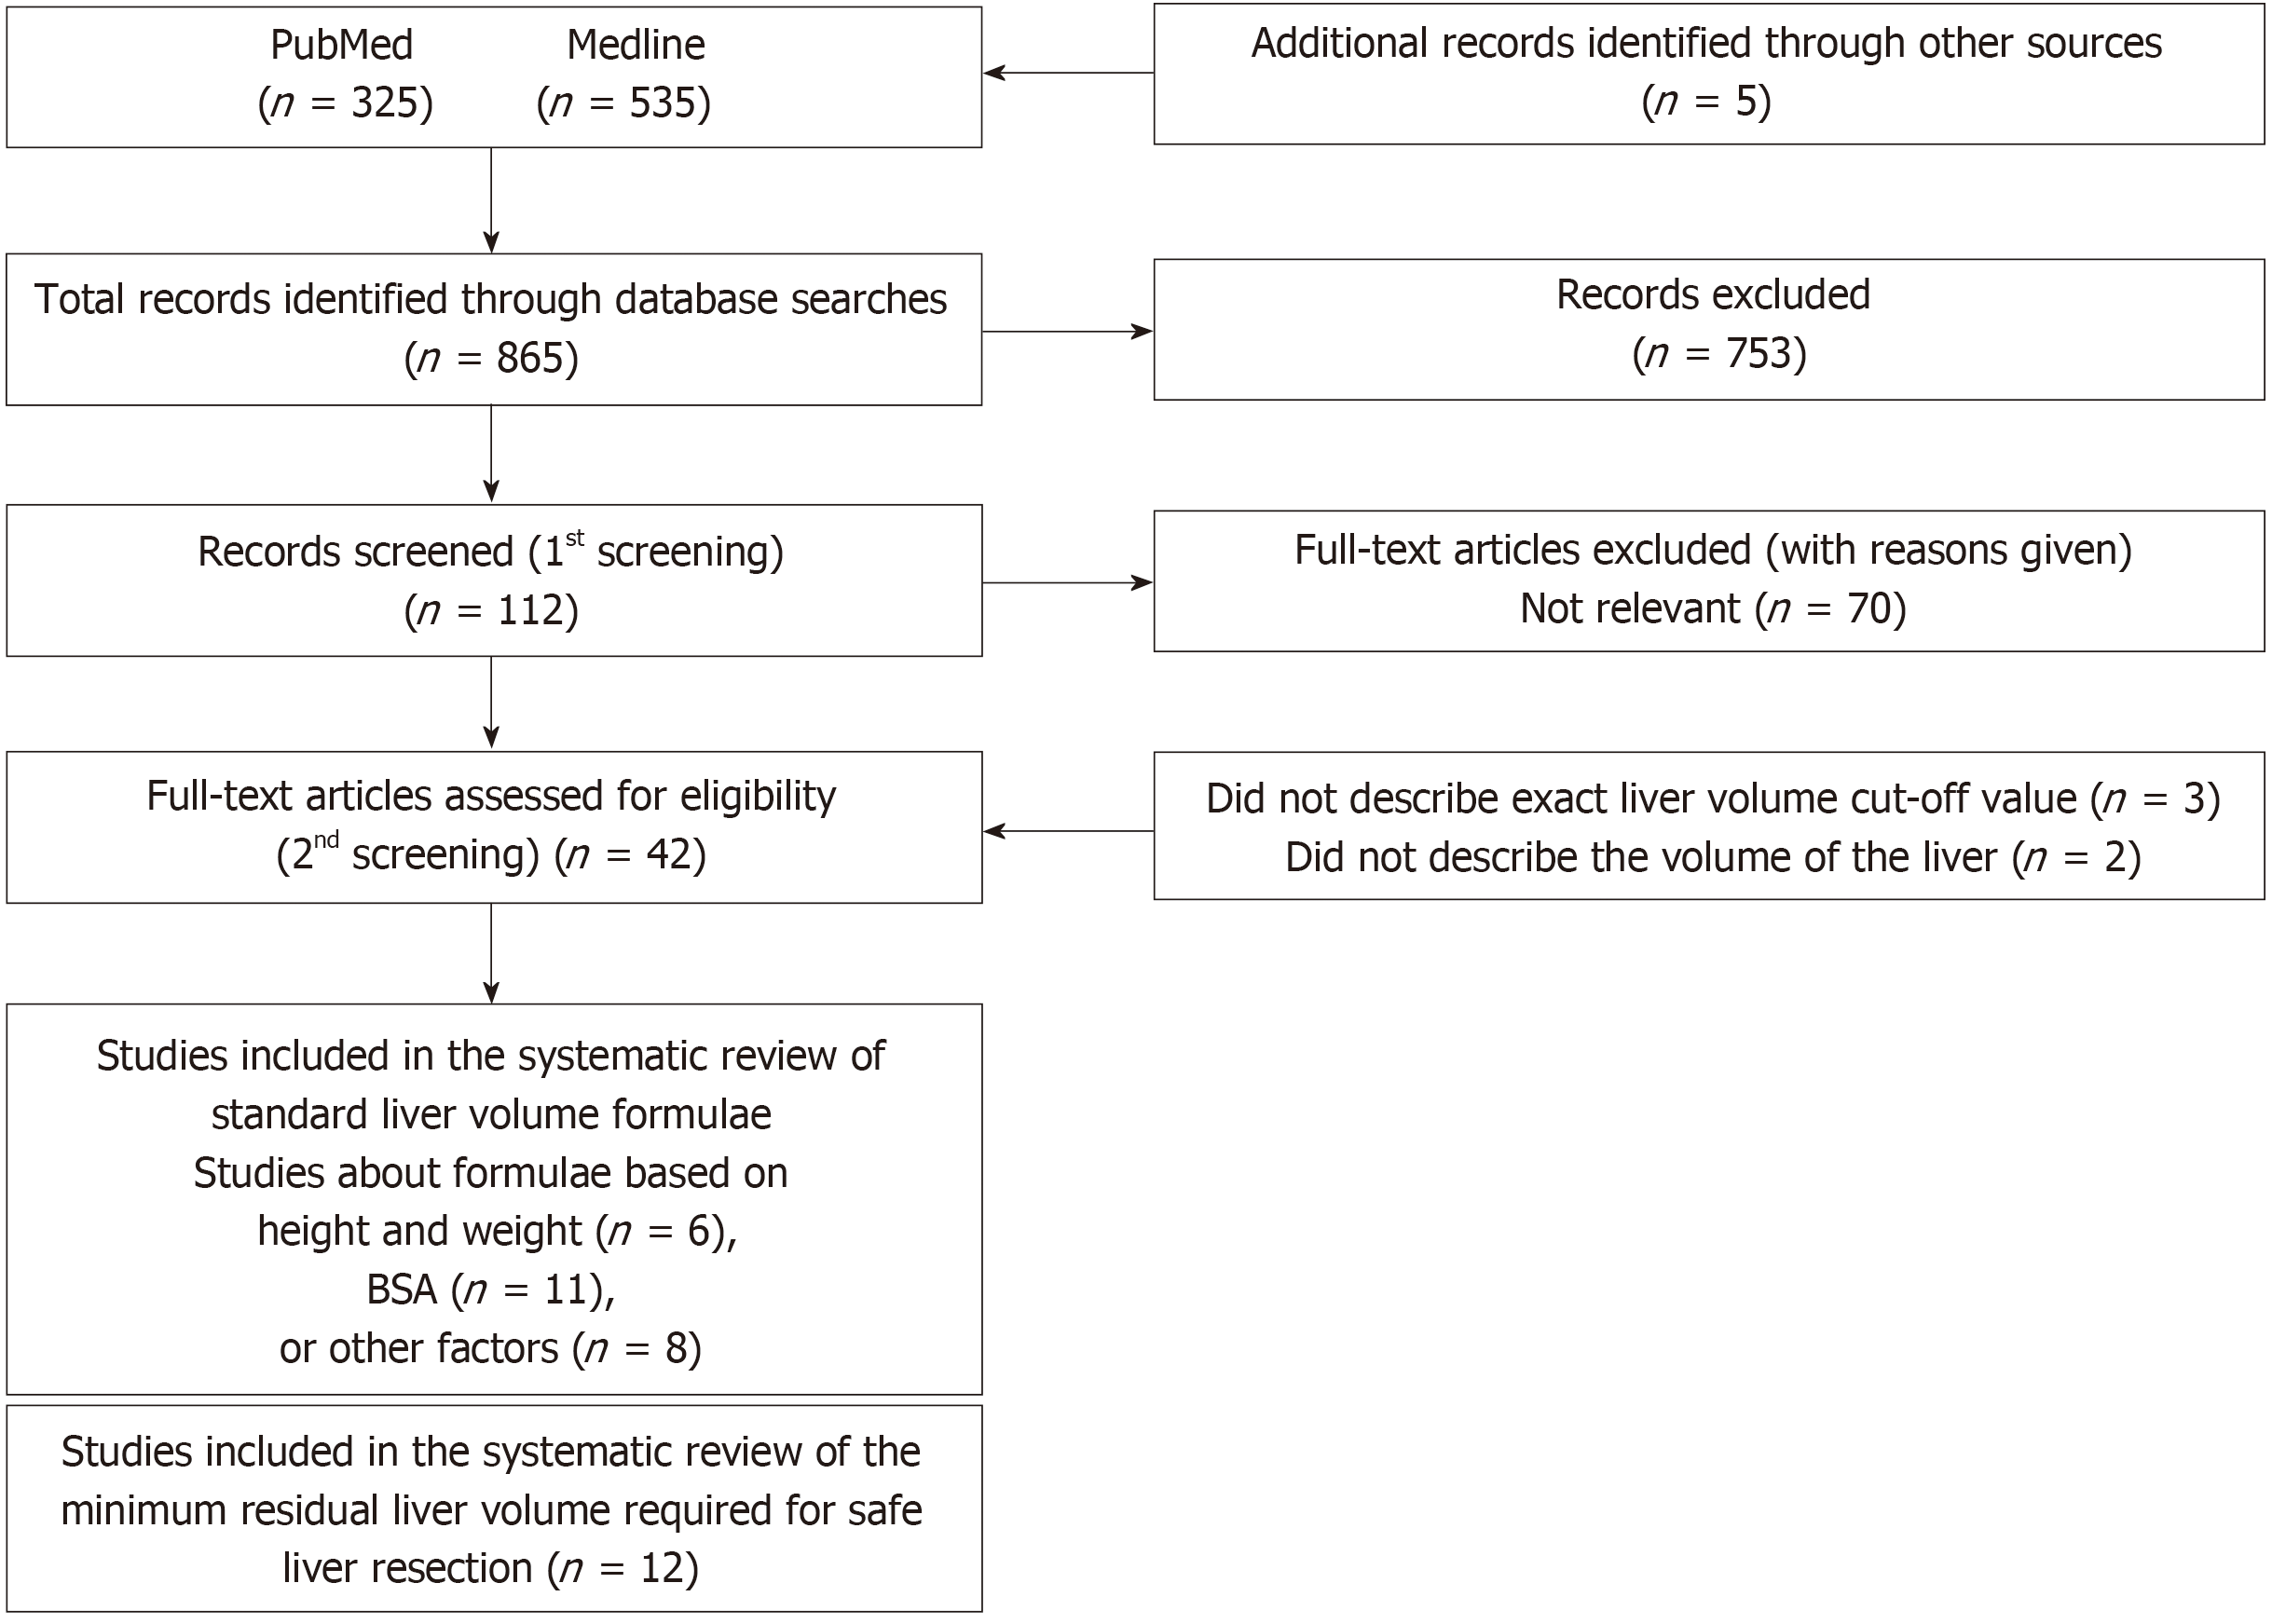
Figure 4 A PRISMA flow diagram.
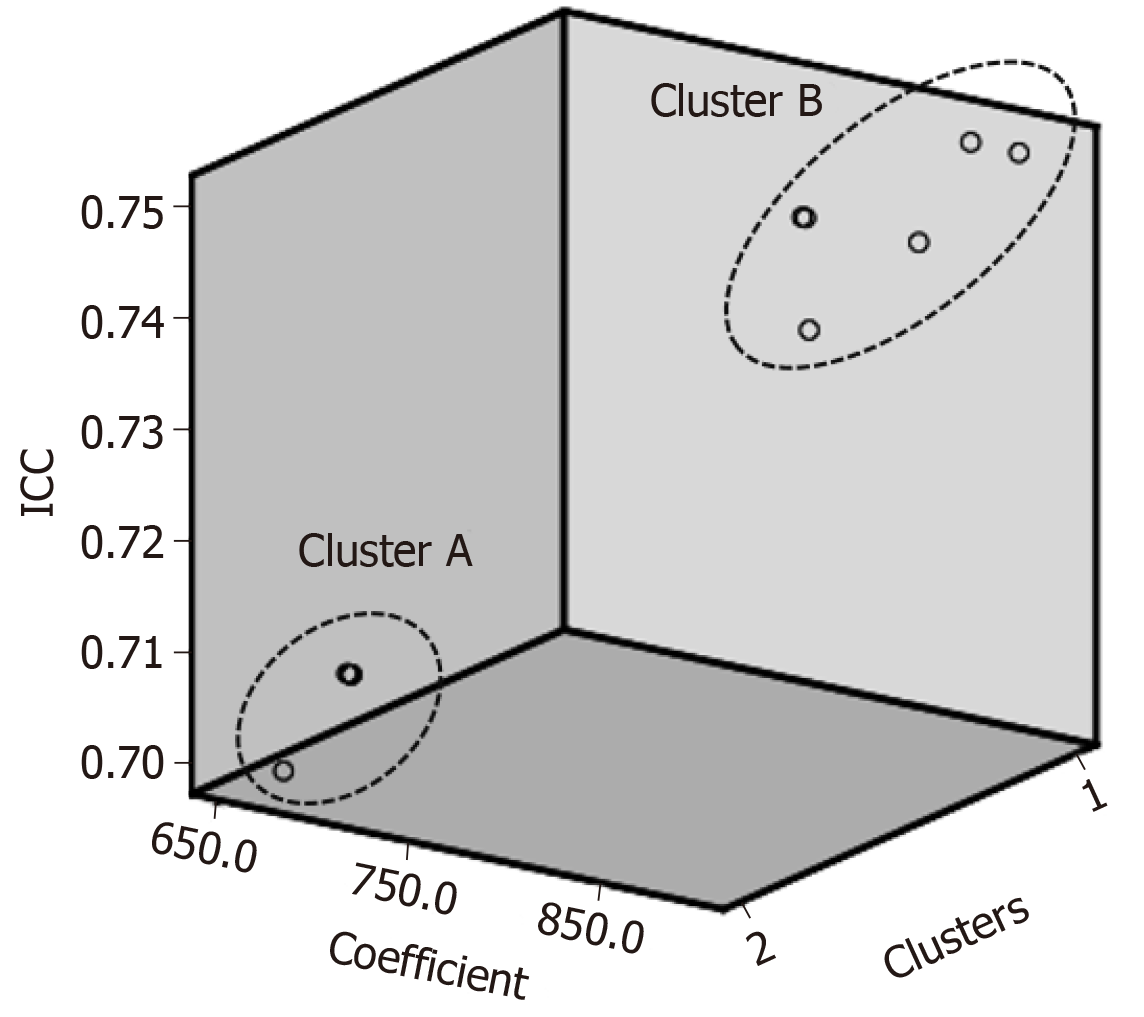
Figure 5 Three-dimensional scatterplot of simple standard liver volume formulae and their intraclass correlation coefficients.
ICC: Intraclass correlation coefficients.
- Citation: Harada K, Nagayama M, Ohashi Y, Chiba A, Numasawa K, Meguro M, Kimura Y, Yamaguchi H, Kobayashi M, Miyanishi K, Kato J, Mizuguchi T. Scoring criteria for determining the safety of liver resection for malignant liver tumors. World J Meta-Anal 2019; 7(5): 234-248
- URL: https://www.wjgnet.com/2308-3840/full/v7/i5/234.htm
- DOI: https://dx.doi.org/10.13105/wjma.v7.i5.234


