Copyright
©The Author(s) 2015.
World J Meta-Anal. Apr 26, 2015; 3(2): 125-132
Published online Apr 26, 2015. doi: 10.13105/wjma.v3.i2.125
Published online Apr 26, 2015. doi: 10.13105/wjma.v3.i2.125
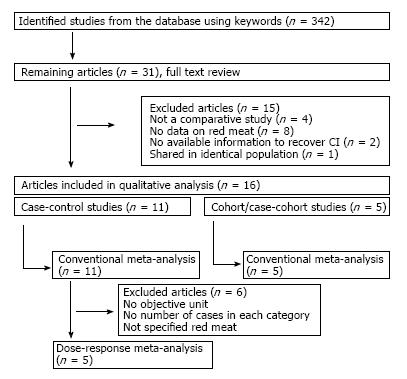
Figure 1 Flow diagram for identification of relevant studies.
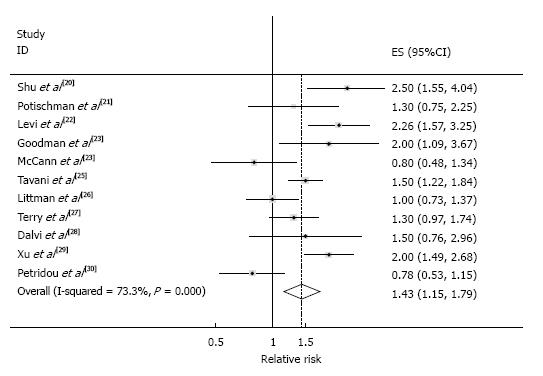
Figure 2 Random-effects meta-analysis of red meat intake and endometrial cancer risk in case-control studies, which shows I2 = 73.
3%, Pheterogeneity < 0.000.
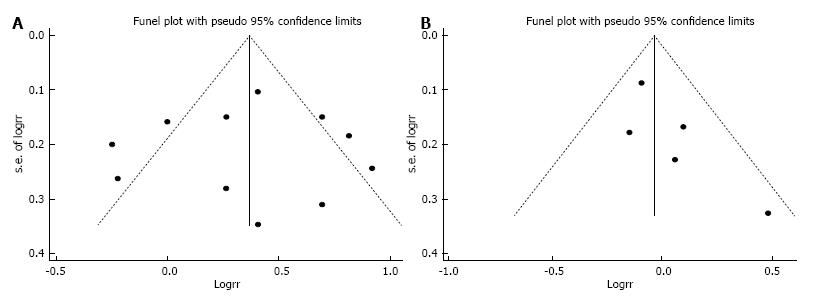
Figure 3 Funnel plot of eleven case-control studies (A) and five cohort studies (B) which were included in conventional meta-analysis.
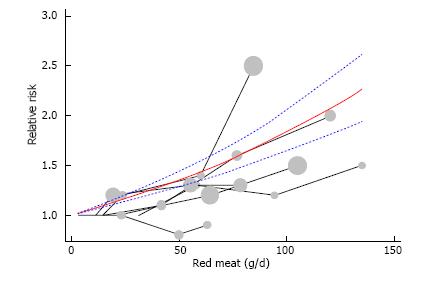
Figure 4 Dose-response spaghetti plot of red meat intake and endometrial cancer risk in case-control studies with pooled OR (solid line) and 95%CI (dotted lines).
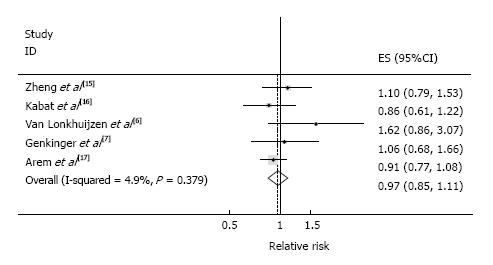
Figure 5 Random-effects meta-analysis of red meat intake and endometrial cancer risk in prospective studies.
- Citation: Ju W, Keum N, Lee DH, Kim YH, Kim SC, Ding EL, Cho E. Red meat intake and the risk of endometrial cancer: Meta-analysis of observational studies. World J Meta-Anal 2015; 3(2): 125-132
- URL: https://www.wjgnet.com/2308-3840/full/v3/i2/125.htm
- DOI: https://dx.doi.org/10.13105/wjma.v3.i2.125


