Published online Mar 26, 2016. doi: 10.5662/wjm.v6.i1.20
Peer-review started: September 1, 2015
First decision: December 7, 2015
Revised: January 28, 2016
Accepted: February 23, 2016
Article in press: February 24, 2016
Published online: March 26, 2016
Processing time: 203 Days and 9.1 Hours
Cation-exchange high-performance liquid chromatography (CE-HPLC) is a widely used laboratory test to detect variant hemoglobins as well as quantify hemoglobins F and A2 for the diagnosis of thalassemia syndromes. It’s versatility, speed, reproducibility and convenience have made CE-HPLC the method of choice to initially screen for hemoglobin disorders. Despite its popularity, several methodological aspects of the technology remain obscure to pathologists and this may have consequences in specific situations. This paper discusses the basic principles of the technique, the initial quality control steps and the interpretation of various controls and variables that are available on the instrument output. Subsequent sections are devoted to methodological considerations that arise during reporting of cases. For instance, common problems of misidentified peaks, totals crossing 100%, causes of total area being above or below acceptable limits and the importance of pre-integration region peaks are dealt with. Ultimately, CE-HPLC remains an investigation, the reporting of which combines in-depth knowledge of the biological basics with more than a working knowledge of the technological aspects of the technique.
Core tip: Interpretation of cation-exchange high-performance liquid chromatography requires in-depth knowledge of the biological basics of the disorders of hemoglobin with knowledge of the technological aspects of the technique. Pathologists may be unaware of the nuances of the technique, the rigorous quality control required and the approach to pitfalls that may be encountered. Here we list the most common of these, and based on literature and our experience, attempt to guide novices in this exciting and useful technology.
- Citation: Sharma P, Das R. Cation-exchange high-performance liquid chromatography for variant hemoglobins and HbF/A2: What must hematopathologists know about methodology? World J Methodol 2016; 6(1): 20-24
- URL: https://www.wjgnet.com/2222-0682/full/v6/i1/20.htm
- DOI: https://dx.doi.org/10.5662/wjm.v6.i1.20
Cation-exchange high-performance liquid chromatography (CE-HPLC) of a red blood cell lysate is now established as a rapid, accurate and reproducible diagnostic technique to separate various human hemoglobin fractions[1]. It is performed routinely in many laboratories, mostly on fully automated systems. Interpretation of HPLC chromatograms is a complex process requiring inputs from the clinical background of the case as well as complete blood count data[1,2]. Here, we briefly discuss a few technological aspects that influence results, and therefore are concern to reporting pathologists.
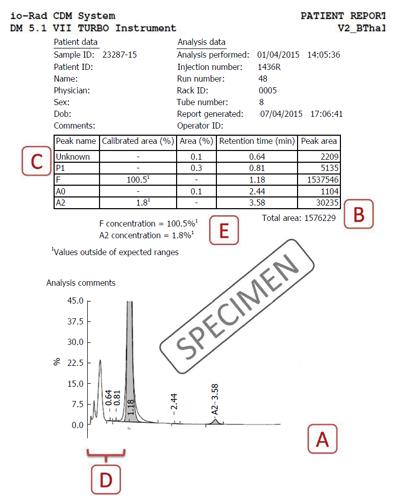
The basic principle of CE-HPLC involves passing the analyte of interest (a mixture of hemoglobins in solution) at a high pressure (approximately 100-200 kg/cm2) through a cylindrical column packed with small spherical particles (typically 5 μm diameter silica gel, called the stationary phase). Very small sample volumes (usually approximately 5 μL) are applied to the column. Different hemoglobins adsorb onto the silica packing with different intensities based on their ionic interactions. The column is then perfused by a buffer (mobile phase) that constantly varies in pH and ionic strength. Different hemoglobins elute out with the perfusing buffer at different but characteristic time points in response to the continually changing salt gradient[3]. Another variable that affects elution/retention times, the column temperature, is kept fixed throughout the approximately 5.0 to 6.0 min run (Figure 1A).
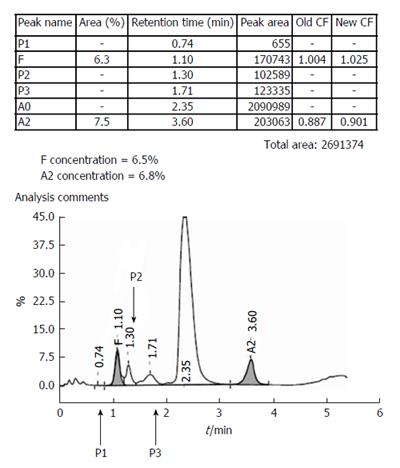
The eluted hemoglobin fractions are detected by a flow-cell type photometer that records changes in absorbance at 415 nm (hemoglobin) and 690 nm (background) on an integrating computer system. A chromatogram is generated displaying time on the X-axis and percentages on the Y-axis (Figure 1). The area under the absorption peak approximates the percentage of the fraction detected, and each fraction is assigned a window (i.e., range of retention times). The software controls for overlapping/merging peaks by dropping vertical axes at the troughs[3,4]. The report prepared incorporates numerical as well as graphical data, and their analysis is discussed next. We use the very widely applied Bio-Rad Variant II Turbo output (Bio-Rad Laboratories, Hercules, United States) using the β-Thal Short Programme for illustration (Figure 1), however, the principles remain similar even on other systems[5]. The interpretation of various chromatogram regions and peaks in various windows is summarized in Table 1. A specimen chromatogram with the peaks highlighted is shown in Figure 2.
| Region/window | Retention time | Interpretation |
| Pre-integration region | < 1 min | Bilirubin, Hb H, Hb Barts, modified HbF |
| P1 peak | 0.74 | A minuscule peak usually found in specimens with increased HbF |
| F window | 0.98-1.22 | HbF, Hb Okayama |
| P2 window | 1.28-1.50 | Glycated HbA |
| P3 window | 1.50-1.90 | Aged samples, HbJ-Meerut, modified HbE |
| A window | 1.90-3.10 | HbA, Glycated HbS, intact Hb Koln |
| A2 window | 3.30-3.90 | HbE, Hb D-Iran, Hb Lepore, Hb G-Koushatta, Hb Zurich, Hb Korle Bu |
| D window | 3.90-4.30 | Hb D-Punjab, Hb G-Philadelphia |
| S window | 4.30-4.70 | HbS, Hb Q-Thailand, Hb Manitoba |
| C window | 4.90-5.30 | HbC, Hb Constant Spring, Hb Agenogi |
| Further unknown peaks | > 5.30 | Hb Q-India |
All HPLC runs are preceded by priming and then calibration of instrument. Separate calibration factors are obtained for HbA2 and HbF as ratios of expected to obtained values. Since the two values should ideally be equal (i.e., a ratio of 1) these are deemed to have passed if they lie between 0.7 and 1.3. These calibration factors are then applied for all subsequent patient samples. The retention time of HbA2 in the calibrator is also a useful indicator of run reliability. Normally it lies between 2.60-2.70 min, and the instrument may need temperature adjustments if wider deviations occur. This is especially common as the column cartridge ages; usual cartridge lifetimes being around 250 injections. Bi-level controls, one normal (HbF 1%-2%, HbA2 1.8%-3.2%) and one elevated (HbF 5%-10%, HbA2 4%-6%), should be analyzed at the beginning as well as the end of each set of patient specimens. The high control in case of Bio-Rad instruments also contains a variant peak that must elute in the S-window. All peaks must be symmetrical, temperature variations being the most common cause again of asymmetry[3,6].
Once the preliminary checks have passed, reporting of patient samples can proceed. During reporting, attention must be directed to the following areas.
This must lie between 1 to 3 million μVolt-seconds (Figure 1B). Specimens with lower areas (due to anemia) or increased values (due to polycythemia) must be reanalysed after appropriate manual concentration by removing plasma or dilution by removing red cells respectively[6].
The total area is the sum of all individual peaks’ areas and can therefore, in the presence of overlapping peaks, can cross 100%. This is especially common in patients with beta-thalassemia major, where the HbF peak overlaps and usually obliterates P2 and P3. In such situations, the percentages can be calculated manually, by taking the area of the peak of interest, and dividing it by total area to get the proportion. For example, in Figure 2, the HbF%, instead of the implausible 100.5% can be calculated as F-peak area × 100 ÷ total area (i.e., 1537546 × 100 ÷ 1576229 = 97.5%).
One or more unknown peaks often occur around the P2/P3 window (retention times 1.3-1.8; Figure 1C). These may be safely ignored if ≤ 1% of total area[6]. Unknown peaks at longer retention times and those > 1% should be paid greater attention as transfusion-transmitted peaks, HbA2’ may present as small peaks[7]. One may also review the sample run previously as carryover peaks are also usually small.
In rare cases with very large abnormal peaks, the entire fraction may be misassigned to either another category, or as an unknown peak. This was commoner in older generation analyzers (like the Variant), but can still occur with broad-based HbD and HbF peaks (Figure 2). Alternative techniques are then required to establish the identity of the unknown peak.
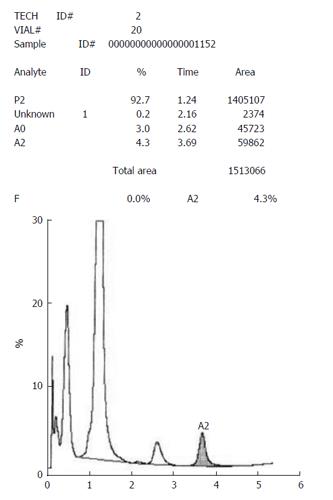
These peaks, with retention time < 1 min, are not reflected in the tabular data and need to be looked for on the chromatogram (Figure 1D). The causes of such peaks include HbH, Hb Barts, bilirubin and acetylated HbF (Figure 3). The clinical background and other HPLC findings usually indicate their nature, if found. In addition, bilirubin peaks are usually early, very sharp and thin. HbH peaks are usually dual and of low to moderate height, while post-translationally modified F are usually multiple with their height proportionate to the HbF%[1,3,4]. If required, the software settings may be readjusted manually to include such peaks. This may be especially useful in cases with HbH disease.
These represent post-translationally modified adult hemoglobin (HbA0) and show normal ranges of 3.8 ± 0.7 and 4.3 ± 0.4 respectively (unpublished data). P2 is comprised of glycated hemoglobin and levels ≥ 6.5% should be mentioned in the report with the suggestion to exclude diabetes mellitus. Low P2 levels are seen in cases with reticulocytosis. Elevated P3 may indicate HbJ-Meerut (an α-globin chain variant). It is also elevated in cases with the HbE variant (that elutes in the HbA2 window) and in aged specimens[1,3,4]. Incidentally, the P1-peak is virtually always absent in normal specimens.
In conclusion, although CE-HPLC is a rapid, convenient and reliable investigation for hemoglobin disorders, it involves several methodological issues and nuances. Reporting pathologists must be aware of these to extract maximum information from this technology.
P- Reviewer: Harn GL, Yao D S- Editor: Ji FF L- Editor: A E- Editor: Liu SQ
| 1. | Wajcman H, Moradkhani K. Abnormal haemoglobins: detection & characterization. Indian J Med Res. 2011;134:538-546. [PubMed] |
| 2. | Rangan A, Sharma P, Dadu T, Saxena R, Verma IC, Bhargava M. β-Thalassemia mutations in subjects with borderline HbA2 values: a pilot study in North India. Clin Chem Lab Med. 2011;49:2069-2072. [RCA] [PubMed] [DOI] [Full Text] [Cited by in Crossref: 17] [Cited by in RCA: 18] [Article Influence: 1.3] [Reference Citation Analysis (0)] |
| 3. | Chapter 2: Laboratory techniques for the identification of abnormalities of globin chain synthesis. In: Haemoglobinopathy Diagnosis. Bain BJ, editor. 2nd ed. Blackwell Publishing: Oxford 2006; 26-62. [DOI] [Full Text] |
| 4. | Chapter 3: Haemoglobin pattern analysis (3.1. Chromatographic methods for HbA2 determination). In: Prevention of Thalassaemias and Other Haemoglobin Disorders (Volume 2: Laboratory Protocols). By Old J, Harteveld CL, Traeger-Synodinos J (eds). 2nd ed. Nicosia, Cyprus: Thalassaemia International Federation 2012; Available from: http://www.ncbi.nlm.nih.gov/books/NBK190579/. |
| 5. | Van Delft P, Lenters E, Bakker-Verweij M, de Korte M, Baylan U, Harteveld CL, Giordano PC. Evaluating five dedicated automatic devices for haemoglobinopathy diagnostics in multi-ethnic populations. Int J Lab Hematol. 2009;31:484-495. [RCA] [PubMed] [DOI] [Full Text] [Cited by in Crossref: 94] [Cited by in RCA: 106] [Article Influence: 6.6] [Reference Citation Analysis (0)] |
| 6. | Instruction Manual: Variant™ II β-thalassemia Short Program Reorder Pack. Ref: 270-2103 and 270-2154 (Release Notes CD-R Version BV231100-A). USA: Bio-Rad Laboratories Inc. Hercules, CA 2015; 10-15. |
| 7. | Gupta SK, Sharma M, Tyagi S, Pati HP. Transfusion-induced hemoglobinopathy in patients of beta-thalassemia major. Indian J Pathol Microbiol. 2011;54:609-611. [RCA] [PubMed] [DOI] [Full Text] [Cited by in Crossref: 3] [Cited by in RCA: 4] [Article Influence: 0.3] [Reference Citation Analysis (0)] |


