Copyright
©The Author(s) 2019.
World J Methodol. Nov 14, 2019; 9(3): 32-43
Published online Nov 14, 2019. doi: 10.5662/wjm.v9.i3.32
Published online Nov 14, 2019. doi: 10.5662/wjm.v9.i3.32
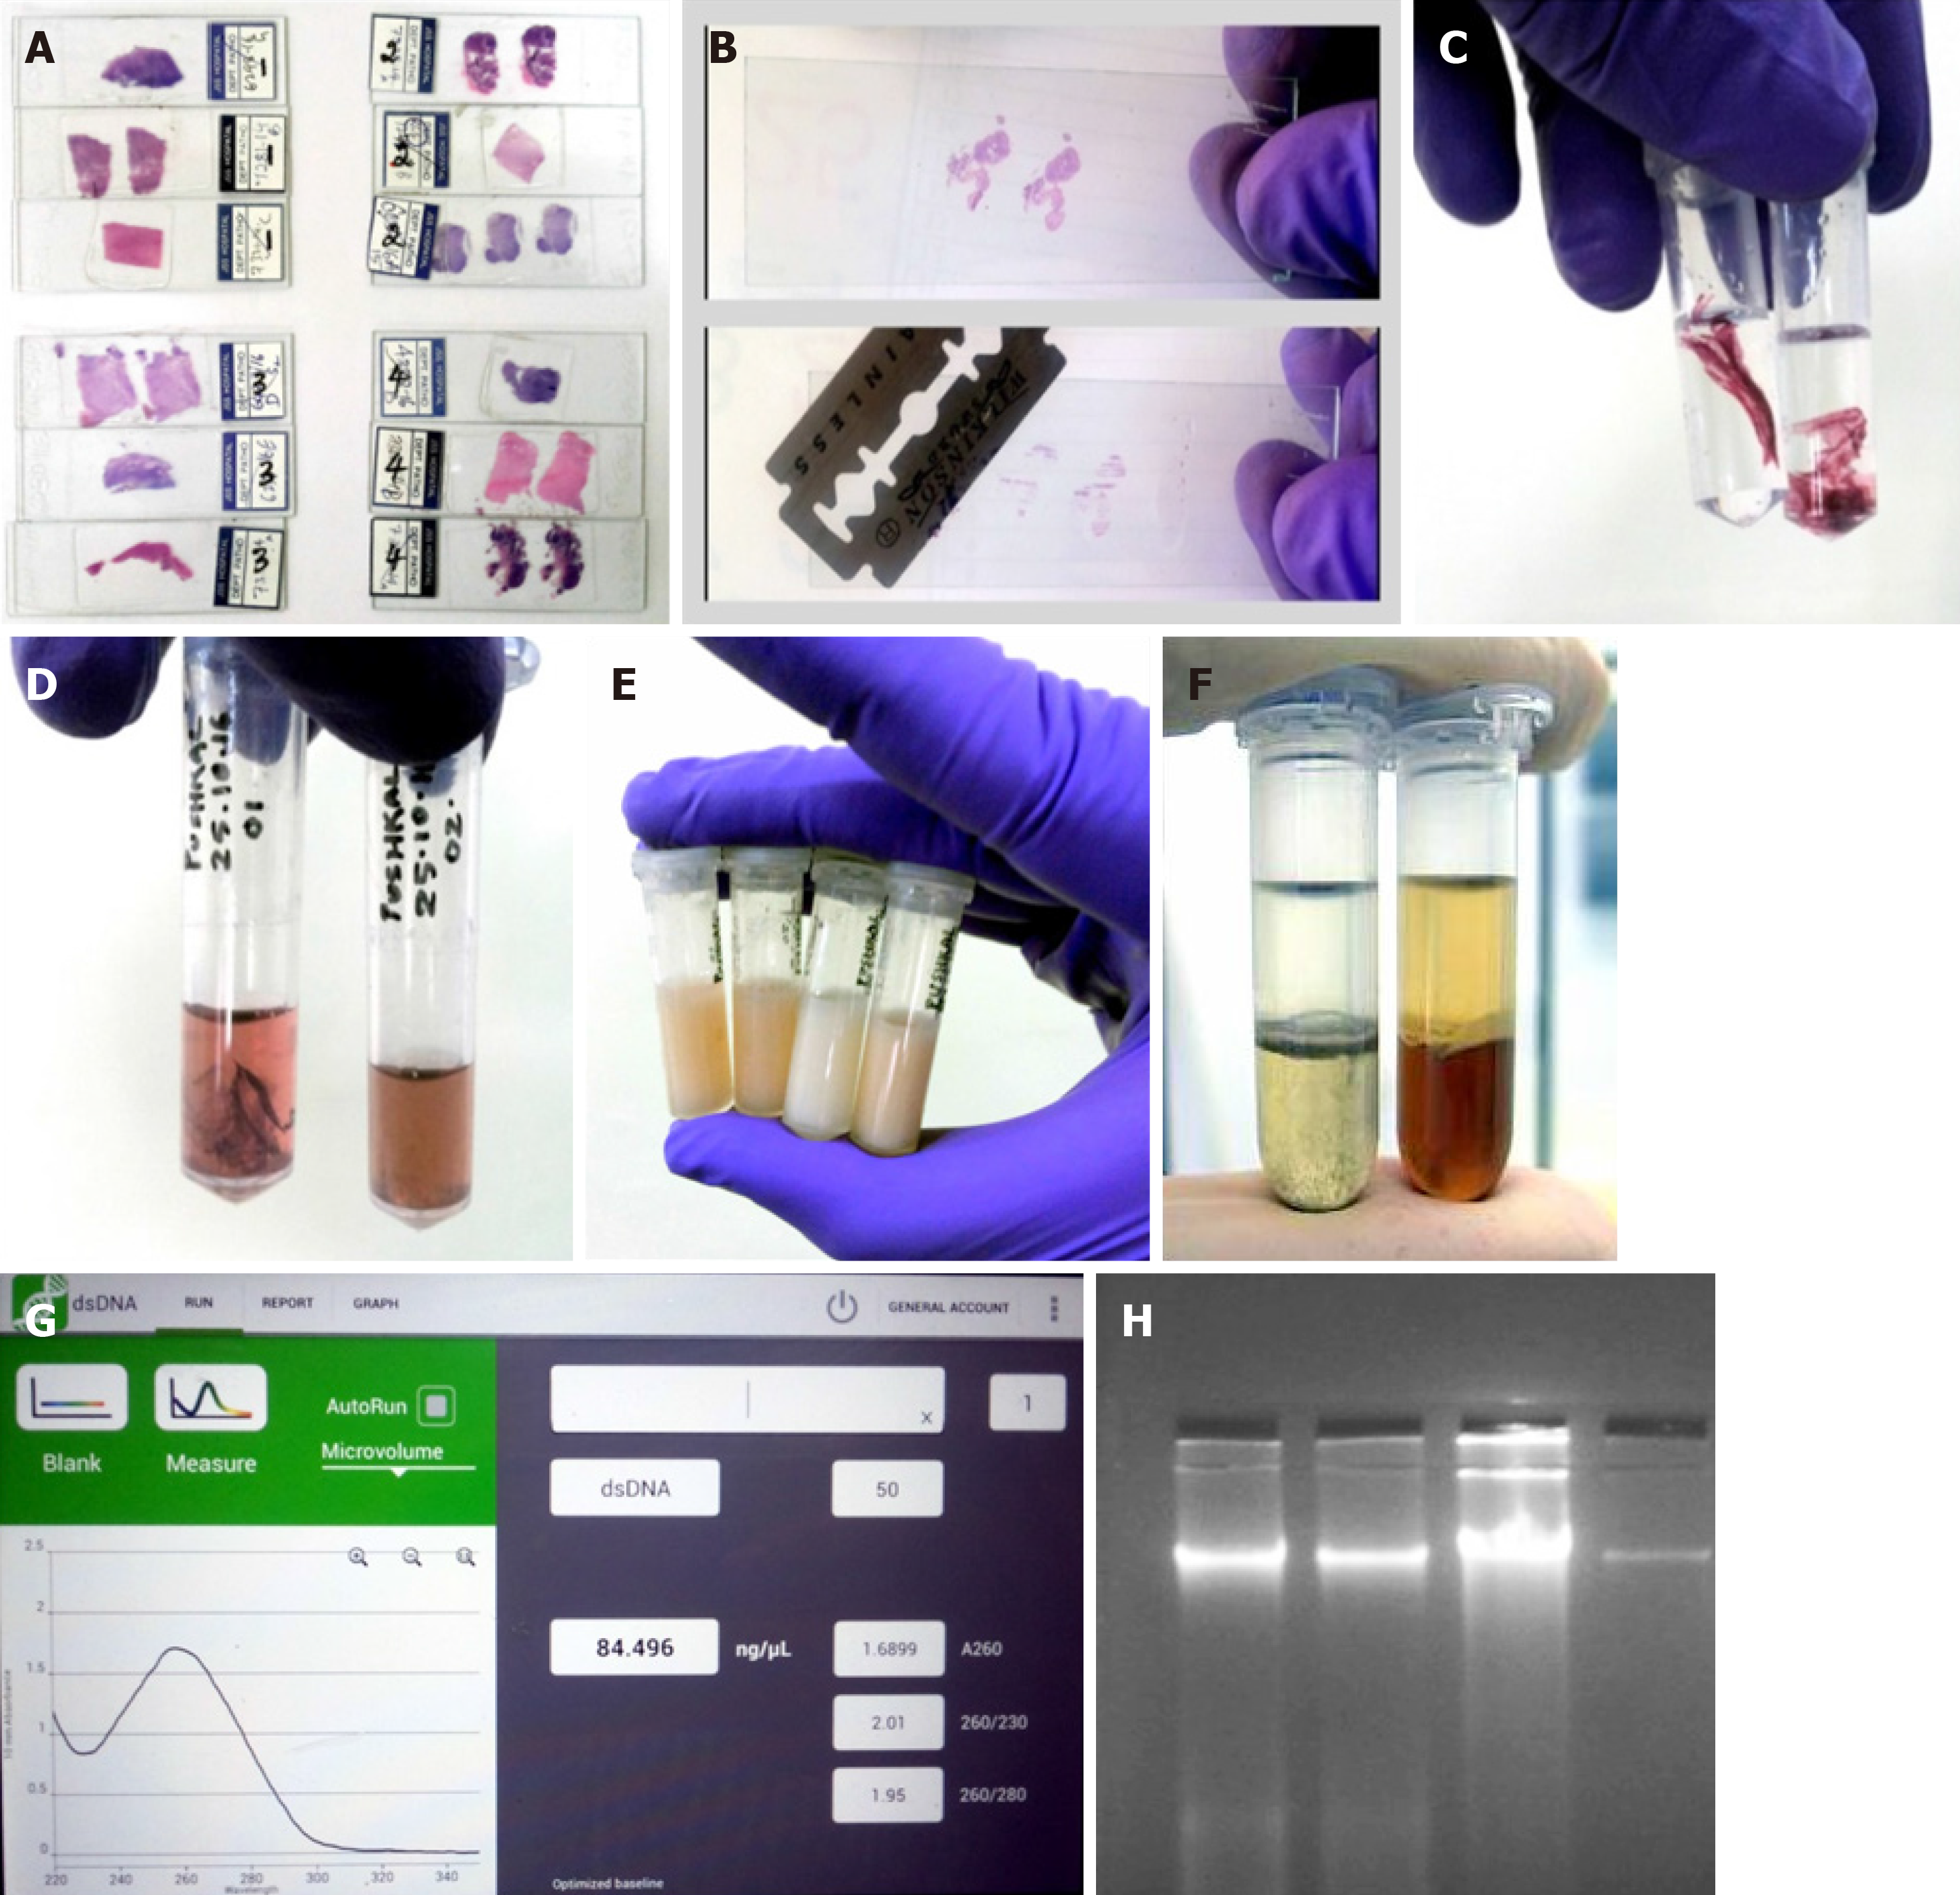
Figure 1 Workflow for extraction of DNA from archived H&E-stained cancer tissue slides.
A: Slides selected for the extraction of DNA; B: Coverslip removal and scraping of the tissues; C: Xylene treatment for deparaffinization; D: Ethanol rehydration and stain removal; E: Tissue digestion; F: Nucleic acid purification by phase separation followed by DNA precipitation; G: Quantification of DNA using Nanodrop; H: Assessment of quality of the extracted DNA.
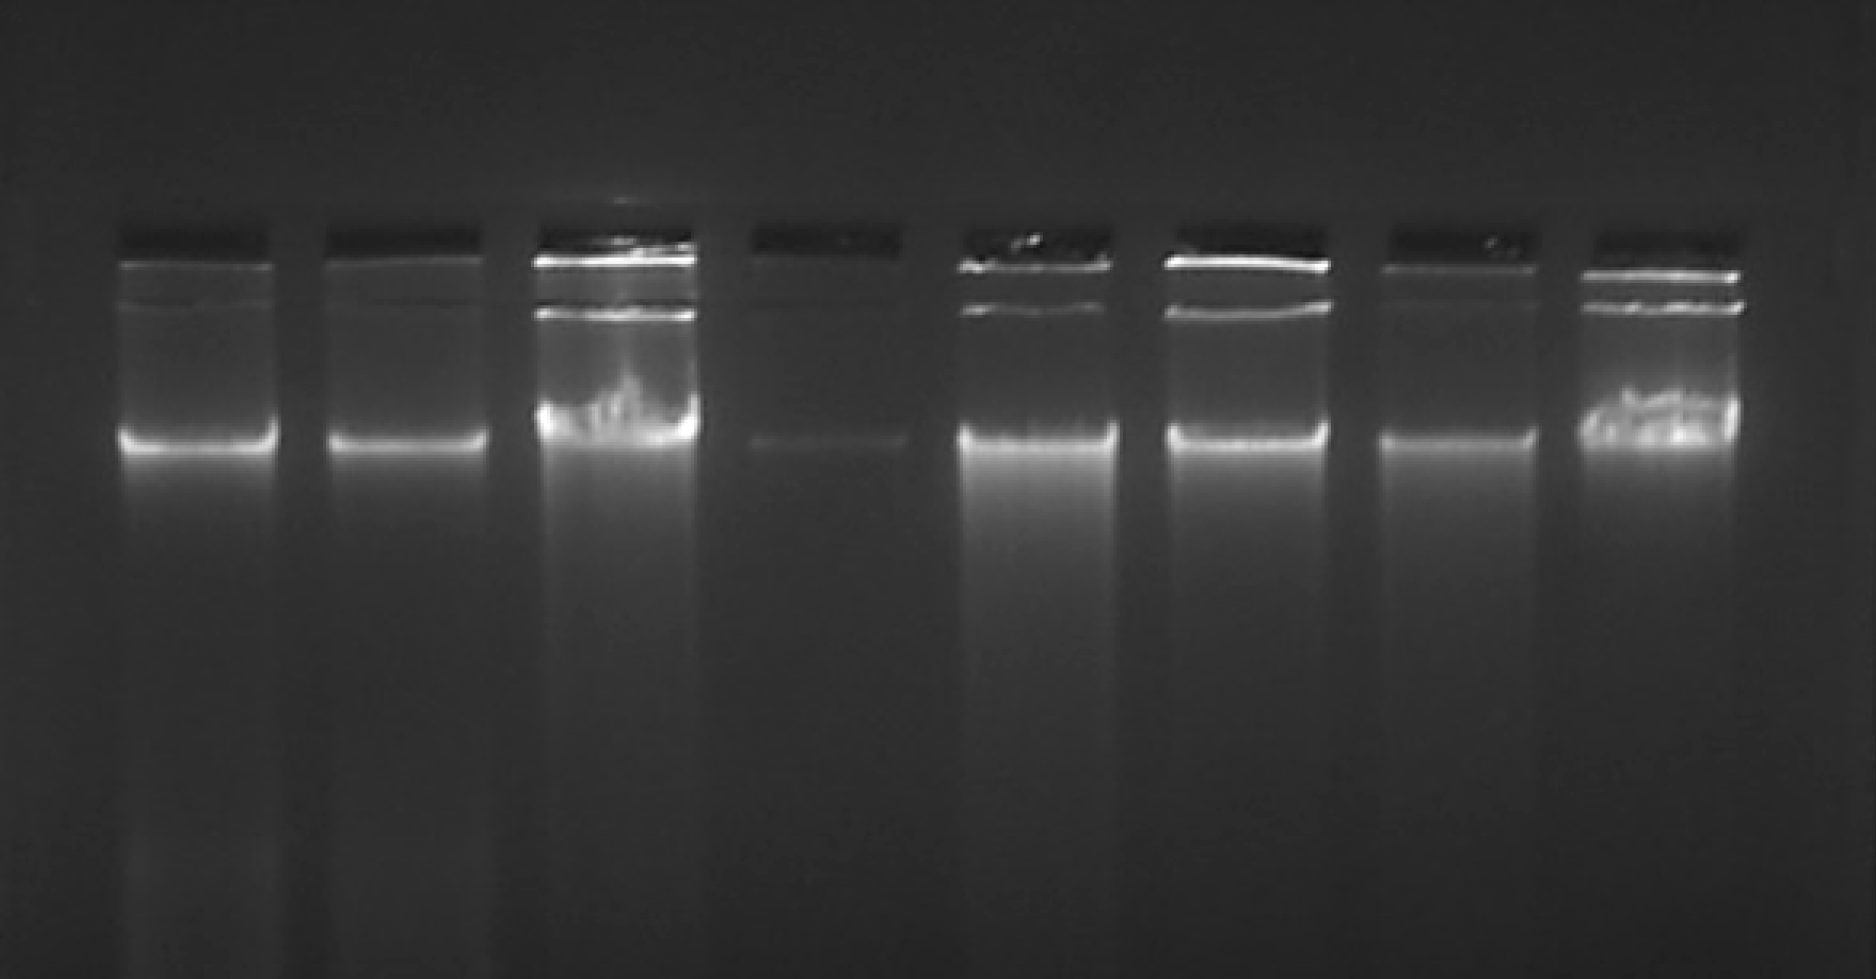
Figure 2 Representative image of DNA extracted from H&E-stained slides on a 1% agarose gel stained with ethidium bromide.
The DNA extracted from archived H&E-stained slides were assessed for its quality by agarose gel electrophoresis. Only intact DNA as seen in the figure was considered fit for further analysis. H&E: Hematoxylin and eosin.
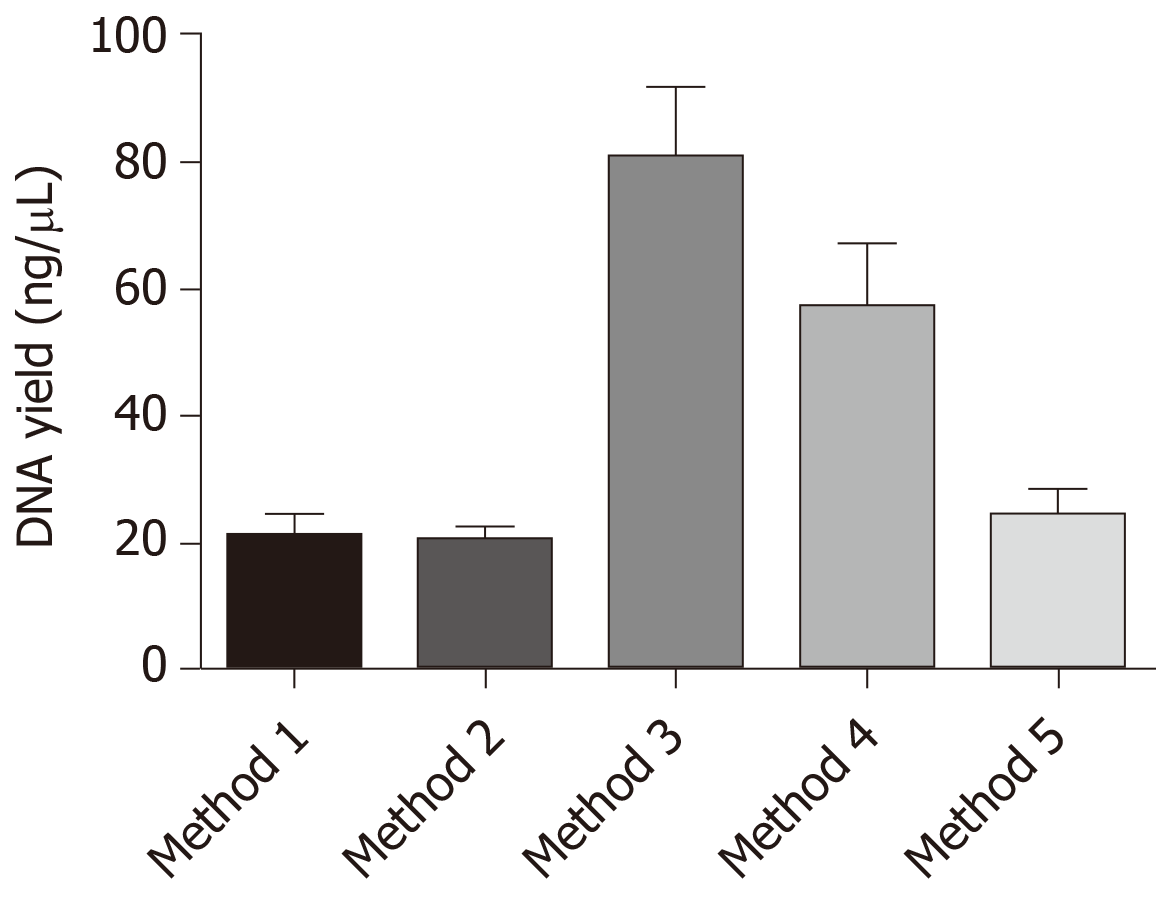
Figure 3 Graph showing DNA yield (ng/µL) from different DNA extraction methods.
Data represented as mean ± standard error of the mean. It is clearly visible from the graph that method 3 wherein xylene was used for deparaffinization with 72 h of lysis duration showed the maximum yield of DNA. Similarly, method 4 with proteinase K inactivation also showed better DNA yield.
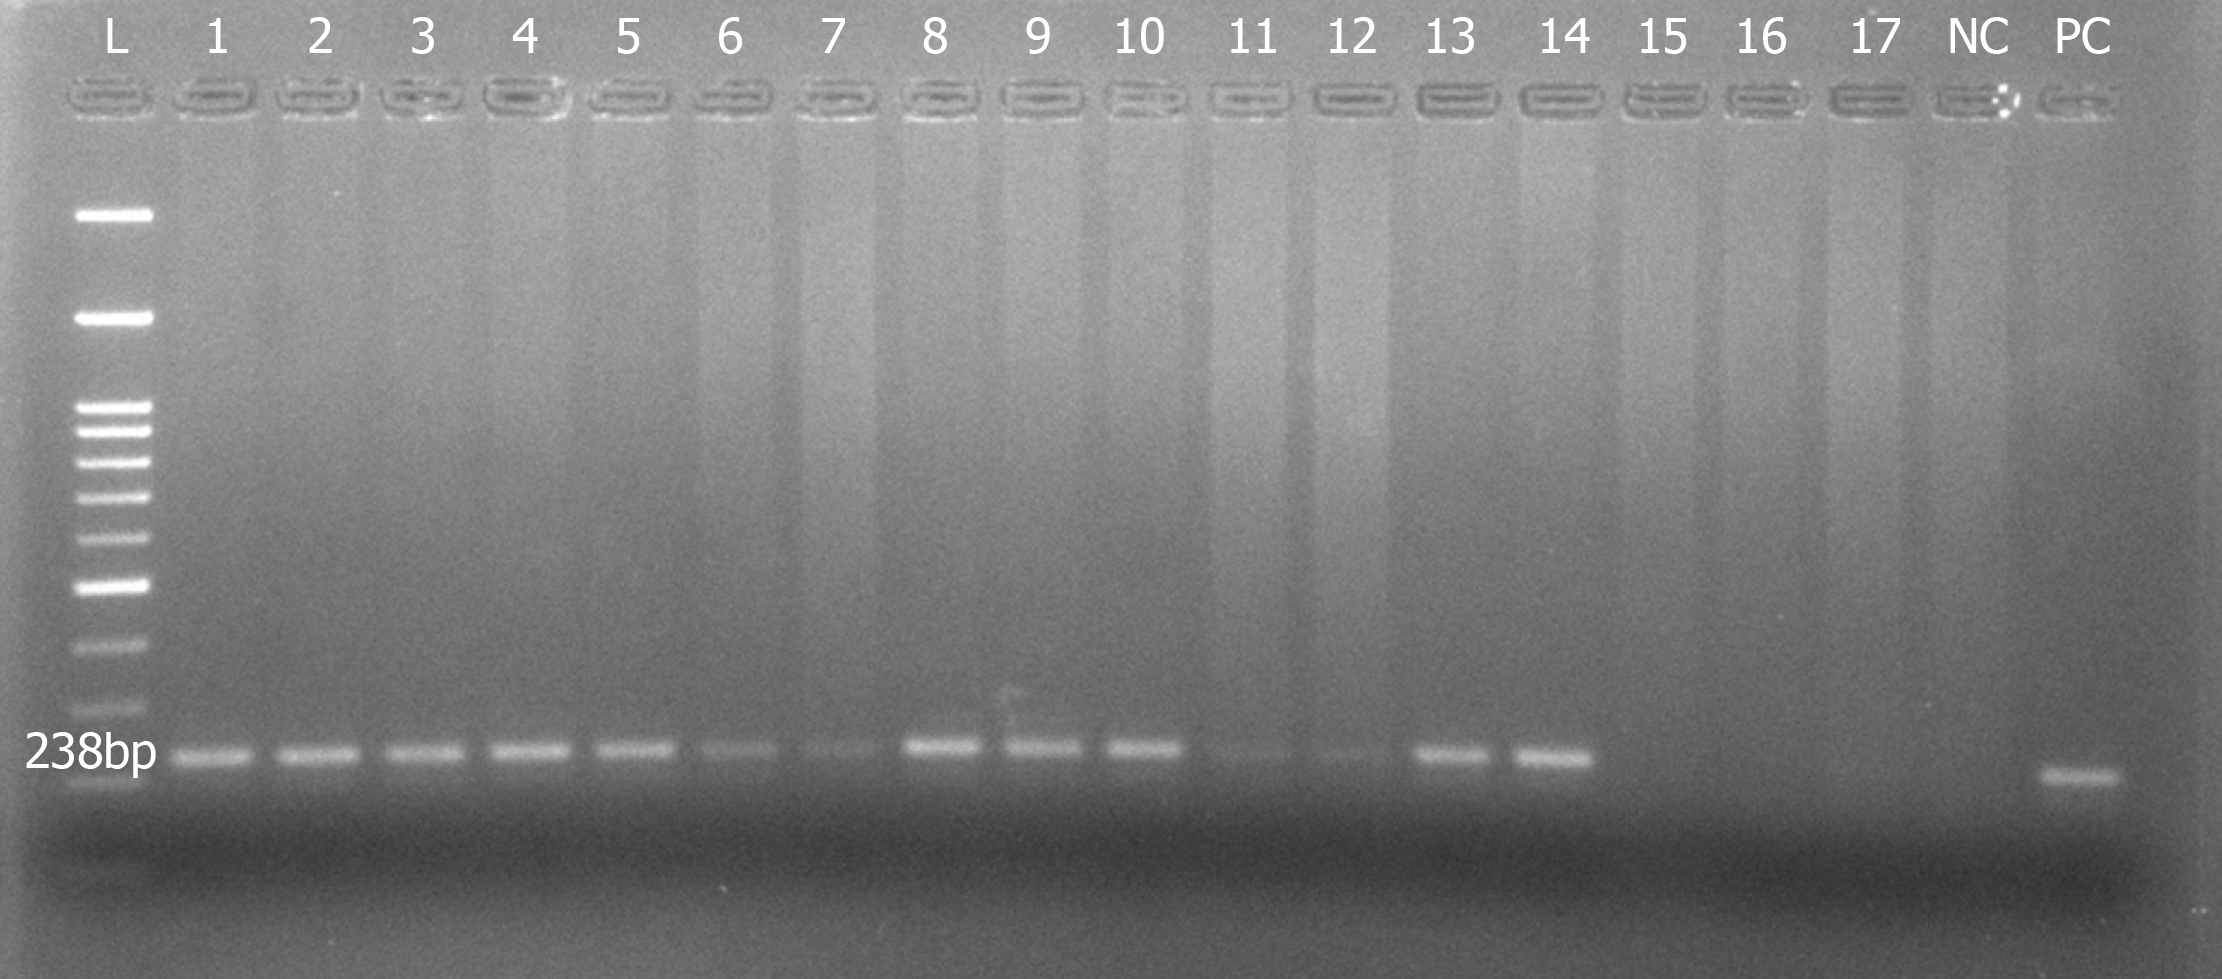
Figure 4 Representative image of 2% agarose gel showing amplified 238 bp product of the housekeeping GAPDH gene.
Samples 1-5, 8-10, and 13-14 showed clear amplification bands, while samples 6-7 and 11-12 showed mild amplification. In contrast, samples 15-17 showed no amplification at all. L: 100 bp DNA ladder; PC: Positive control; NC: Negative control.
- Citation: Ramesh PS, Madegowda V, Kumar S, Narasimha S, S R P, Manoli NN, Devegowda D. DNA extraction from archived hematoxylin and eosin-stained tissue slides for downstream molecular analysis. World J Methodol 2019; 9(3): 32-43
- URL: https://www.wjgnet.com/2222-0682/full/v9/i3/32.htm
- DOI: https://dx.doi.org/10.5662/wjm.v9.i3.32


