Copyright
©The Author(s) 2017.
World J Methodol. Dec 26, 2017; 7(4): 139-147
Published online Dec 26, 2017. doi: 10.5662/wjm.v7.i4.139
Published online Dec 26, 2017. doi: 10.5662/wjm.v7.i4.139
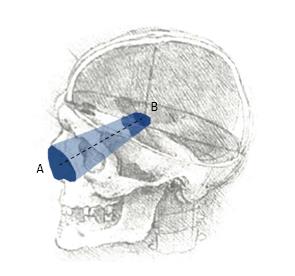
Figure 1 Schematic description of a surgical approach, as a “truncated pyramid”[4,5]: (1) Superficial surface (A), more commonly defined “surgical window” or “access area”; it represents the area through which instruments are introduced to work at the level of the deep area; (2) deep surface (B), usually defined “area of exposure”, as it is the surface exposed by the approach; and (3) height of the truncated pyramid (dotted line).
Volume and trajectory of this pyramid complete the essential anatomical definition of a neurosurgical approach. Background head image is from: Studies of human skull, Leonardo Da Vinci, supplied by Royal Collection Trust ©Her Majesty Queen Elizabeth II 2016.
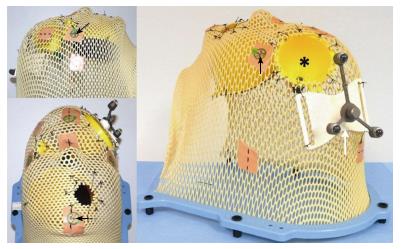
Figure 2 A phantom was used to evaluate the accuracy of the methods used to quantify the surgical pyramid.
Three funnels were positioned inside a radiotherapy mesh plastic mask to simulate a total of five different surgical approaches: Small funnel, simulating a narrow and short approach; medium funnel (asterisk), simulating two different approaches, with the same superficial area and different deep areas, at distinctive distances from the surface; large funnel, simulating two approaches, with the same superficial area and different deep areas, at the same distance. Round, one-millimeter metallic markers were positioned over the mask as reference points for neuronavigation registration (black arrow). A reference frame (white arrow) was attached to allow the use of navigation systems (see text for further details).
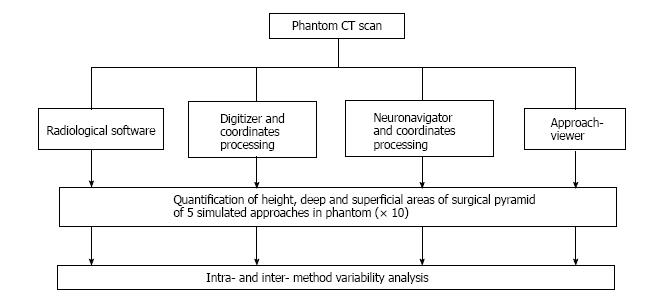
Figure 3 Study design.
Each simulated approach was quantified 10 times with each of the research methods (see text for further details). CT: Computed tomography.
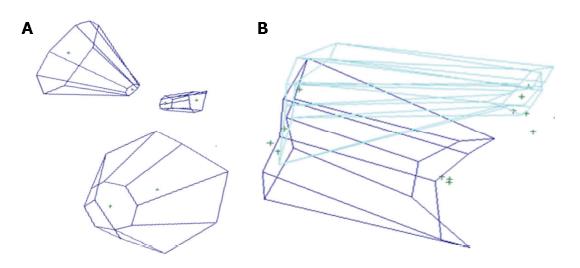
Figure 4 Volume rendering with Maya®.
A: Visual rendering of three different funnels with the quantification method based on the commercially-available digitizer or navigation system and 3-D rendering software (Maya®); B: 3D rendering with the Storz navigation system for coordinate collection and Maya® software for 3D rendering of endonasal (light blue) and transoral (dark blue) approaches to the anterior craniovertebral junction.
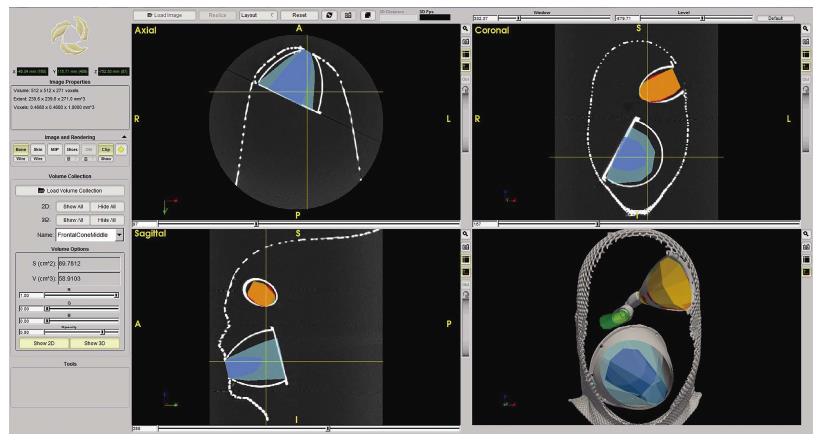
Figure 5 Rendering of the three funnels with ApproachViewer, which shows the five different approaches (in different colors) in the three axes and in 3D.
The quantified volume of one of the simulated approaches is shown on the screen (see online additional material - ApproachViewer guide 1.0)
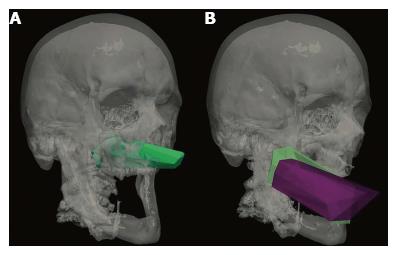
Figure 6 Visual rendering of anterior approaches to the odontoid with ApproachViewer.
A: Endonasal endoscopic approach to the anterior craniovertebral junction (CVJ); B: Transoral without (purple) and after soft palate split (green) approaches to the CVJ.
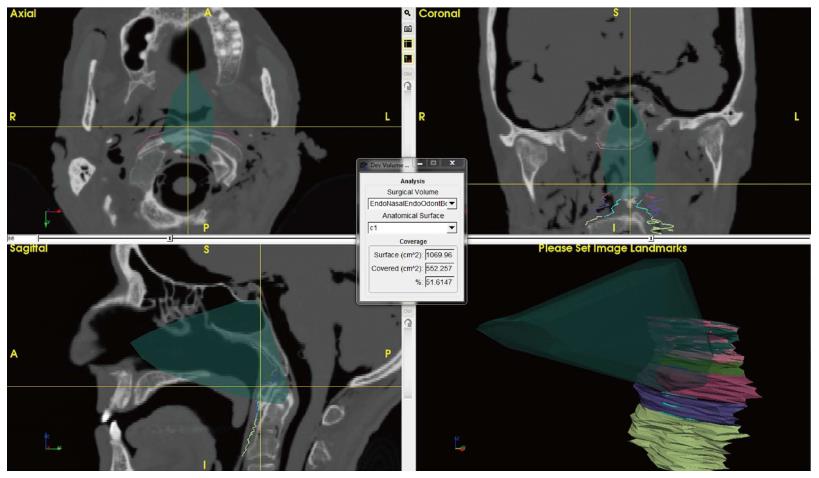
Figure 7 Detail of ApproachViewer screen during post-dissection analyses.
An endonasal endoscopic approach to the odontoid was performed in the anatomy laboratory and is retrieved and visualized in the three axes and as a volume. Different areas of interest have been contoured at the level of the anterior craniovertebral junction. The box at the center shows the absolute and percentage value of contoured C1 exposed by the approach (see online additional material - ApproachViewer guide 1.0 for further details).
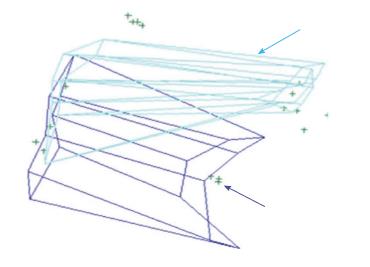
Figure 8 Three-D rendering of endonasal endoscopic (light blue) and transoral with soft palate split (purple) approaches to the anterior cranio-vertebral junction
- Citation: Doglietto F, Qiu J, Ravichandiran M, Radovanovic I, Belotti F, Agur A, Zadeh G, Fontanella MM, Kucharczyk W, Gentili F. Quantitative comparison of cranial approaches in the anatomy laboratory: A neuronavigation based research method. World J Methodol 2017; 7(4): 139-147
- URL: https://www.wjgnet.com/2222-0682/full/v7/i4/139.htm
- DOI: https://dx.doi.org/10.5662/wjm.v7.i4.139


