
















Copyright: ©Author(s) 2026.
World J Transl Med. Nov 28, 2026; 12(4): 126295
Published online Nov 28, 2026. doi: 10.5528/wjtm.126295
Published online Nov 28, 2026. doi: 10.5528/wjtm.126295
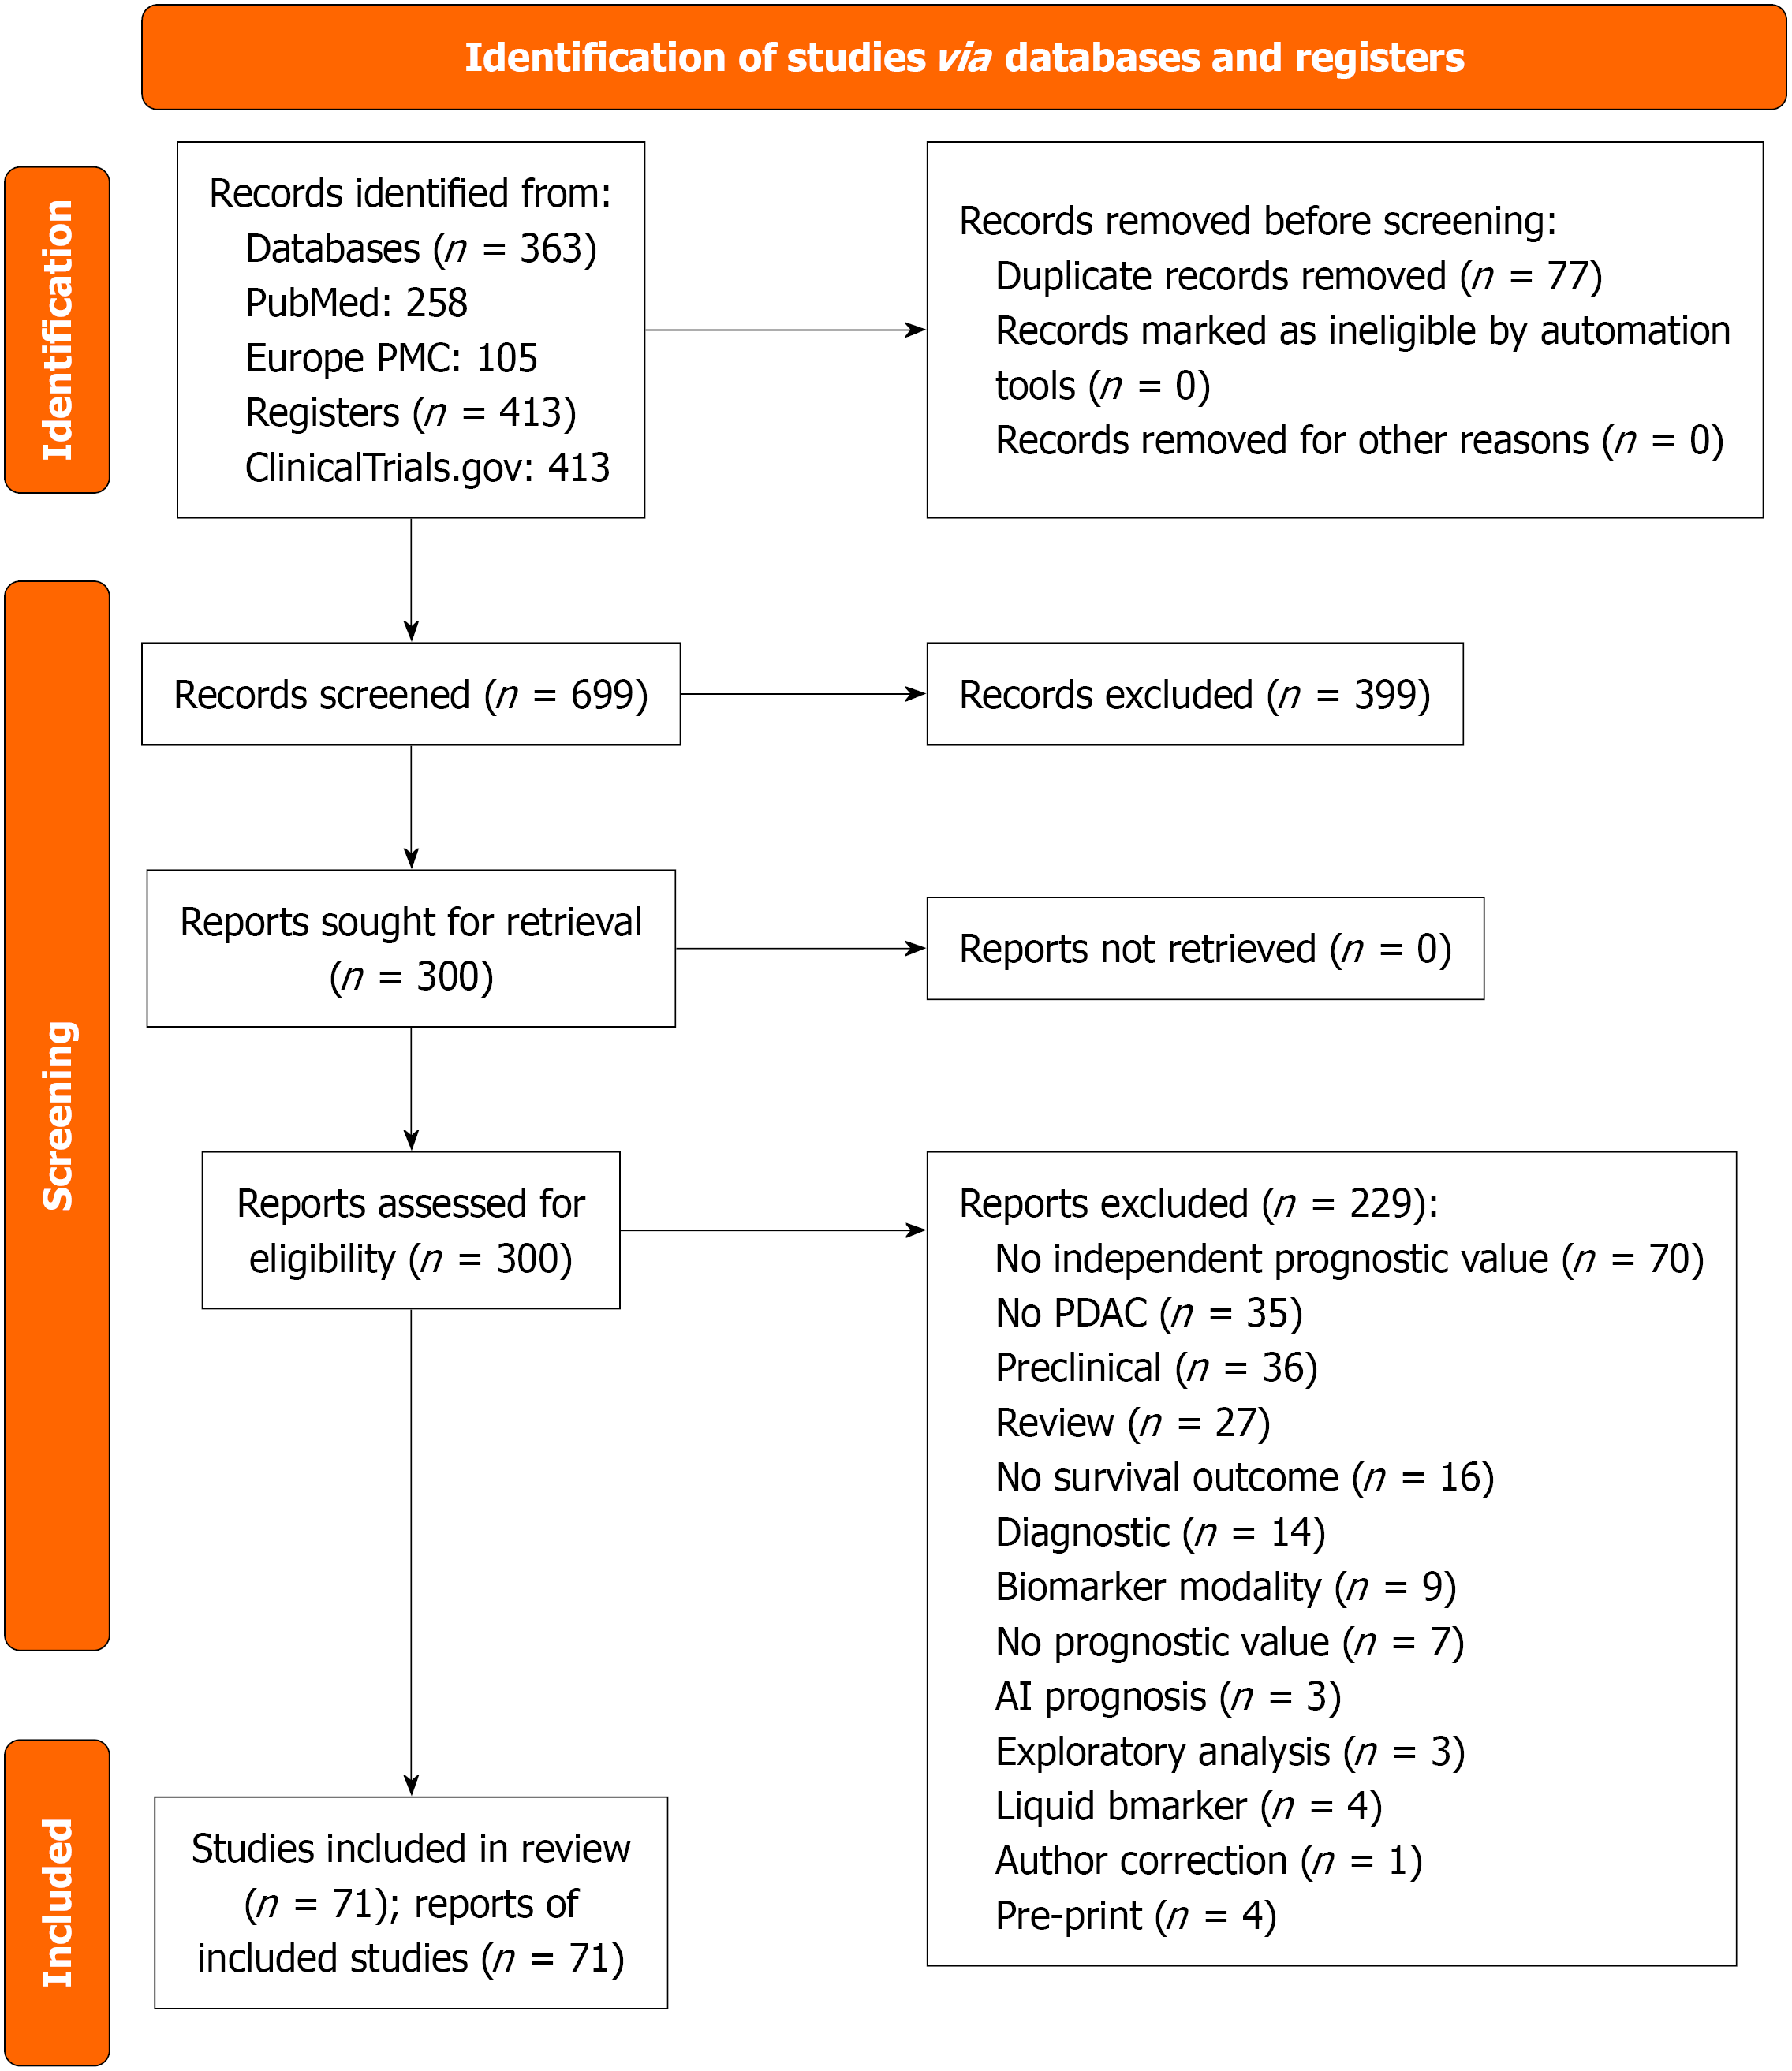
Figure 1 Preferred reporting items for systematic reviews and meta-analyses 2020 flow chart.
The included studies evaluated transcriptomic and proteomic prognostic biomarkers and related clinical trials in pancreatic ductal adenocarcinoma. PDAC: Pancreatic ductal adenocarcinoma; AI: Artificial intelligence.
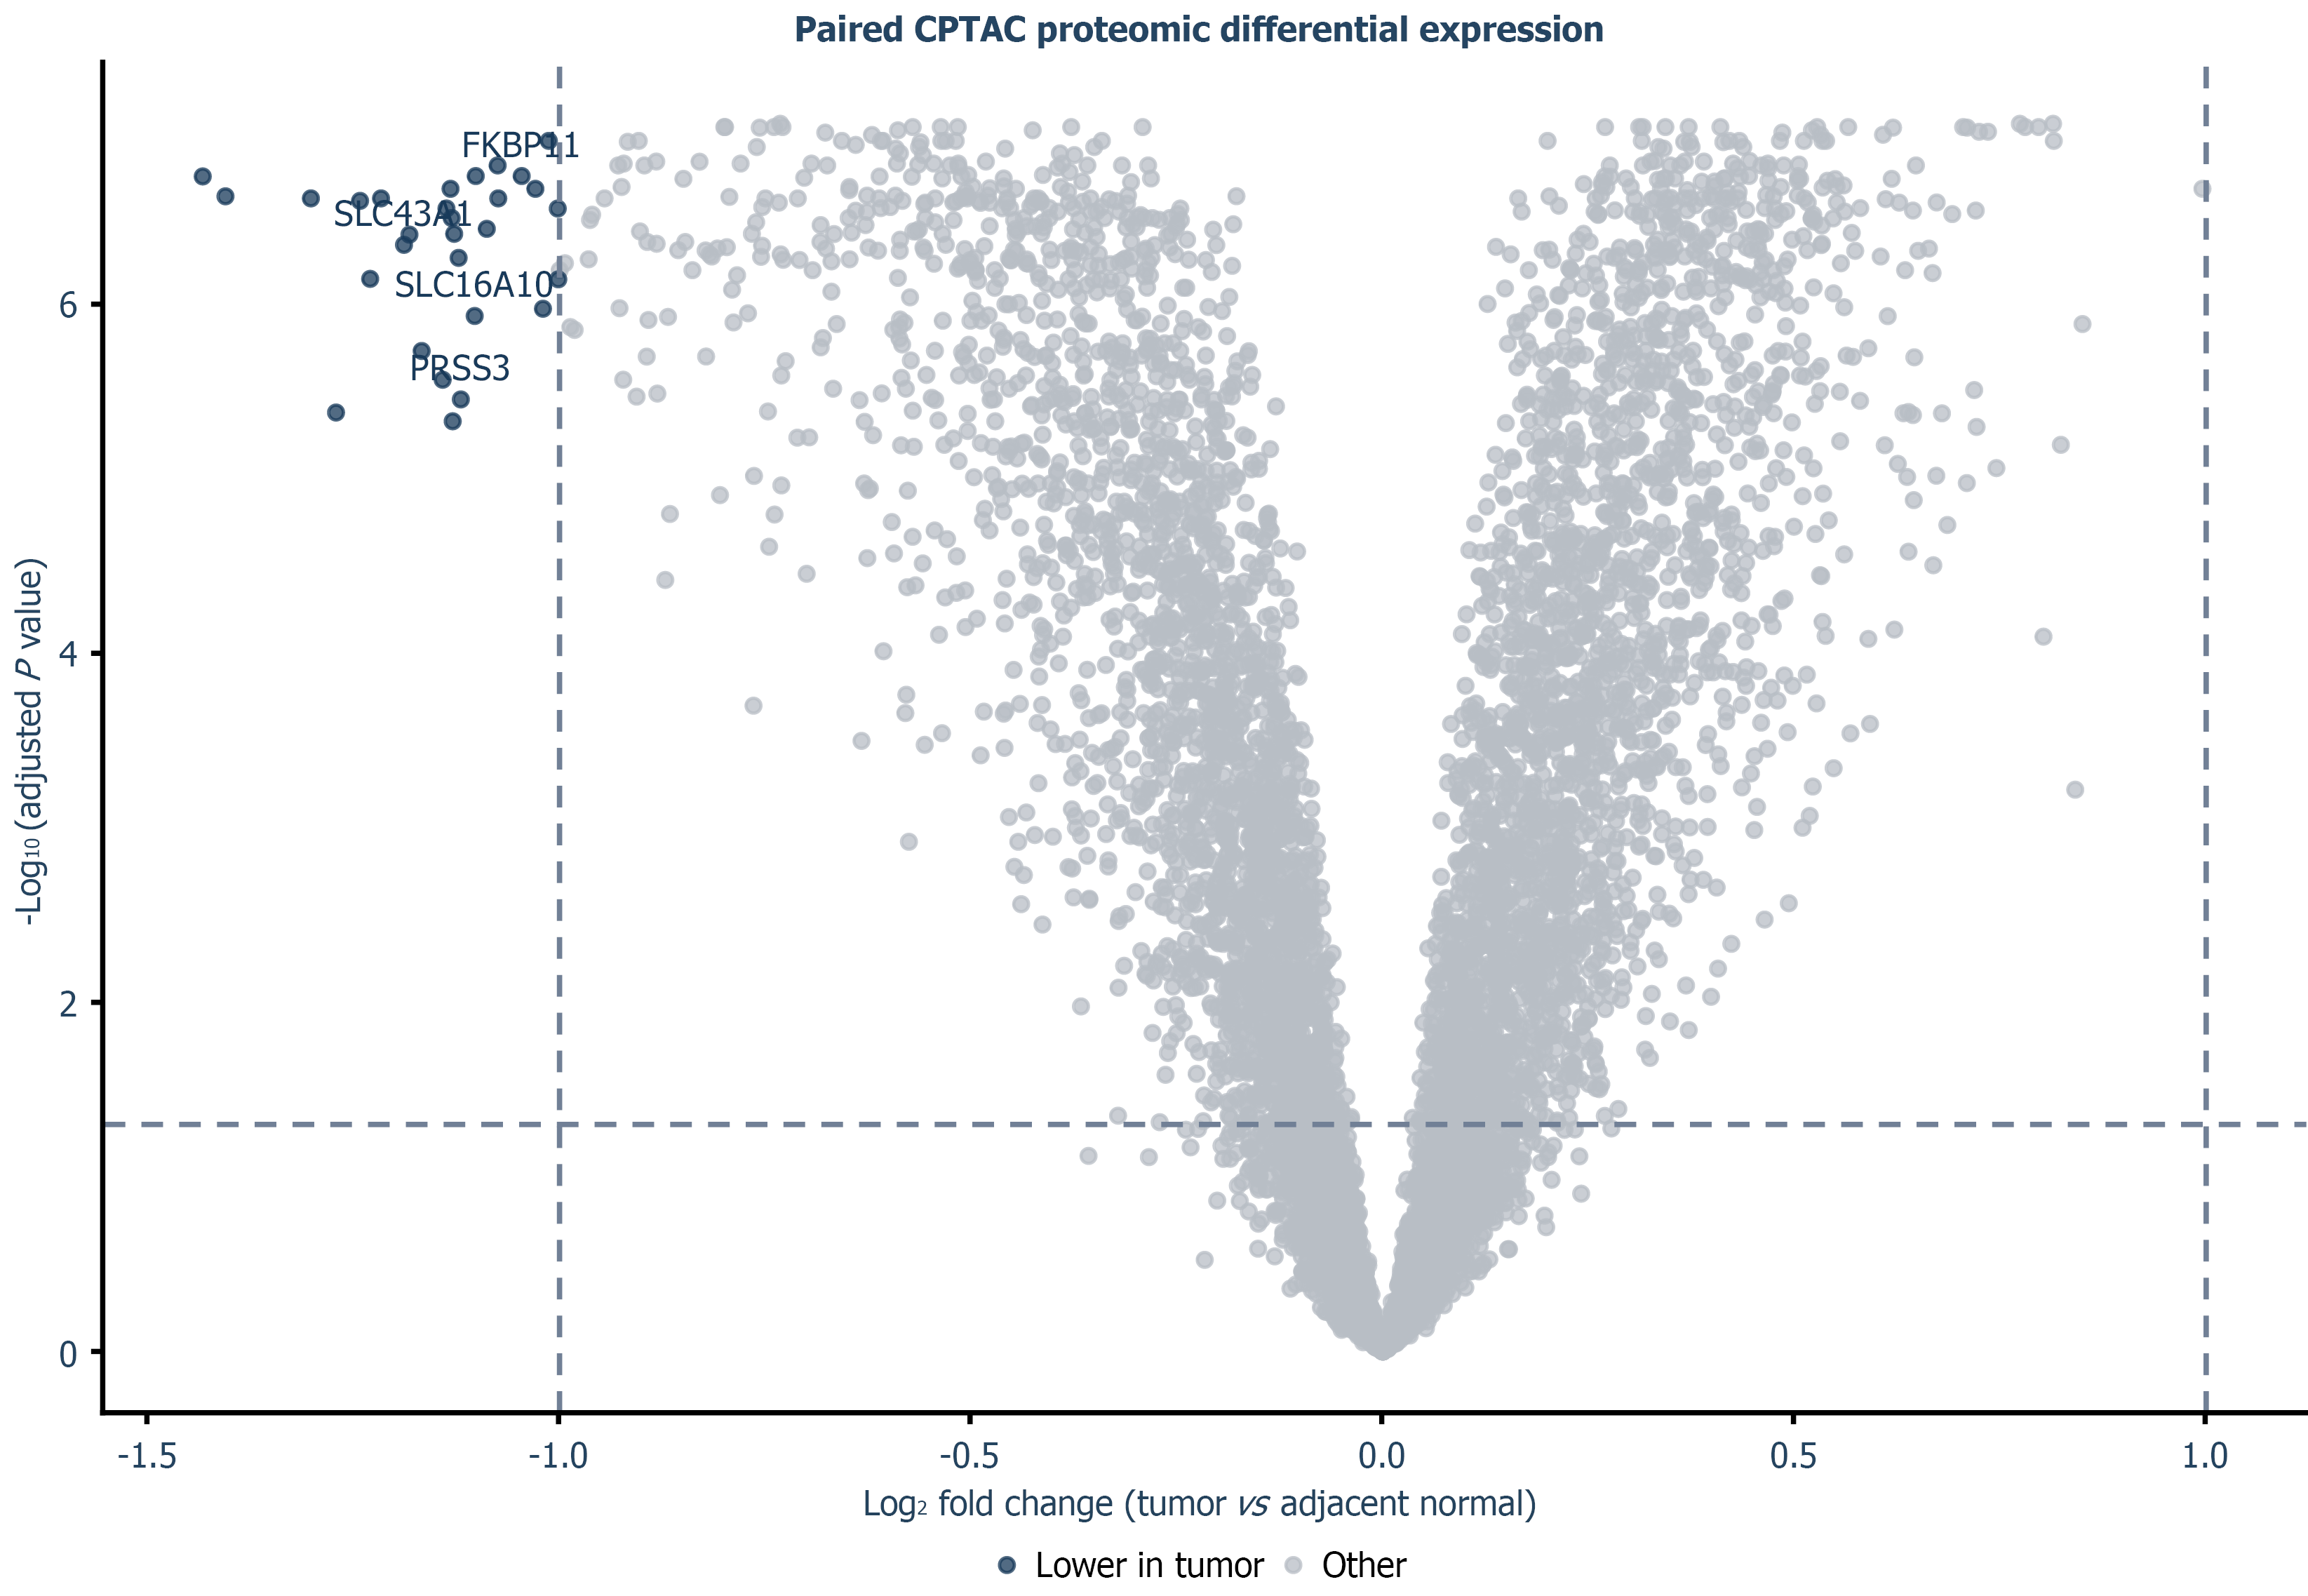
Figure 2 Differential protein expression between pancreatic ductal adenocarcinoma tumors and matched adjacent-normal tissues in the Clinical Proteomic Tumor Analysis Consortium pancreatic ductal adenocarcinoma cohort.
Labeled proteins met both significance criteria. CPTAC: Clinical Proteomic Tumor Analysis Consortium.
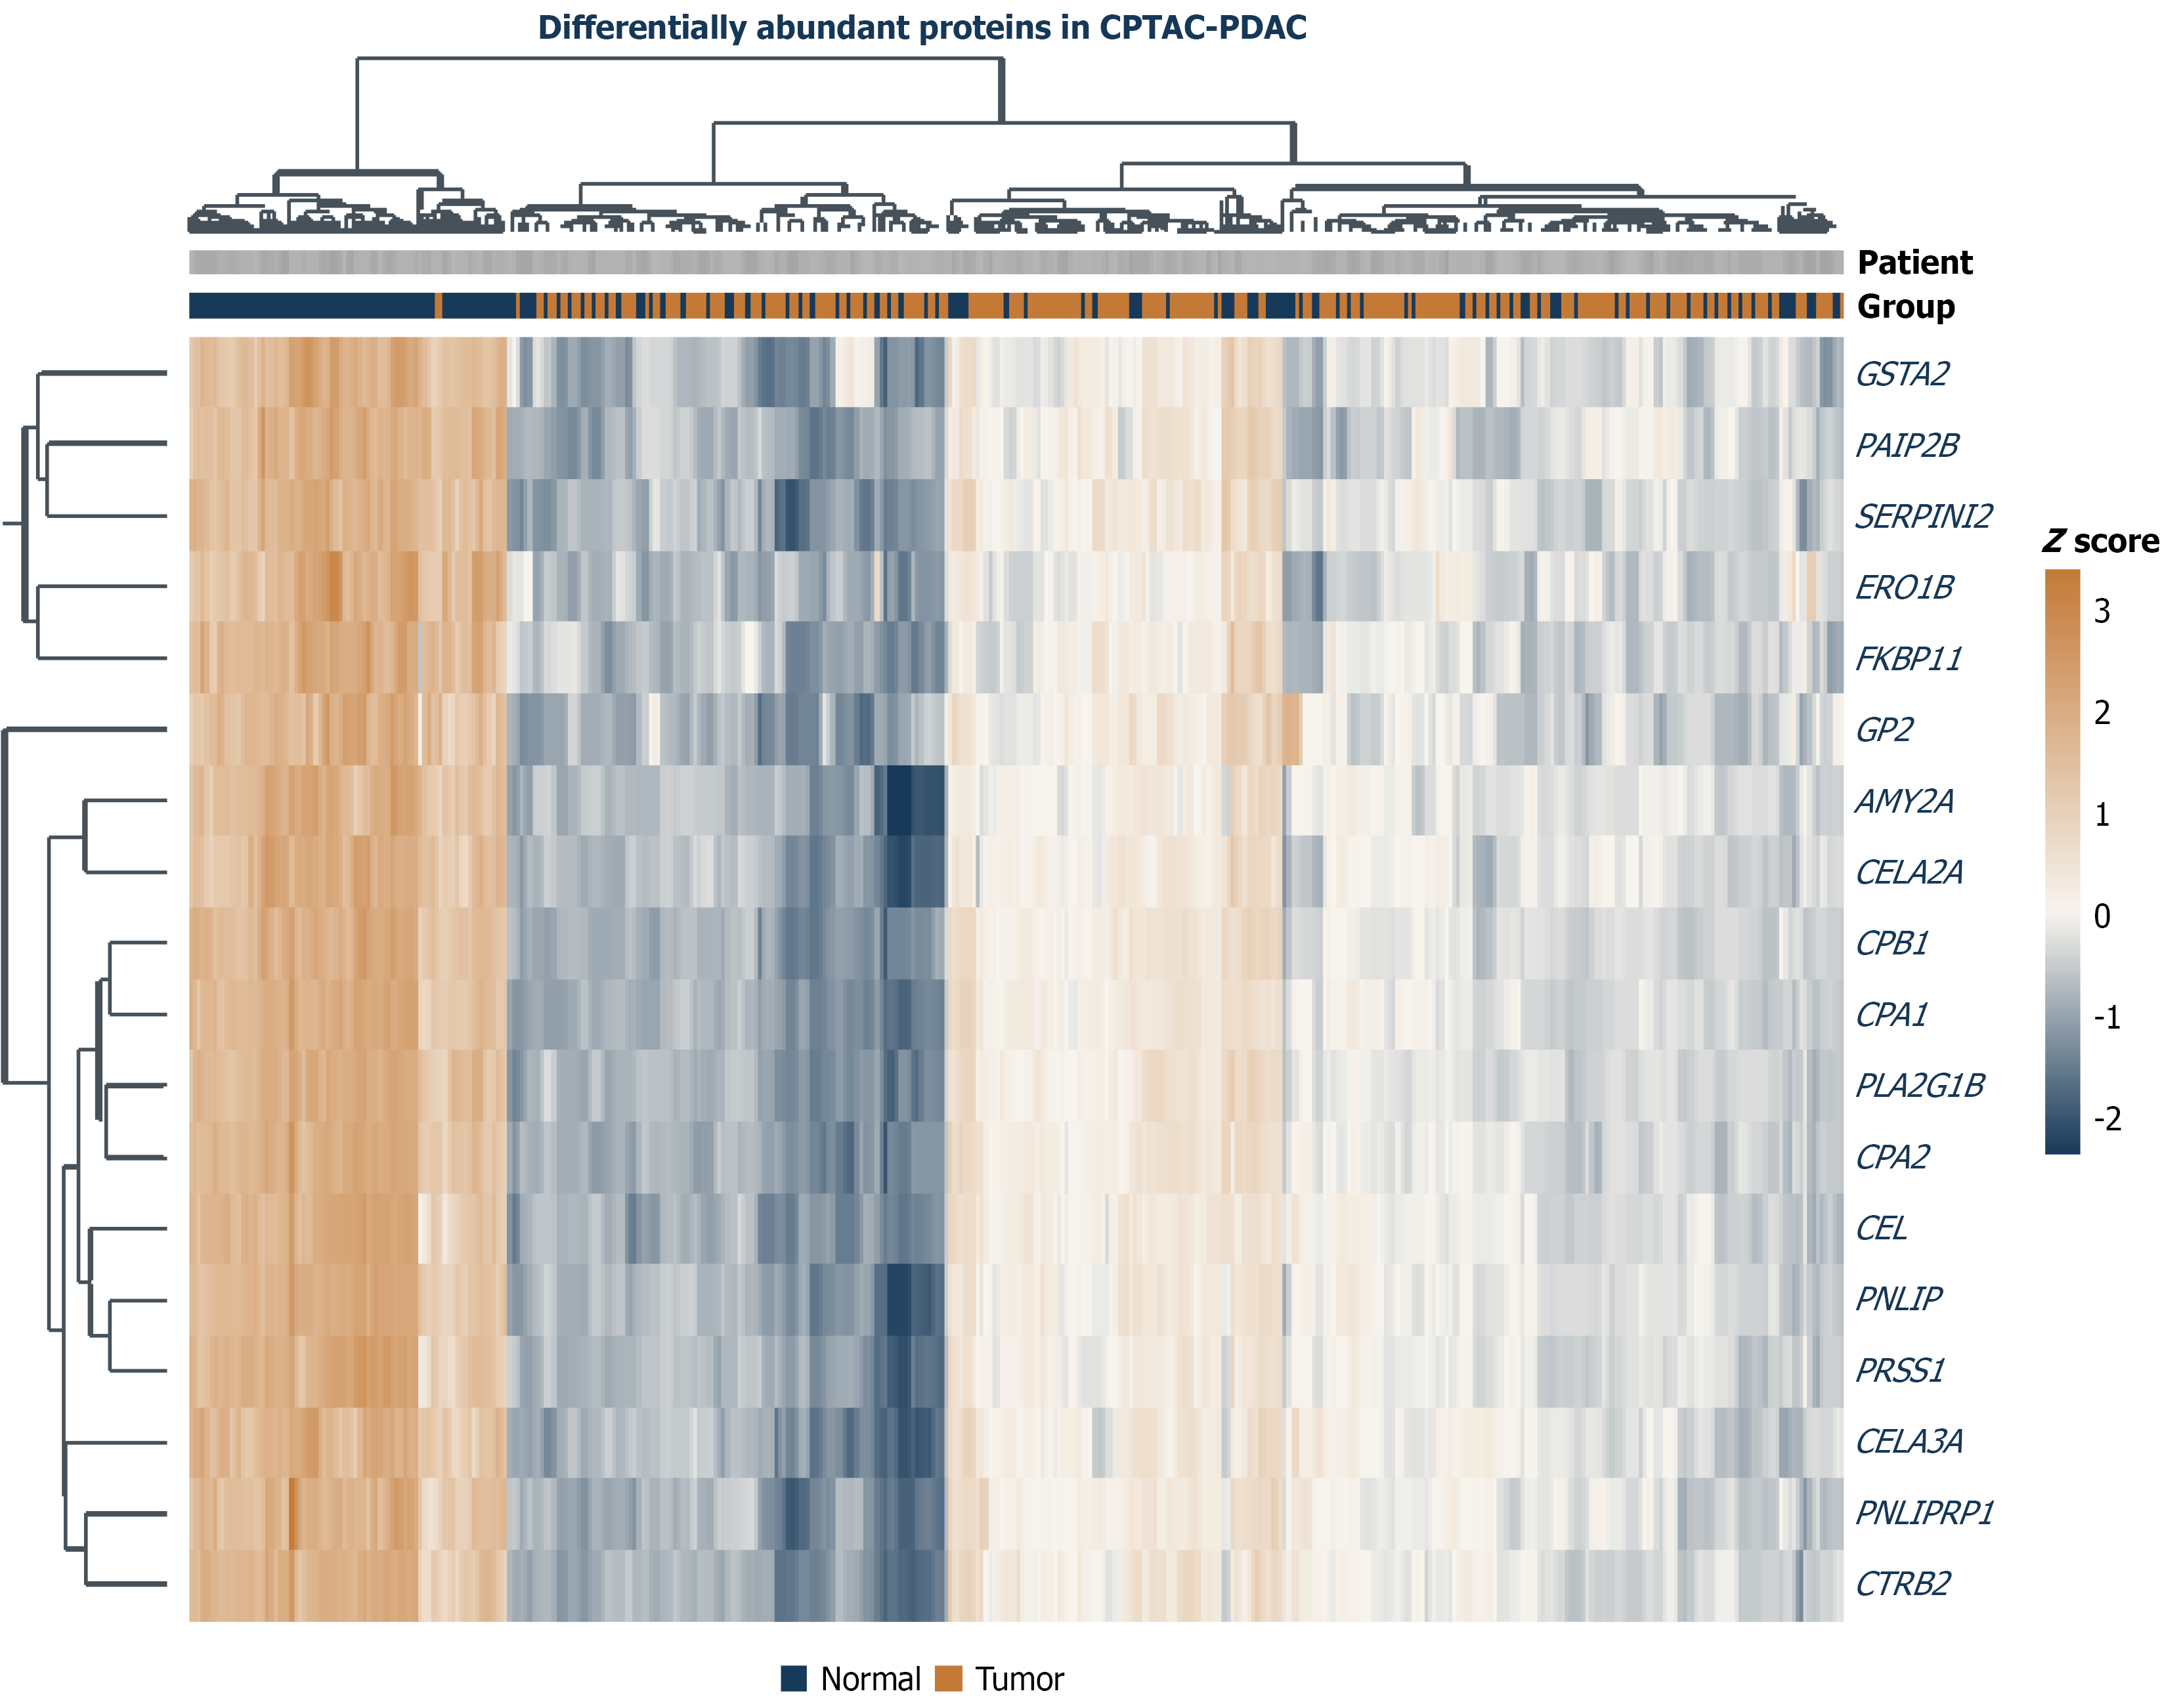
Figure 3 Heatmap of the top differentially expressed proteins identified in the Clinical Proteomic Tumor Analysis Consortium pancreatic ductal adenocarcinoma cohort.
Rows represent proteins, and columns represent individual samples. Protein expression values are displayed as row-wise standardized (z-score) expression levels, with brown indicating relatively high expression and blue indicating relatively low expression. CPTAC: Clinical Proteomic Tumor Analysis Consortium; PDAC: Pancreatic ductal adenocarcinoma.
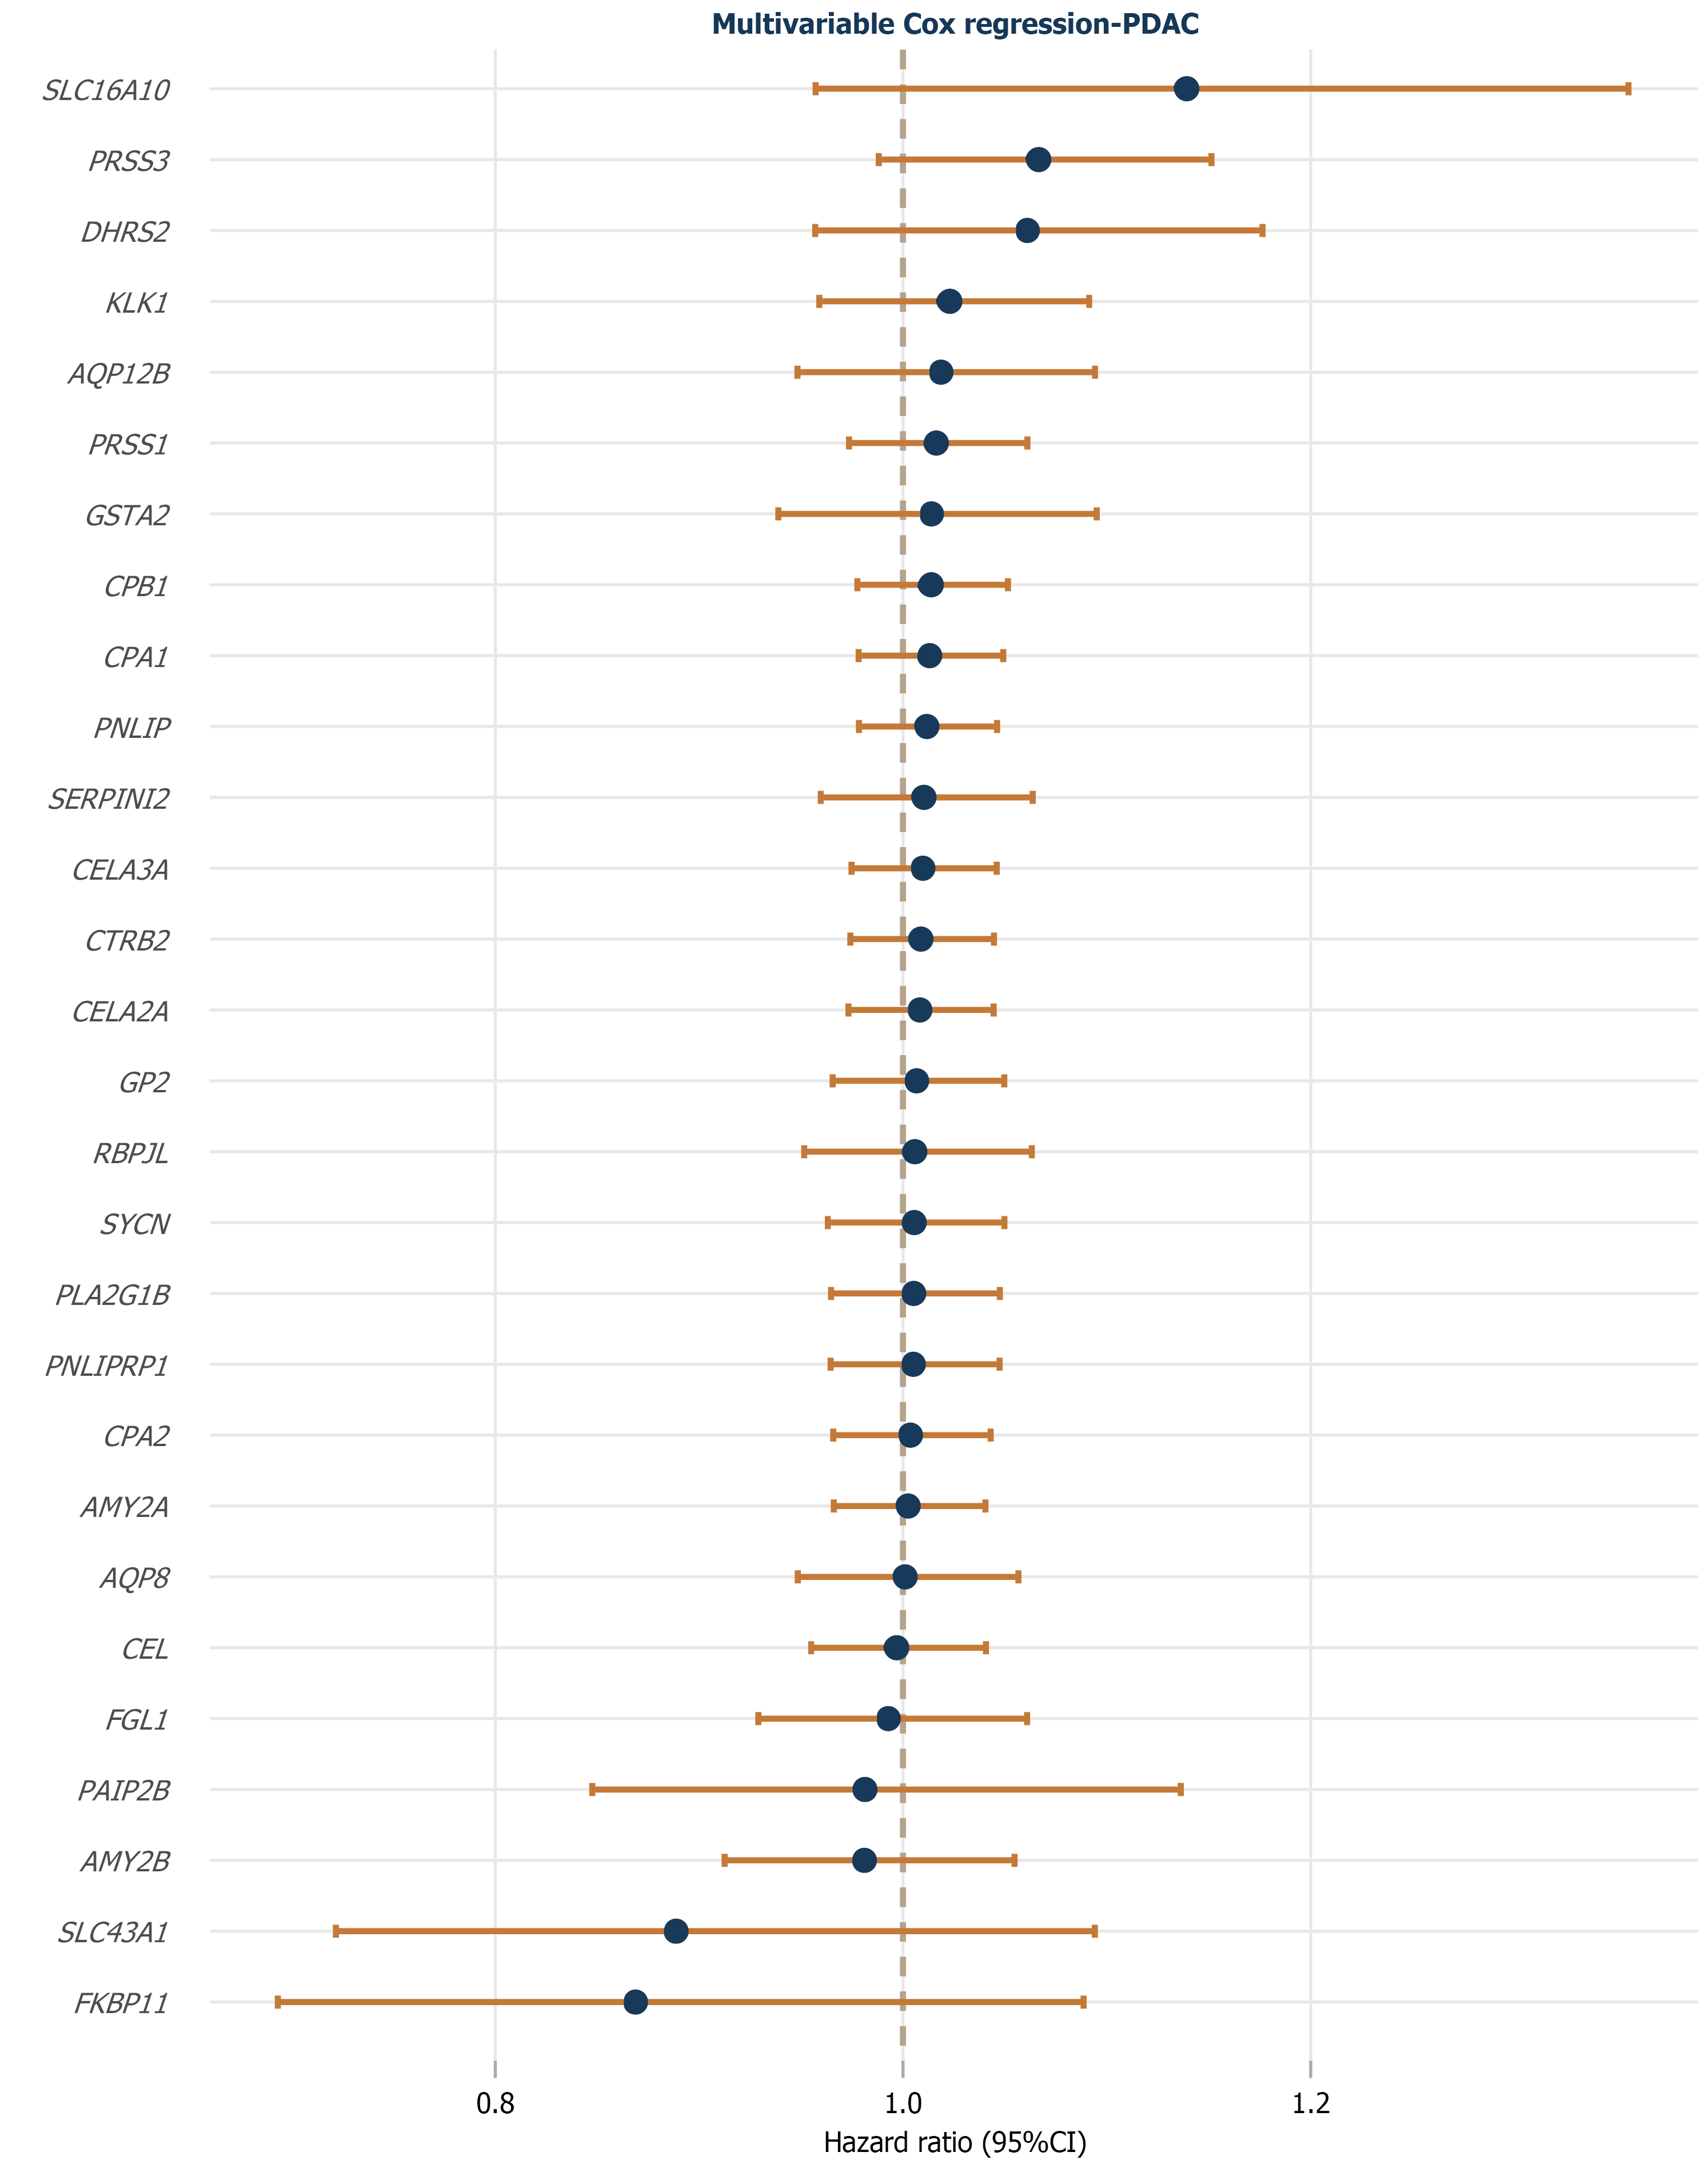
Figure 4 Multivariable Cox regression analysis of candidate genes in The Cancer Genome Atlas pancreatic adenocarcinoma cohort.
The vertical dashed line represents a hazard ratio of 1, indicating no association with survival. CI: Confidence interval; PDAC: Pancreatic ductal adenocarcinoma.
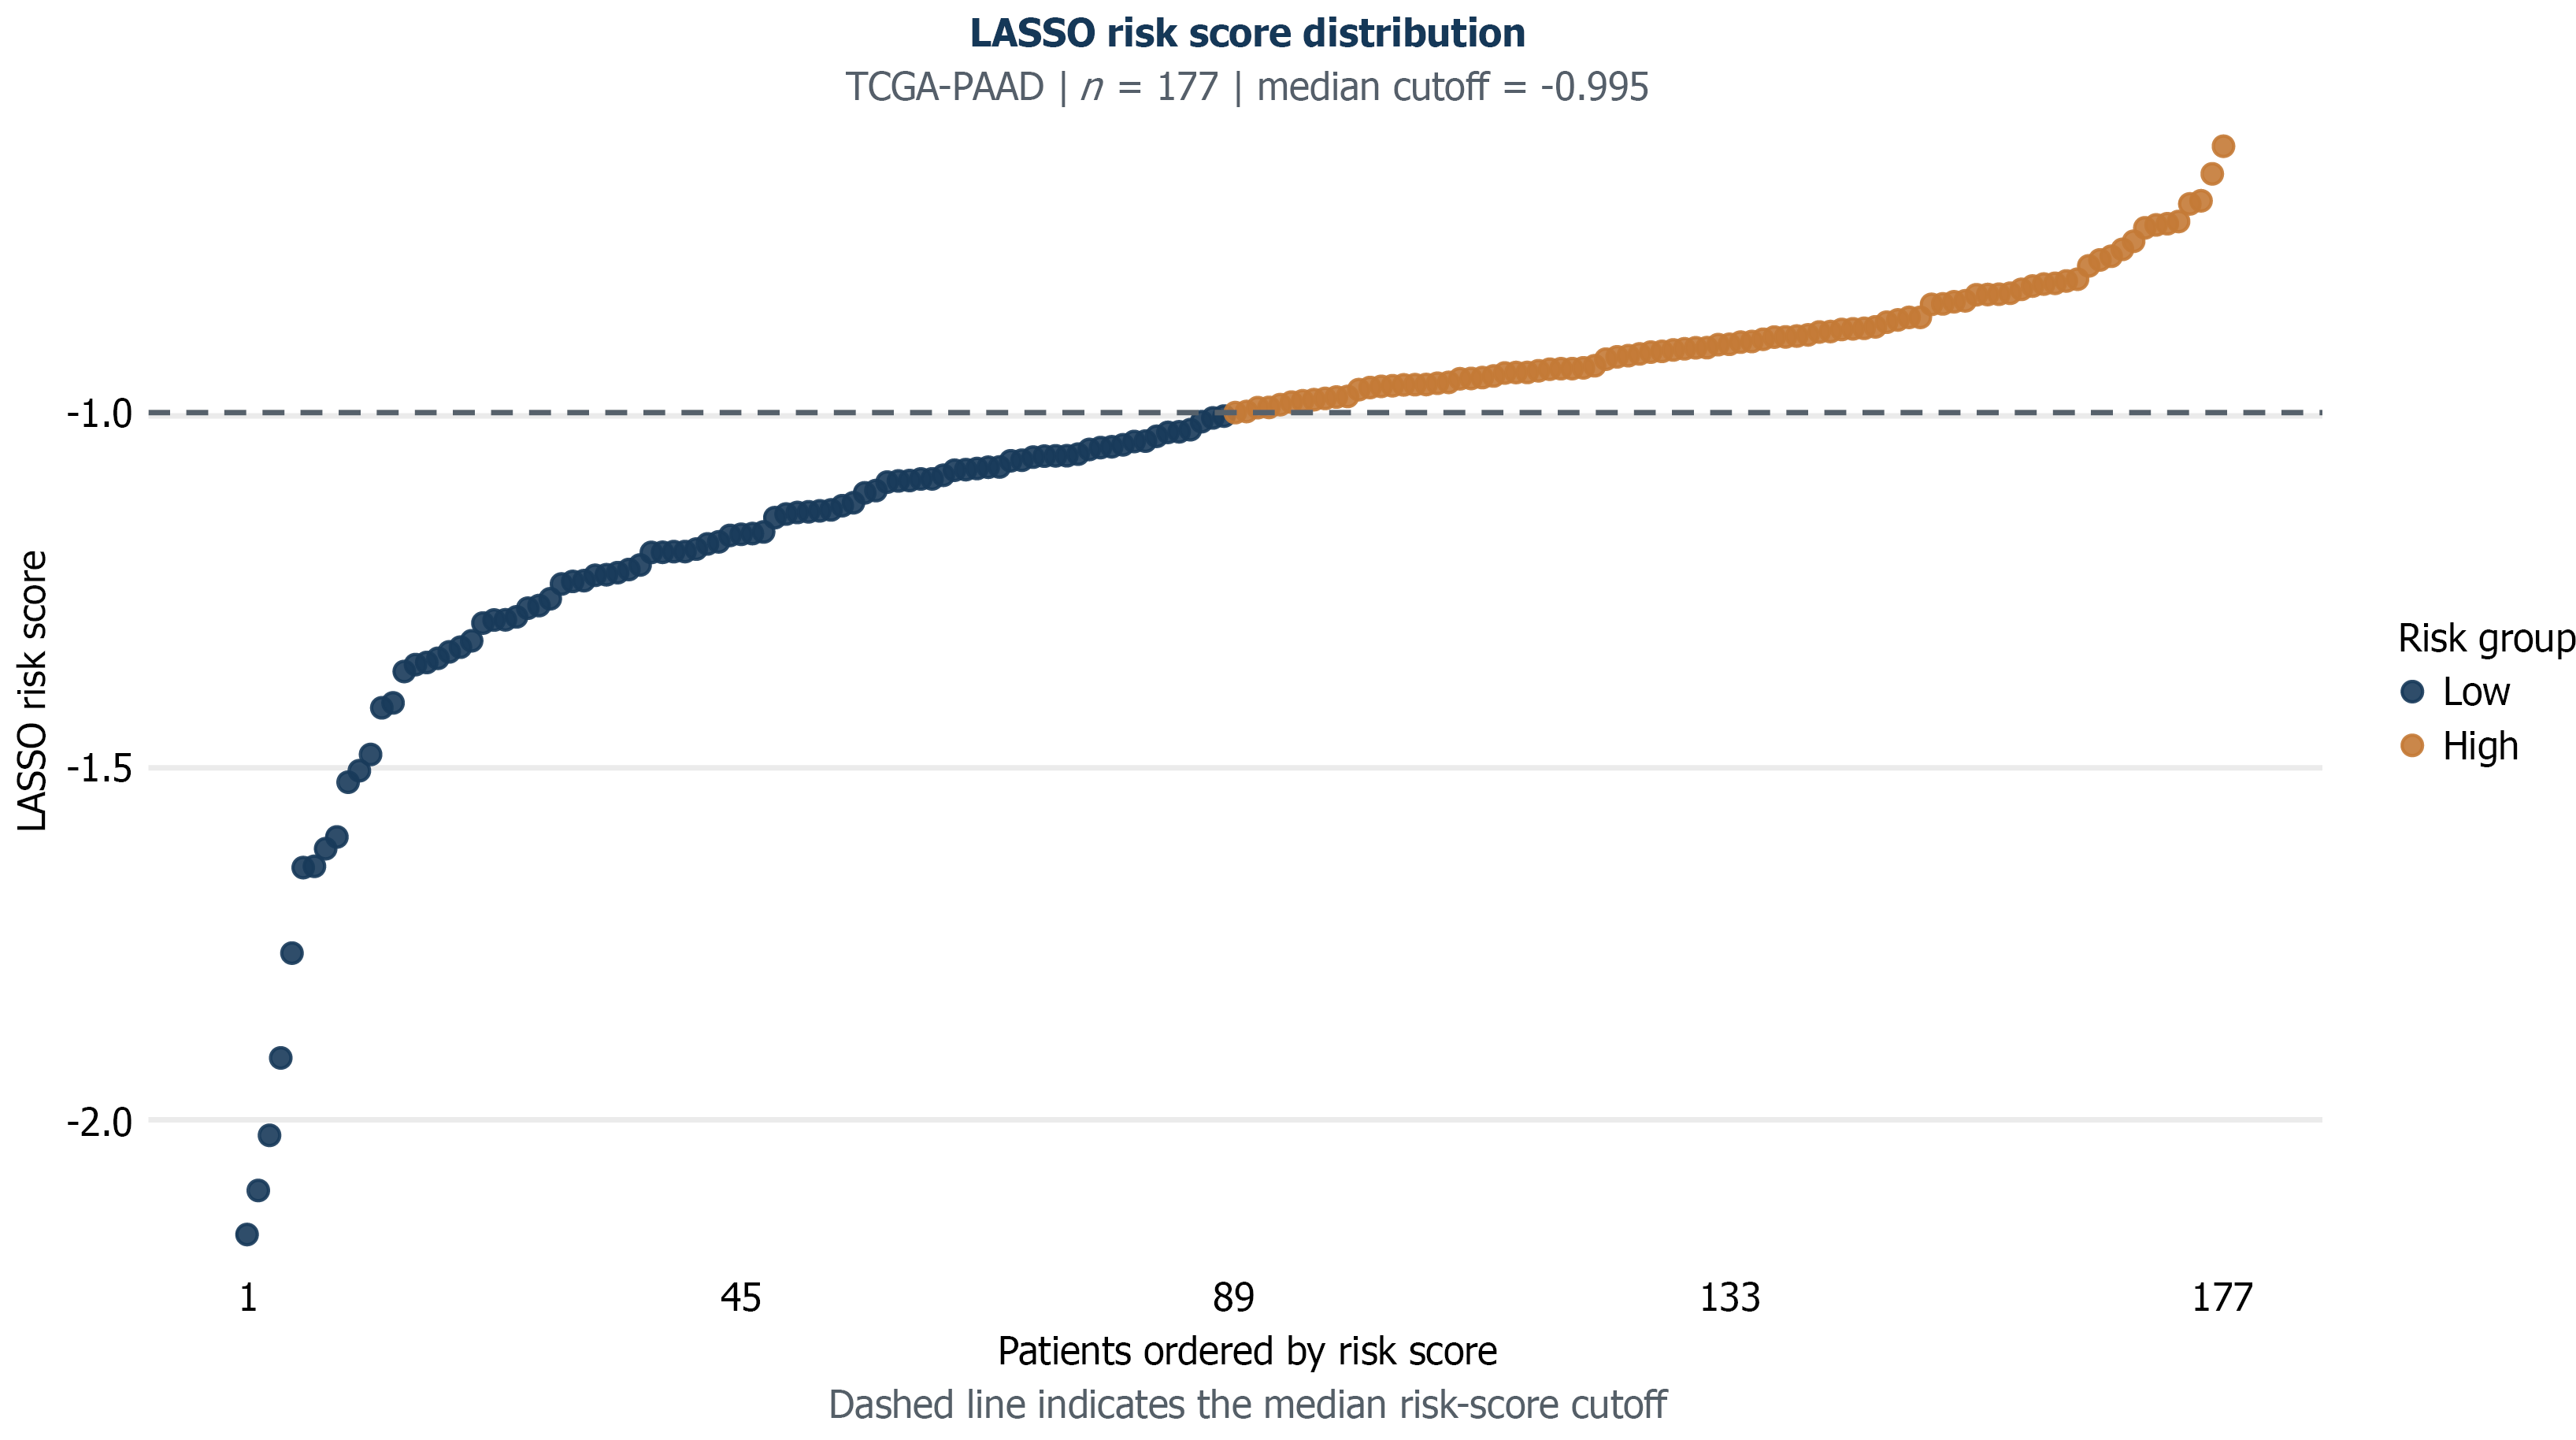
Figure 5 Distribution of the least absolute shrinkage and selection operator-derived risk score in The Cancer Genome Atlas pancreatic adenocarcinoma cohort.
Each point represents an individual patient ranked according to the continuous coefficient-weighted risk score derived from the 5-gene signature (PRSS3, SLC16A10, FKBP11, SLC43A1, and AMY2B). LASSO: Least absolute shrinkage and selection operator; TCGA-PAAD: The Cancer Genome Atlas pancreatic adenocarcinoma.
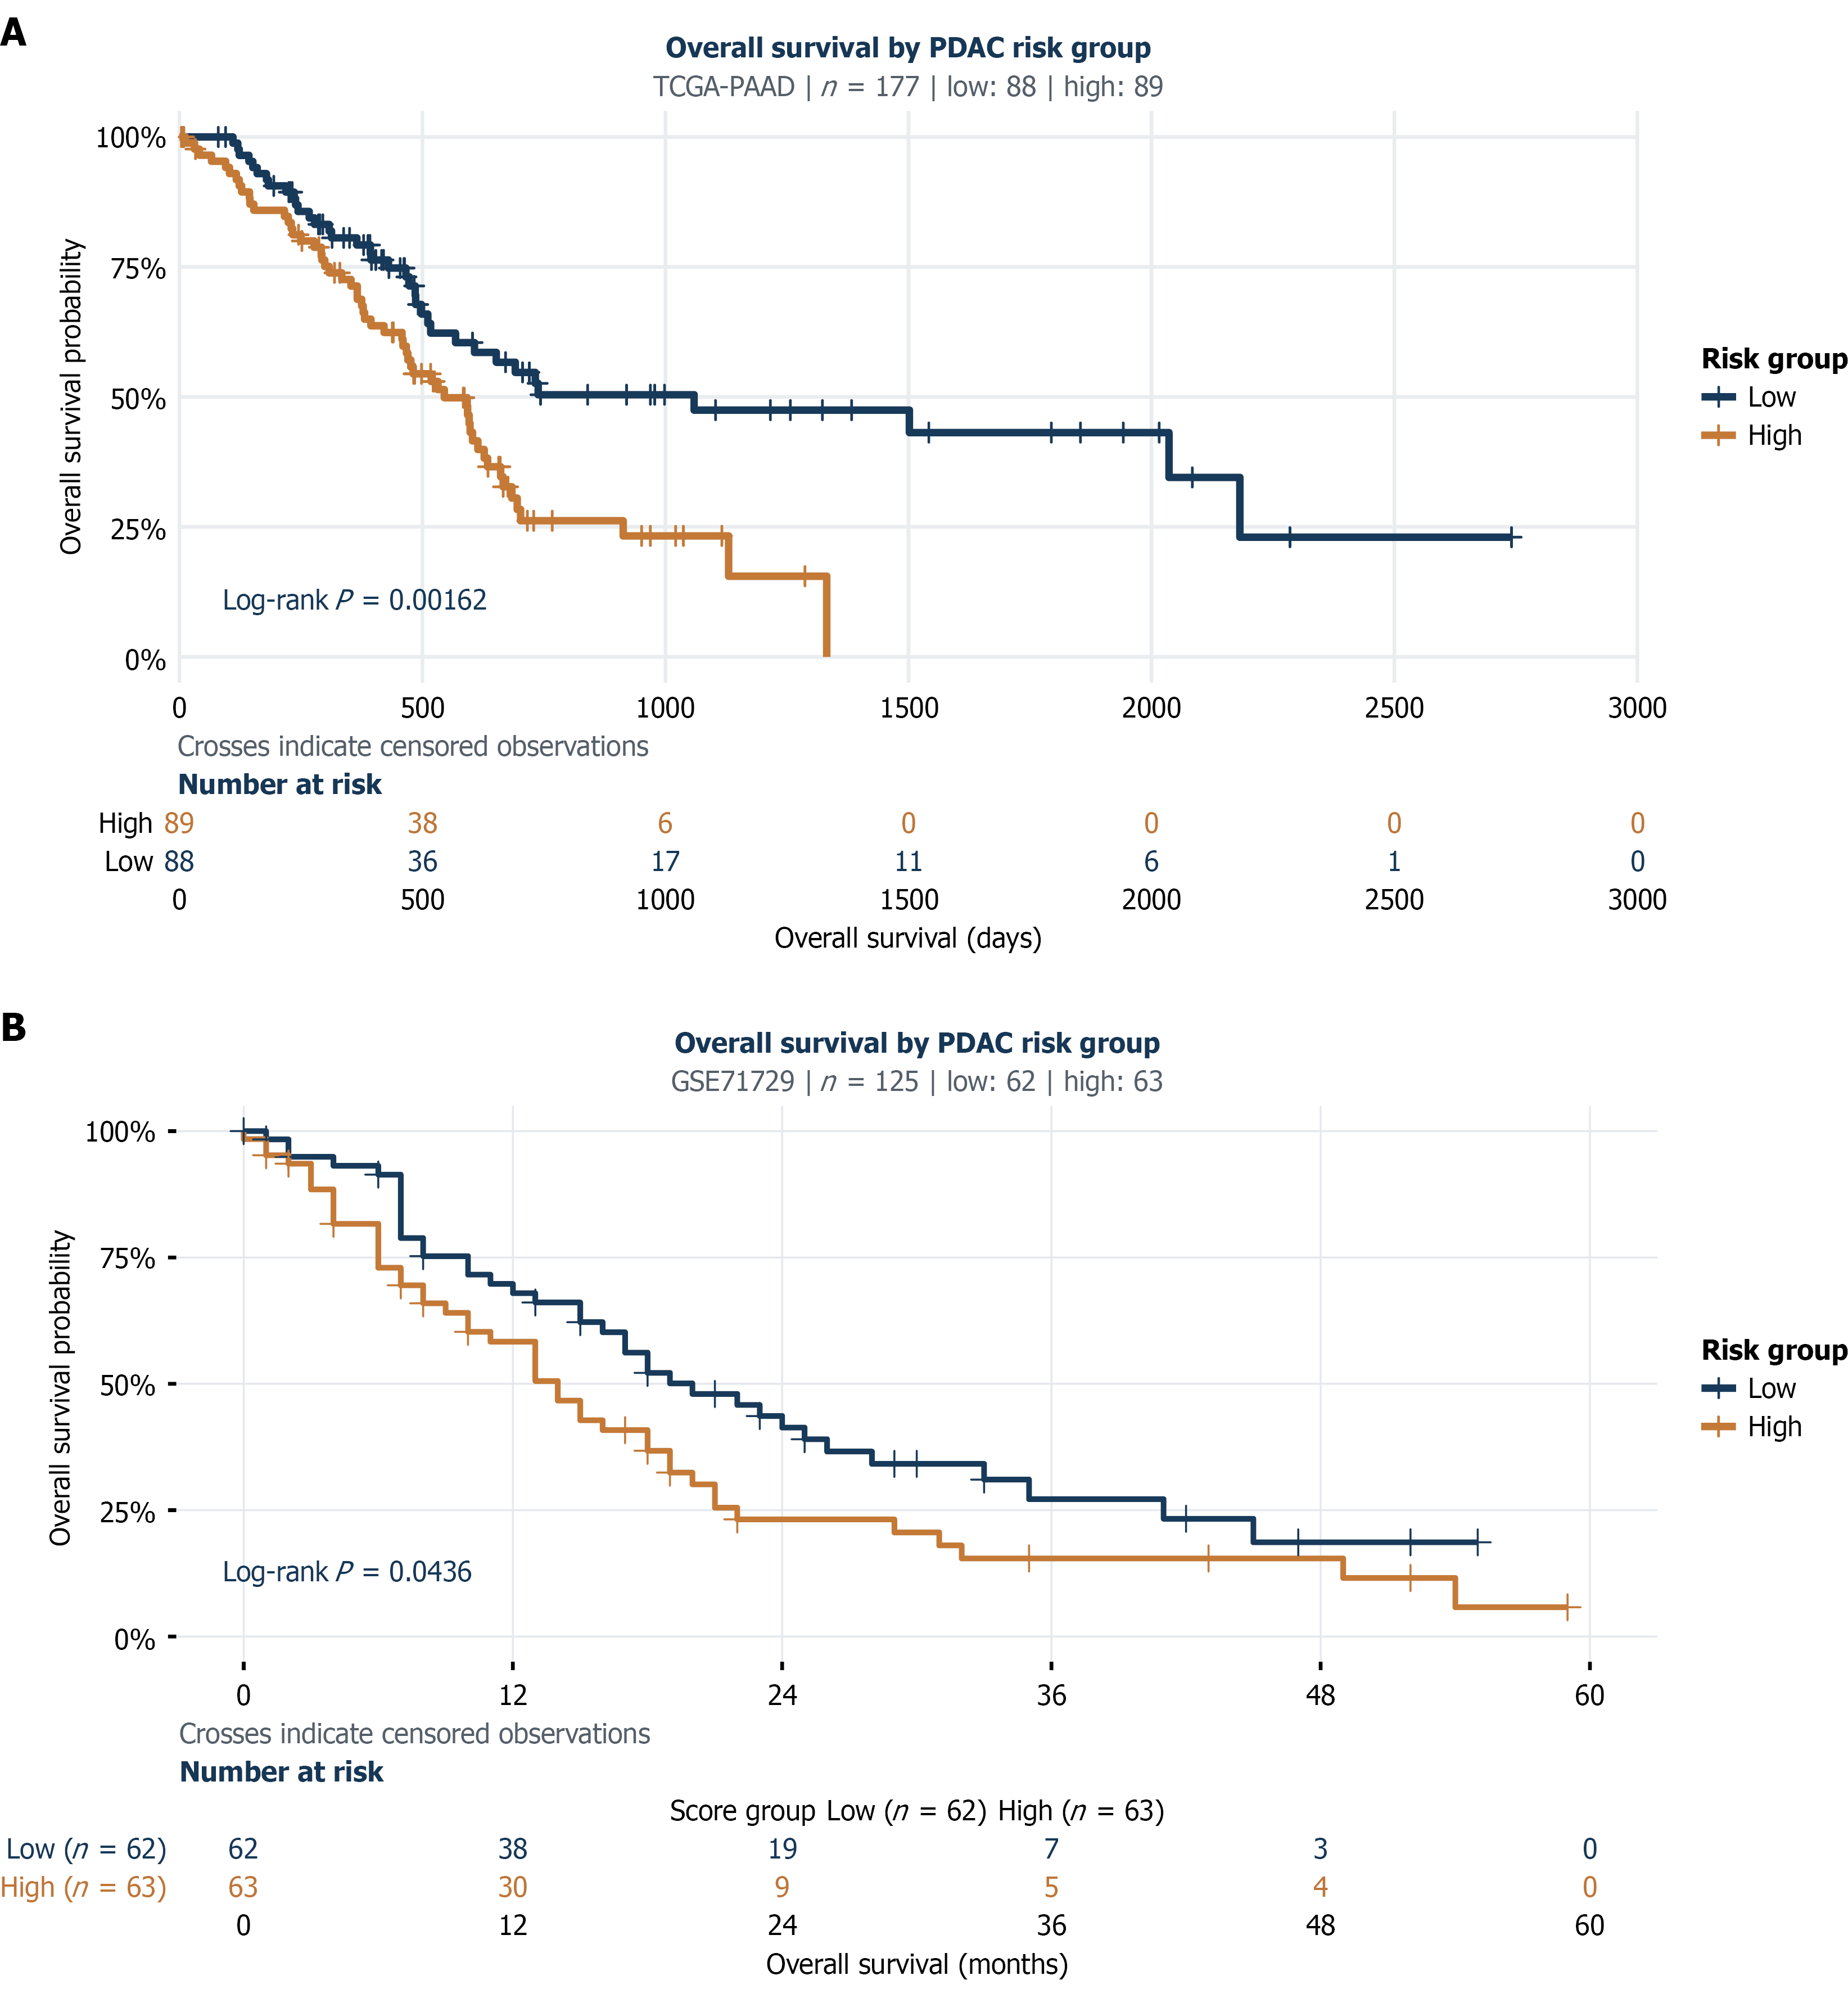
Figure 6 Kaplan-Meier overall survival curves.
A: The Cancer Genome Atlas pancreatic adenocarcinoma cohort according to the least absolute shrinkage and selection operator-derived 5-gene risk signature; B: The GSE71729 cohort according to the least absolute shrinkage and selection operator-derived 5-gene risk signature. PDAC: Pancreatic ductal adenocarcinoma; TCGA-PAAD: The Cancer Genome Atlas pancreatic adenocarcinoma.
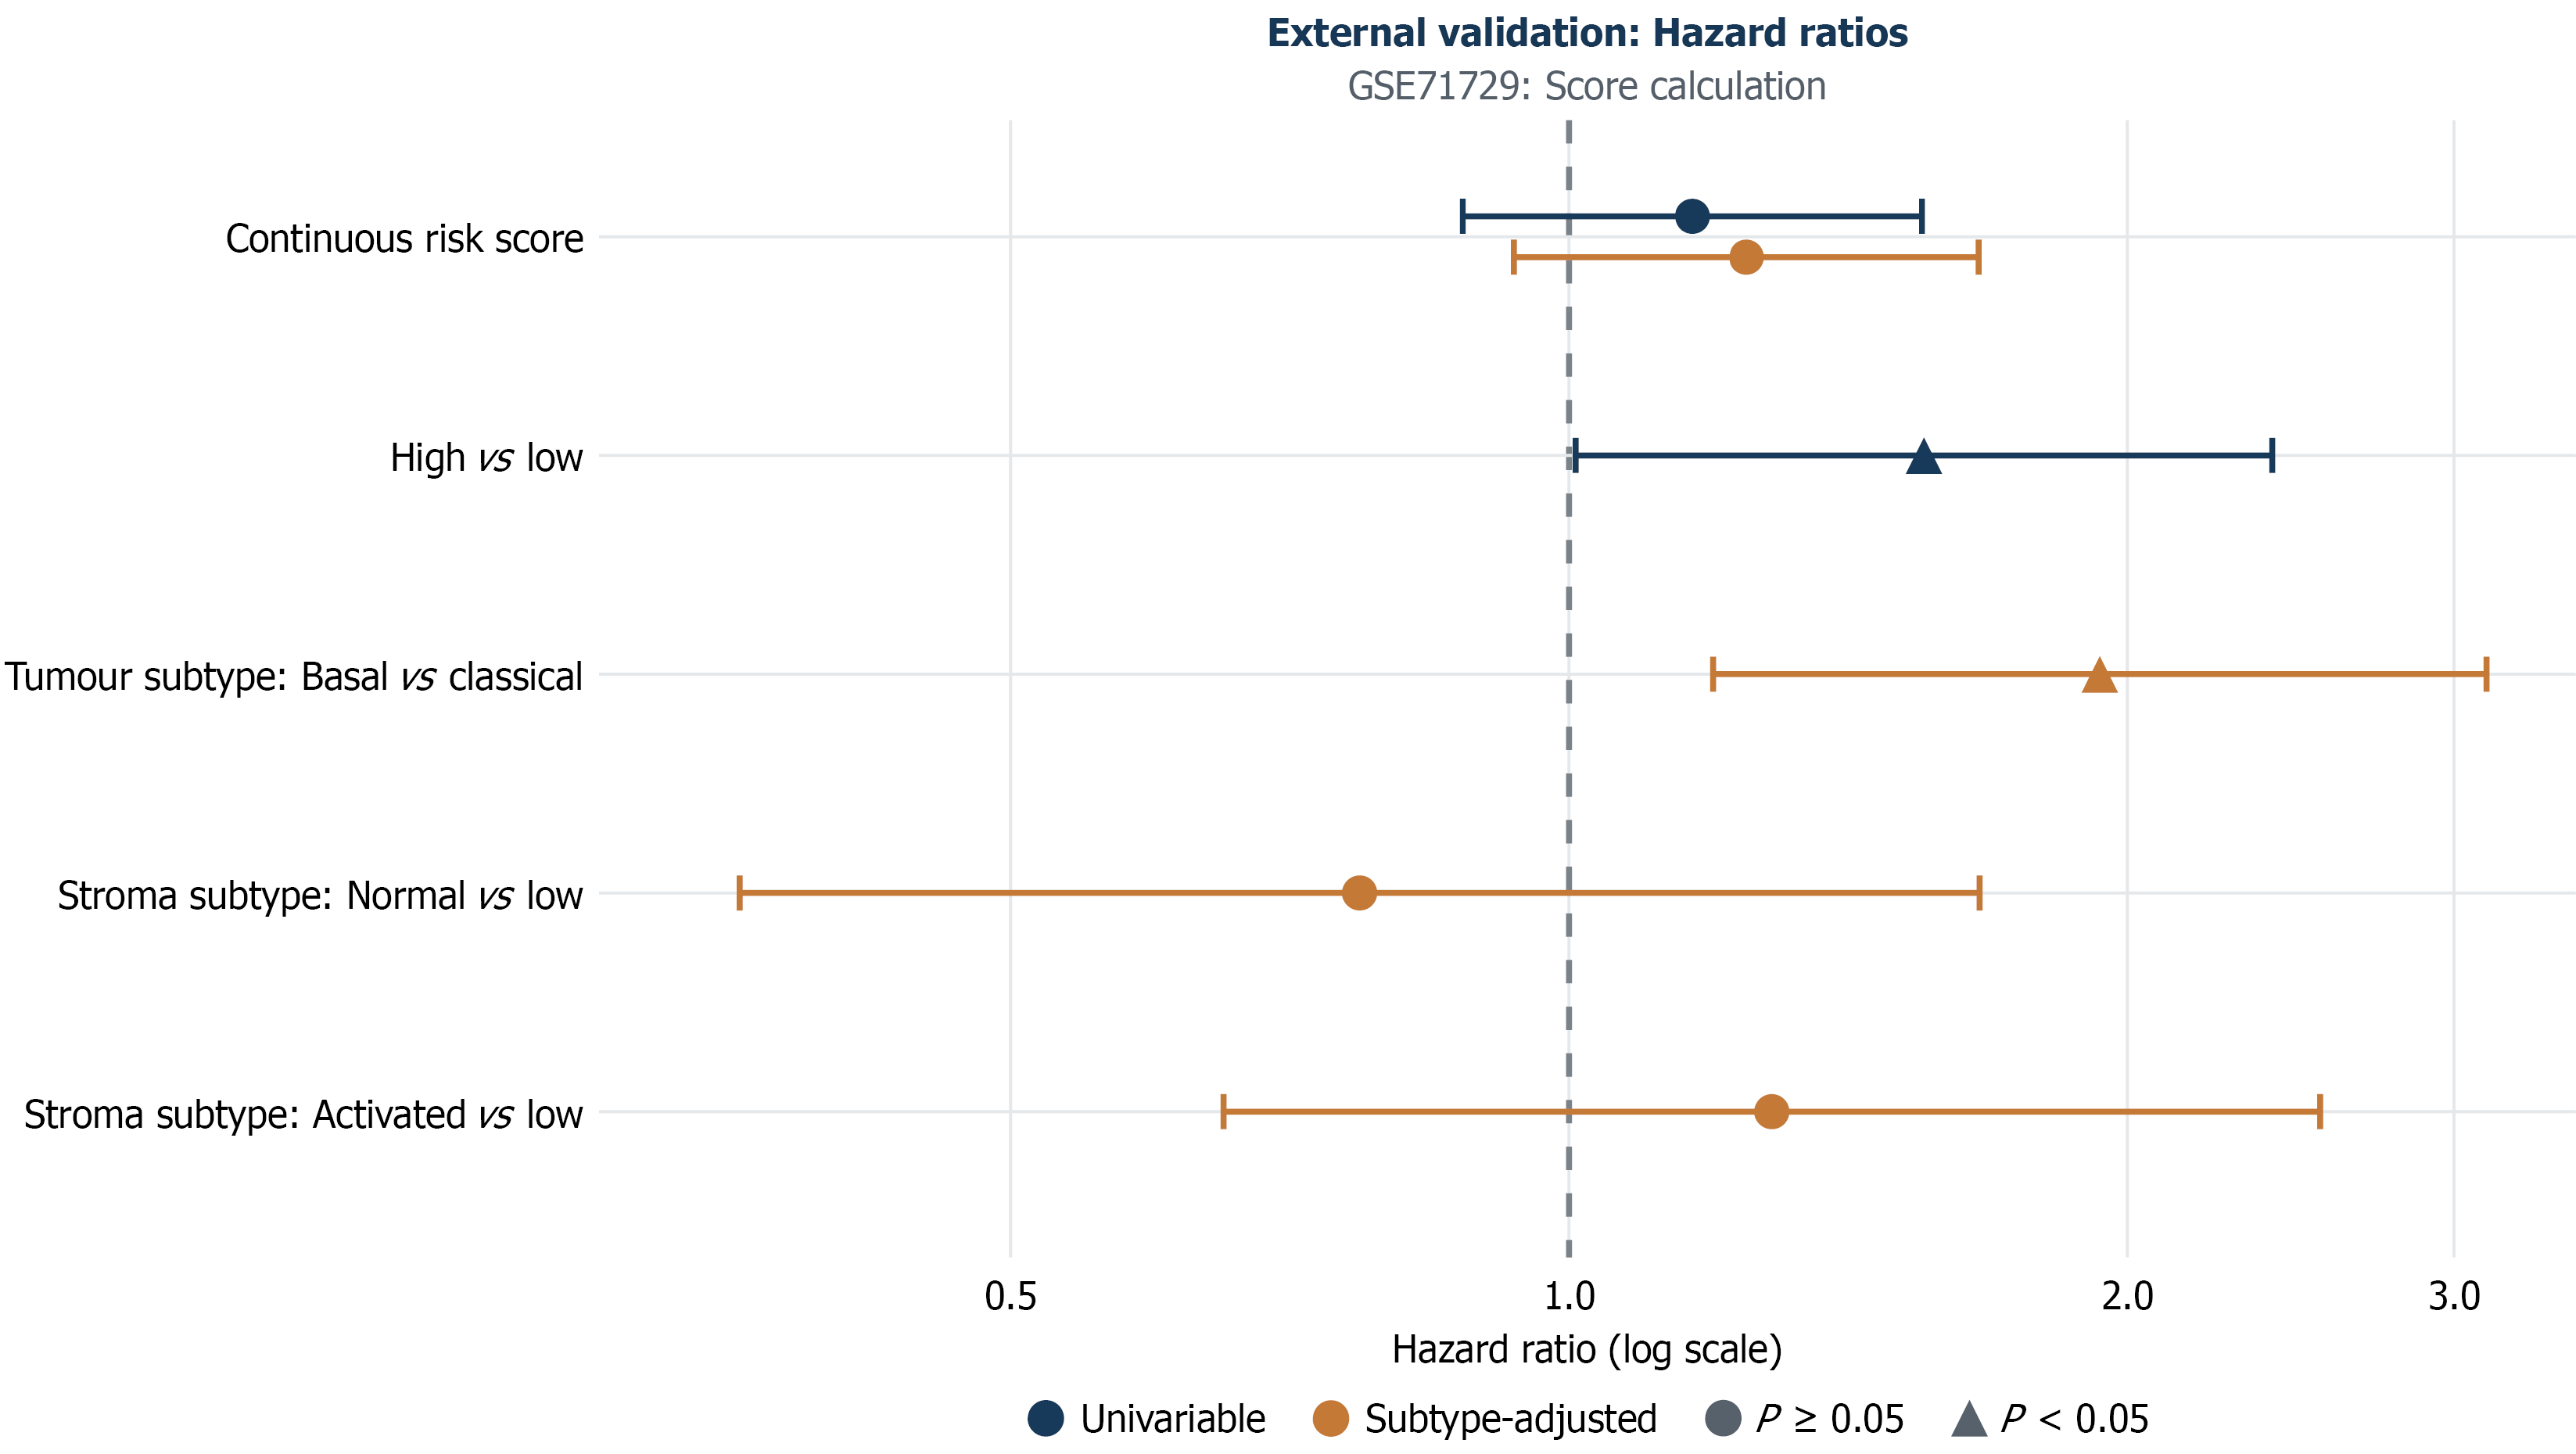
Figure 7 External validation of the least absolute shrinkage and selection operator-derived prognostic signature in the GSE71729 cohort.
Forest plot showing hazard ratios with 95% confidence intervals for the continuous risk score, median-based high- vs low-risk groups, Moffitt tumor subtype, and stromal subtype.
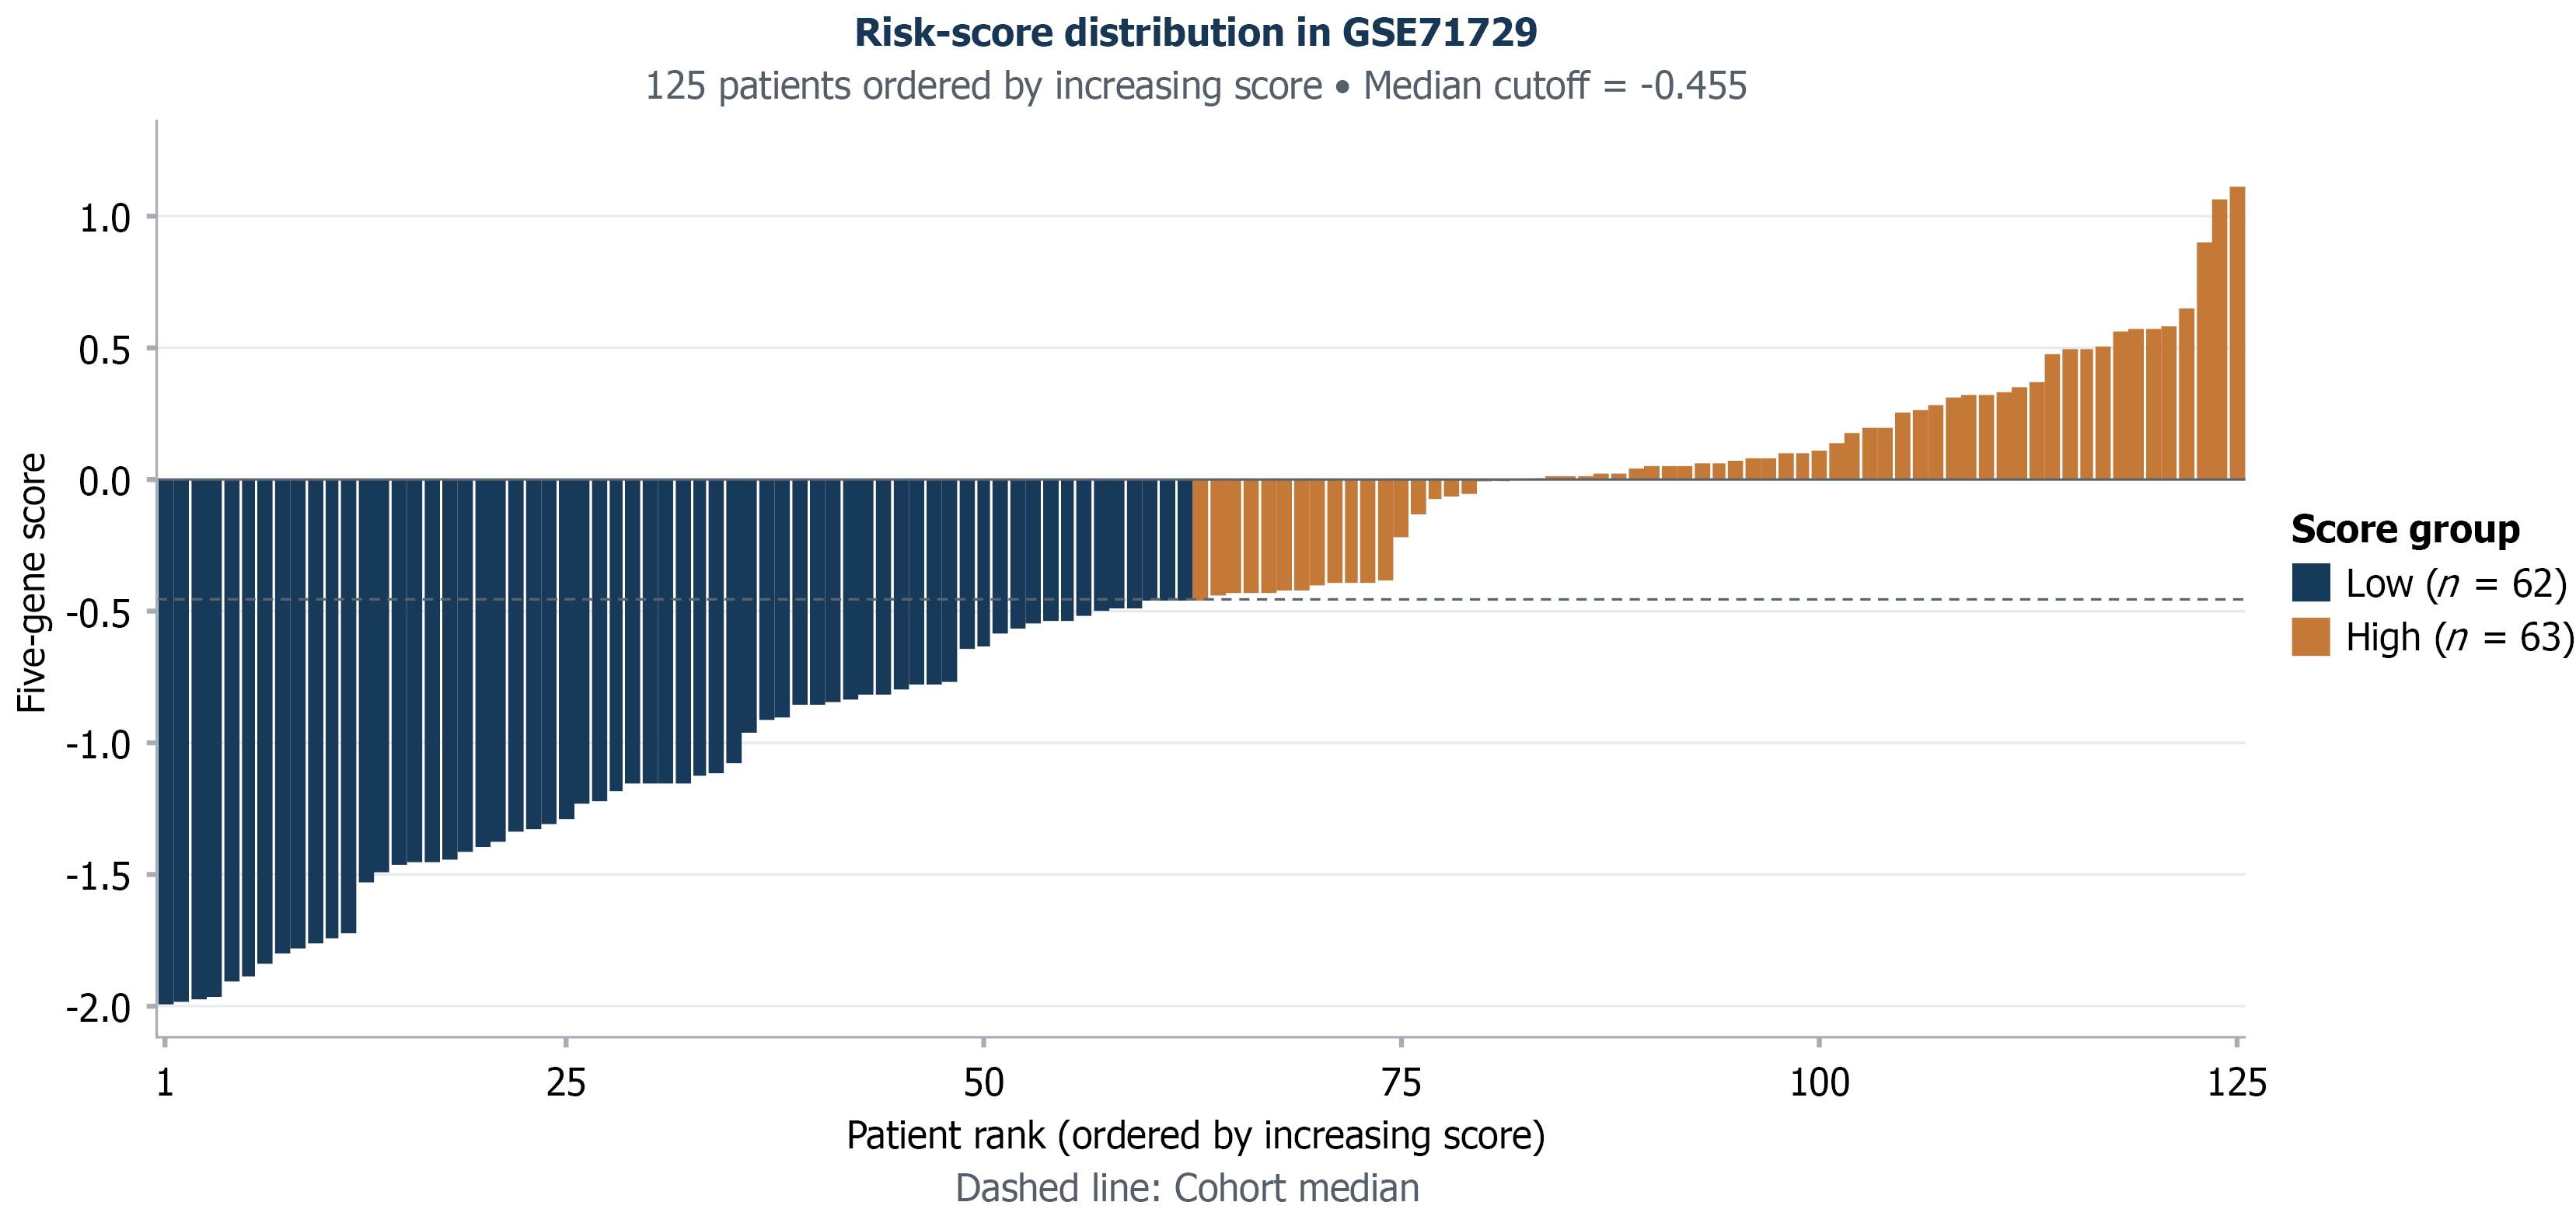
Figure 8 Distribution of the least absolute shrinkage and selection operator-derived risk score in the external GSE71729 cohort.
Patients are ranked by increasing risk score and stratified into low- and high-risk groups based on the median cut-off.
- Citation: Tarara V, Panteris E, Varlamis S, Andreadou E, Pessach I, Bobos M, Chatzidimitriou M, Mitka S, Papoutsi A, Eleftheriou P, Skepastianos P, Karamitrousis E. Prognostic biomarkers for pancreatic ductal adenocarcinoma: A contemporary systematic review and modelling study. World J Transl Med 2026; 12(4): 126295
- URL: https://www.wjgnet.com/2220-6132/full/v12/i4/126295.htm
- DOI: https://dx.doi.org/10.5528/wjtm.126295