
















Copyright: ©Author(s) 2026.
World J Transl Med. Nov 28, 2026; 12(4): 126295
Published online Nov 28, 2026. doi: 10.5528/wjtm.126295
Published online Nov 28, 2026. doi: 10.5528/wjtm.126295
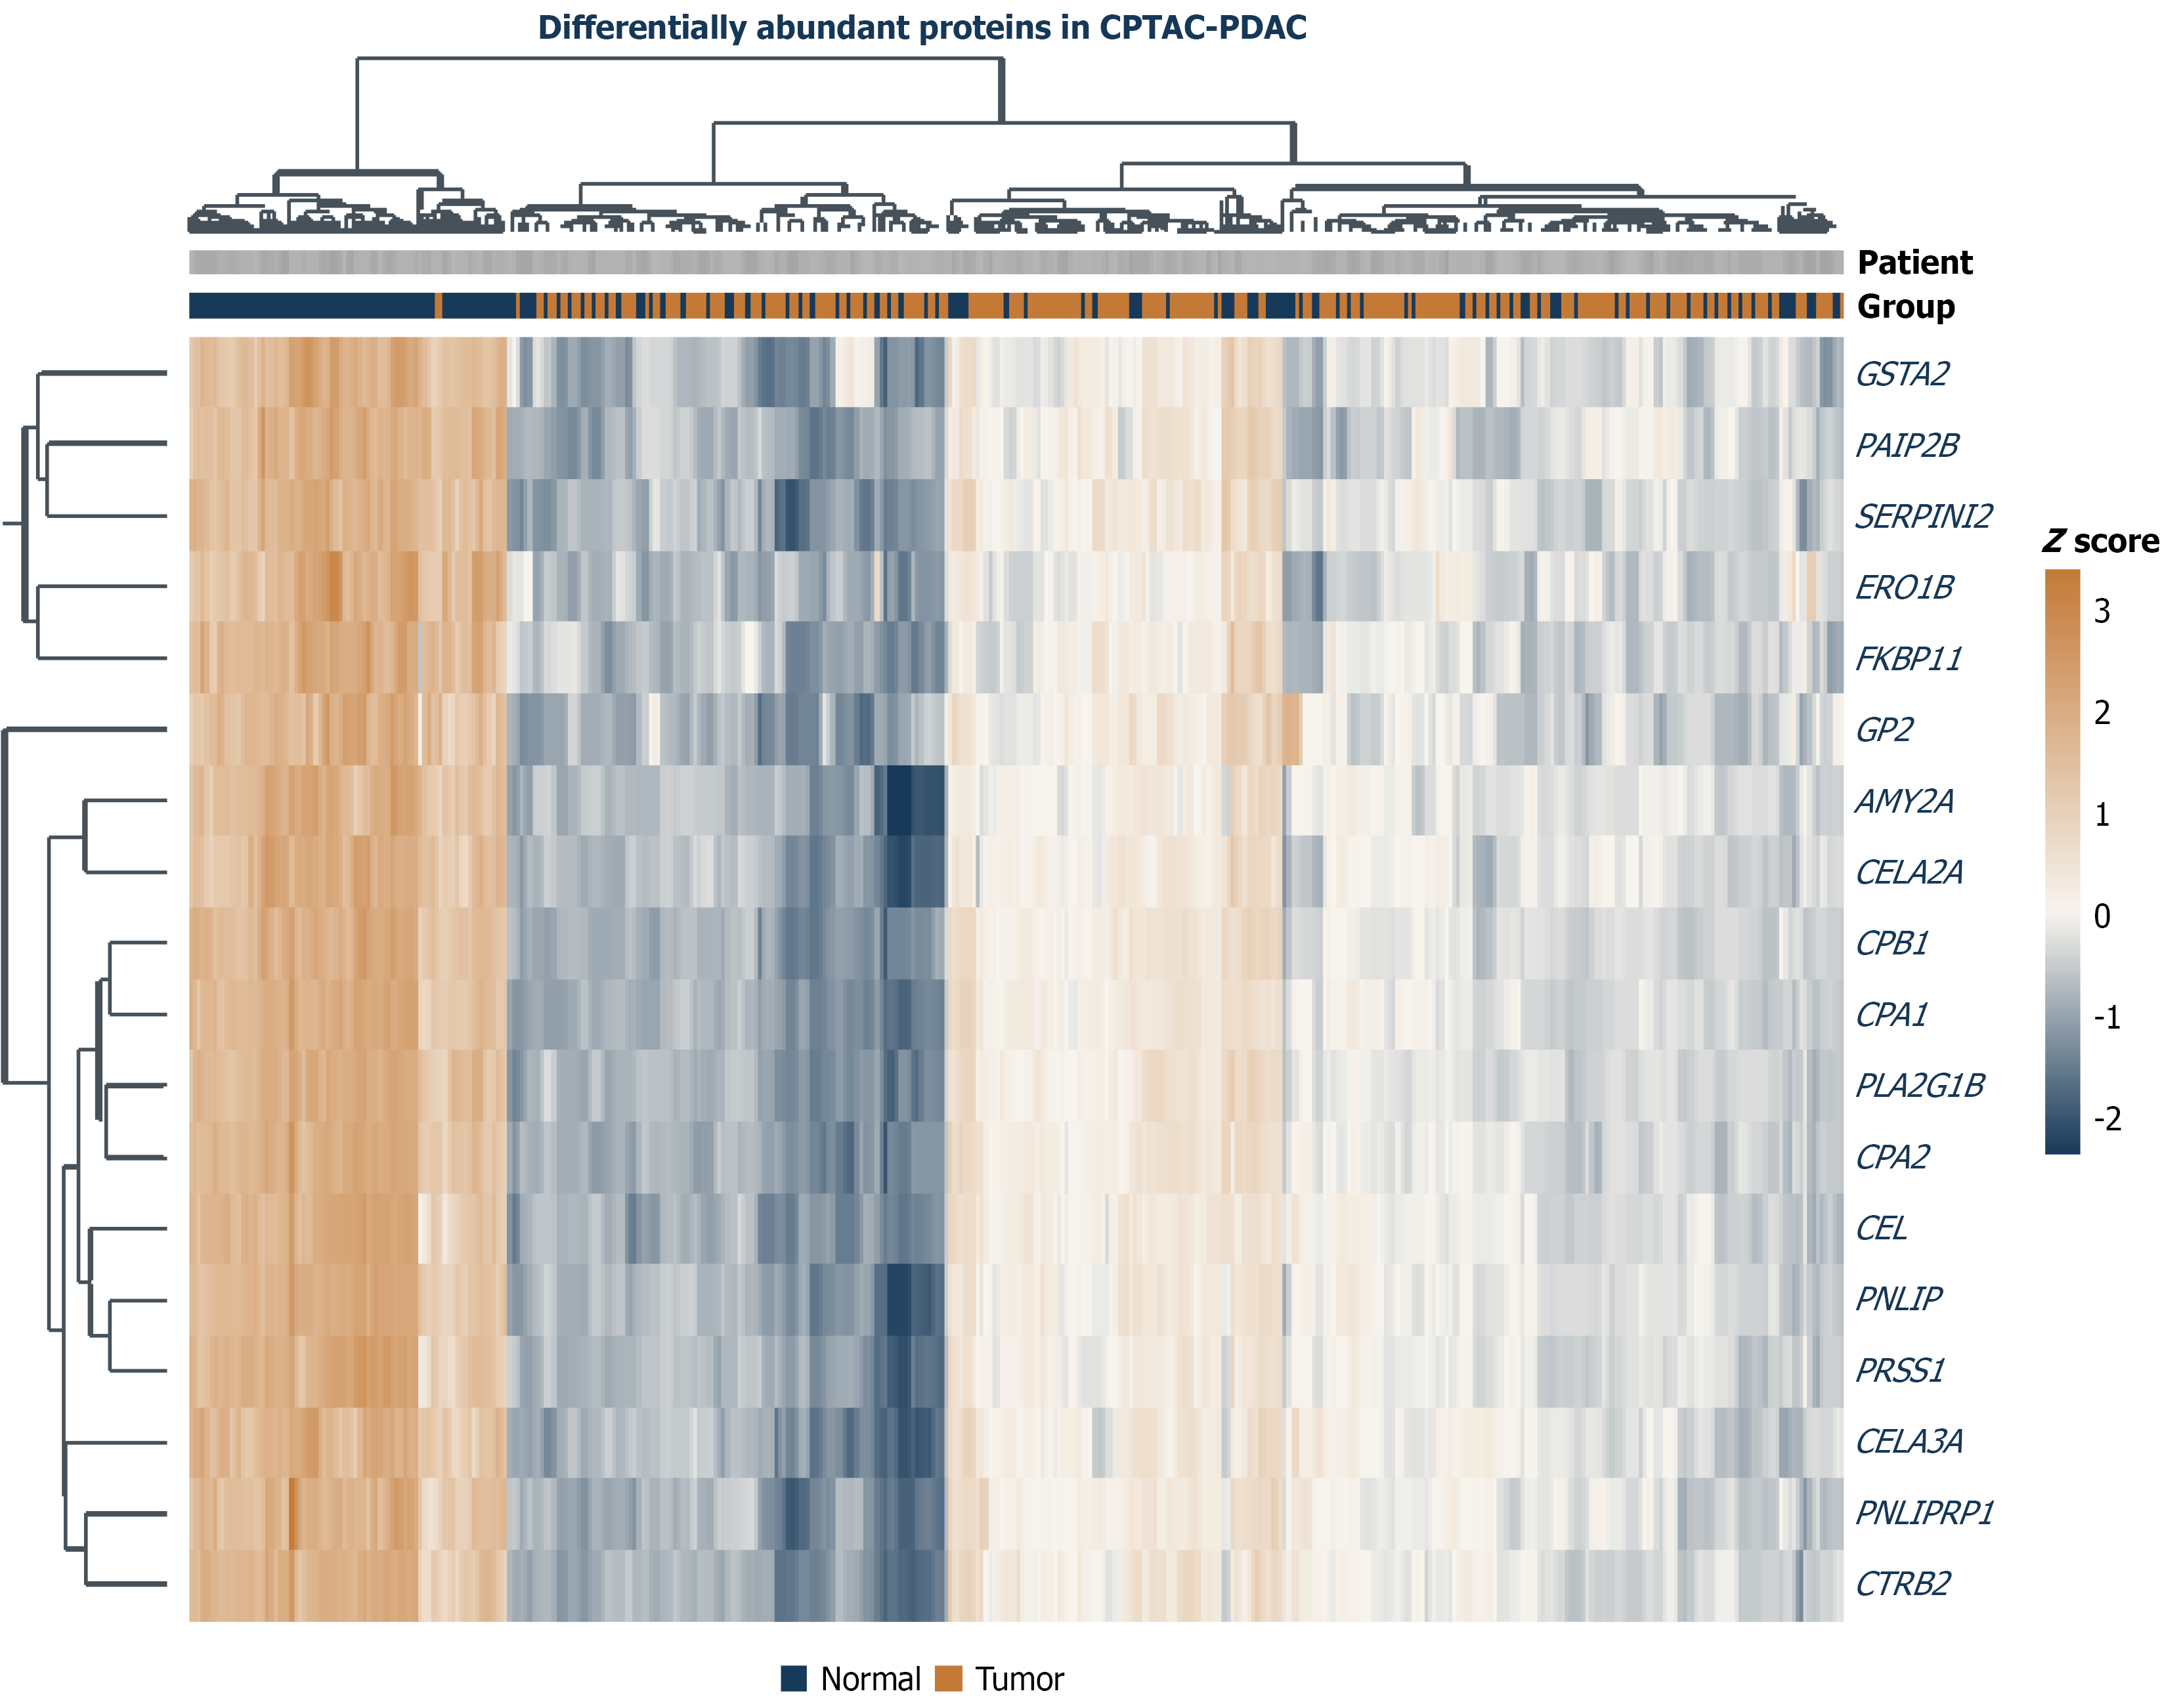
Figure 3 Heatmap of the top differentially expressed proteins identified in the Clinical Proteomic Tumor Analysis Consortium pancreatic ductal adenocarcinoma cohort.
Rows represent proteins, and columns represent individual samples. Protein expression values are displayed as row-wise standardized (z-score) expression levels, with brown indicating relatively high expression and blue indicating relatively low expression. CPTAC: Clinical Proteomic Tumor Analysis Consortium; PDAC: Pancreatic ductal adenocarcinoma.
- Citation: Tarara V, Panteris E, Varlamis S, Andreadou E, Pessach I, Bobos M, Chatzidimitriou M, Mitka S, Papoutsi A, Eleftheriou P, Skepastianos P, Karamitrousis E. Prognostic biomarkers for pancreatic ductal adenocarcinoma: A contemporary systematic review and modelling study. World J Transl Med 2026; 12(4): 126295
- URL: https://www.wjgnet.com/2220-6132/full/v12/i4/126295.htm
- DOI: https://dx.doi.org/10.5528/wjtm.126295