Copyright
©The Author(s) 2017.
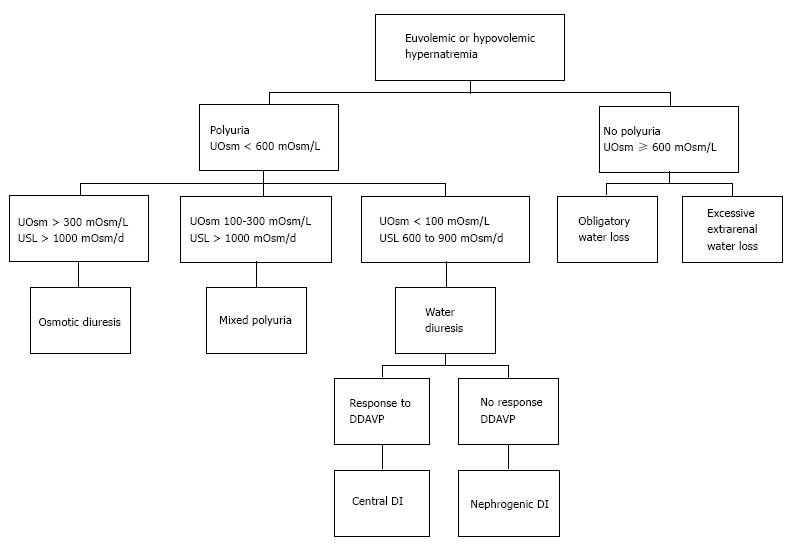
Figure 1 Diagnosis of hypovolemic and euvolemic hypernatremia.
UOsm: Urine osmolality; USL: Urine solute load; GI: Gastrointestinal; DDAVP: Desmopressin; DI: Diabetes insipidus; Osm: Osmolality.
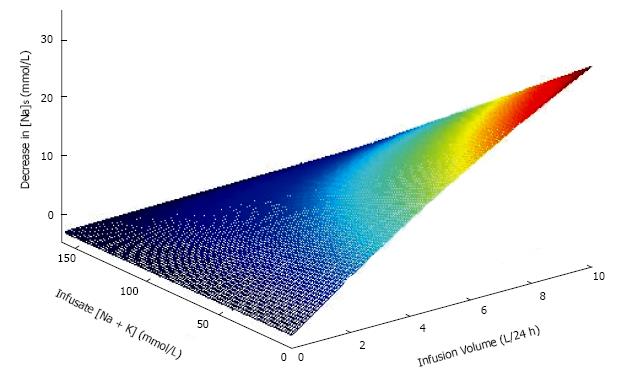
Figure 2 Effect on [Na]S of varying volumes of infusate containing varying total monovalent cation concentration (sum of sodium plus potassium concentrations) in a patient with initial body water of 40 L and [Na]S1 of 150 mmol/L.
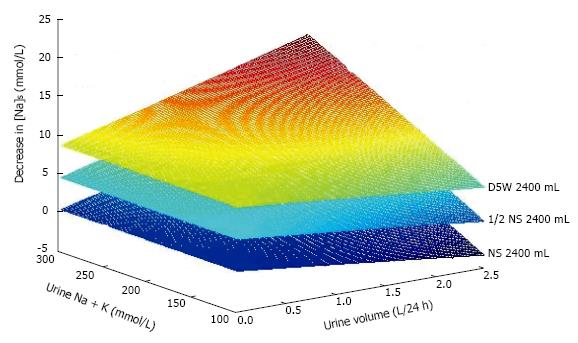
Figure 3 Effect on [Na]S of varying 24-h urinary volume containing varying total monovalent cation concentration (sum of sodium plus potassium concentrations) in a patient with initial body water of 40 L and [Na]S1 of 150 mmol/L infused with the same volume (2.
4 L) of 5% dextrose in water, or “half-normal” saline ([Na]S3 = 77 mmol/L) or “normal” saline ([Na]S3 = 154 mmol/L).
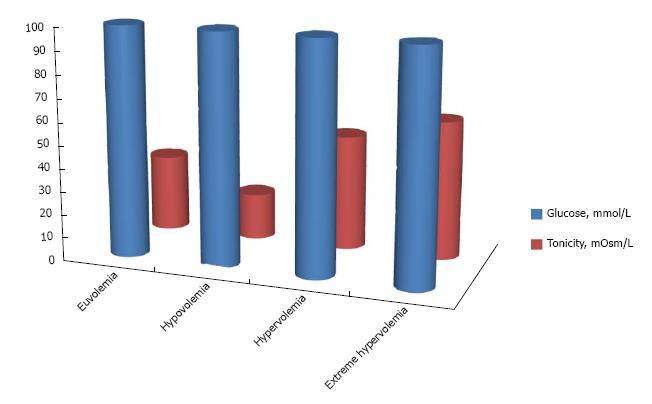
Figure 4 Increase in tonicity for the same degree of hyperglycemia (100 mmol/L) at various states of extracellular volume.
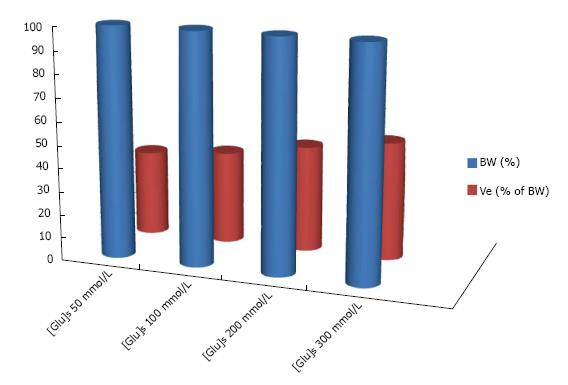
Figure 5 Increase in tonicity expressed as a percent of the increase in serum glucose concentration in progressive hyperglycemia.
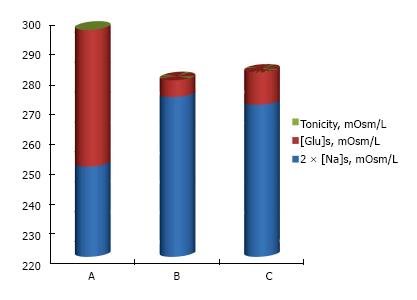
Figure 6 Mean values of [Na]S, [Glu]S and serum tonicity in hyperglycemia in patients on chronic dialysis.
The figure shows the mean values of [Na]S, [Glu]S and tonicity in 148 episodes of severe episodes of severe hyperglycemia treated only with insulin infusion[40]. A: Values recorded at presentation with hyperglycemia; B: Values predicted by the corrected [Na]S[47]; C: Values of observed [Na]S and [Glu]S and calculated tonicity at the end of treatment when [Glu]S had declined to desired levels. Tonicity was calculated as [Glu]S + 2 × [Na]S in A, B and C. The average level of tonicity after treatment predicted by the use of predicted [Na]S (B) was very close to the corresponding measured level (C).
- Citation: Rondon-Berrios H, Argyropoulos C, Ing TS, Raj DS, Malhotra D, Agaba EI, Rohrscheib M, Khitan ZJ, Murata GH, Shapiro JI, Tzamaloukas AH. Hypertonicity: Clinical entities, manifestations and treatment. World J Nephrol 2017; 6(1): 1-13
- URL: https://www.wjgnet.com/2220-6124/full/v6/i1/1.htm
- DOI: https://dx.doi.org/10.5527/wjn.v6.i1.1


