Copyright
©2016 Baishideng Publishing Group Co.
World J Nephrol. Mar 6, 2016; 5(2): 204-212
Published online Mar 6, 2016. doi: 10.5527/wjn.v5.i2.204
Published online Mar 6, 2016. doi: 10.5527/wjn.v5.i2.204
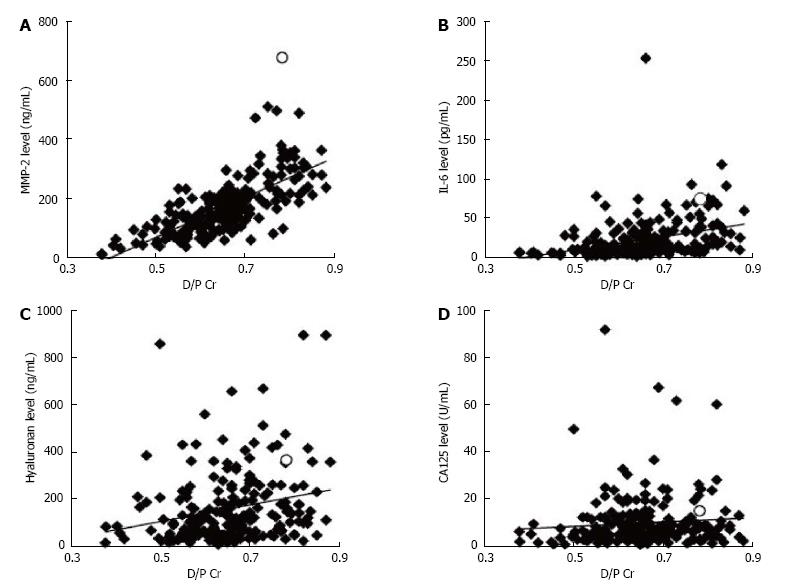
Figure 1 The relationships between peritoneal solute transport rate and effluent biomarker levels.
Peritoneal transport rate was represented by D/P Cr ratio and was compared with effluent MMP-2 level (A), effluent IL-6 level (B), effluent hyaluronan level (C) and effluent CA125 level (D). The biomarker levels of the one patient with EPS are shown by open circles. MMP-2: Matrix metalloproteinase-2; IL-6: Interleukin-6; CA125: Cancer antigen 125; Cr: Creatinine; EPS: Encapsulating peritoneal sclerosis.
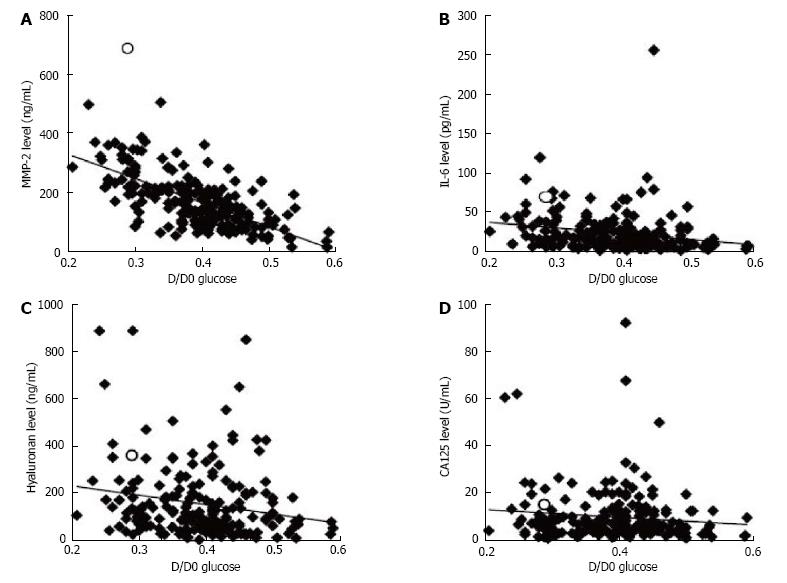
Figure 2 The relationships between D/D0 glucose and effluent biomarker levels.
The glucose absorption rate was represented by D/D0 glucose and was compared with effluent MMP-2 level (A), effluent IL-6 level (B), effluent hyaluronan level (C) and effluent CA125 level (D). The biomarker levels of the one patient with EPS are shown by open circles. MMP-2: Matrix metalloproteinase-2; IL-6: Interleukin-6; CA125: Cancer antigen 125; EPS: Encapsulating peritoneal sclerosis.
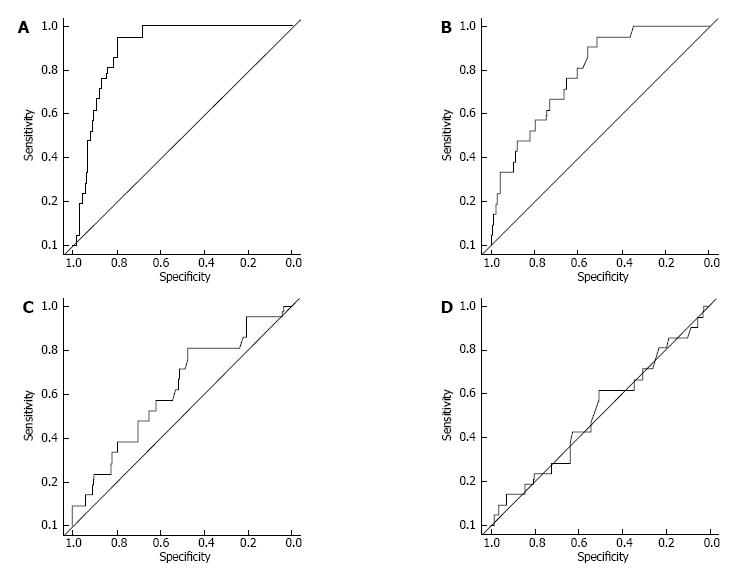
Figure 3 Receiver operating characteristic curve analysis of effluent biomarkers for the diagnosis of patients in the high category of D/P creatinine.
A: Matrix metalloproteinase-2; B: Interleukin-6; C: Hyaluronan; D: Cancer antigen 125.
- Citation: Hirahara I, Kusano E, Morishita Y, Inoue M, Akimoto T, Saito O, Muto S, Nagata D. Matrix metalloproteinase-2 as a superior biomarker for peritoneal deterioration in peritoneal dialysis. World J Nephrol 2016; 5(2): 204-212
- URL: https://www.wjgnet.com/2220-6124/full/v5/i2/204.htm
- DOI: https://dx.doi.org/10.5527/wjn.v5.i2.204


