Copyright
©2014 Baishideng Publishing Group Inc.
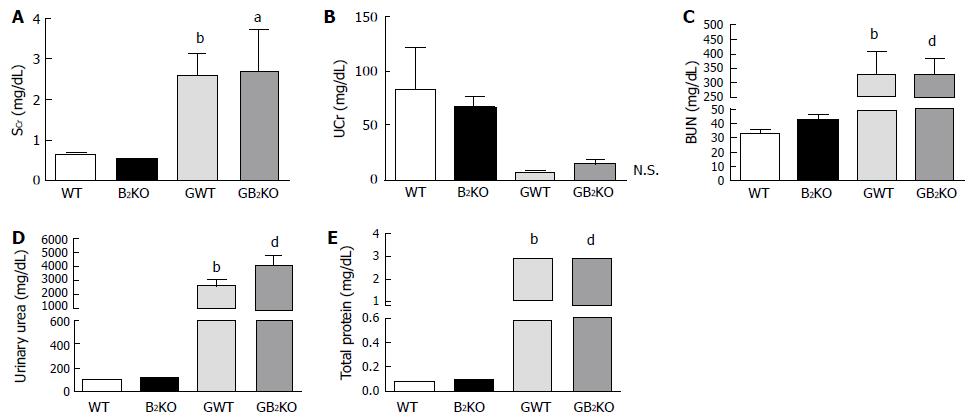
Figure 1 Serum and urinary parameters.
A: SCr levels (aP < 0.05 vs B2KO, bP < 0.01 vs WT); B: UCr levels; C: BUN levels (bP < 0.005 vs WT, dP < 0.01 vs B2KO); D: Urinary urea (bP < 0.01 vs WT, dP < 0.005 vs B2KO); E: Total urine proteins (bP < 0.005 vs WT, dP < 0.005 vs B2KO). WT: Wild type; B2KO: Kinin B2 receptor knockout mice; GWT: Glycerol wild type; B2KO: Glycerol kinin B2 receptor knockout mice; BUN: Blood urea nitrogen.
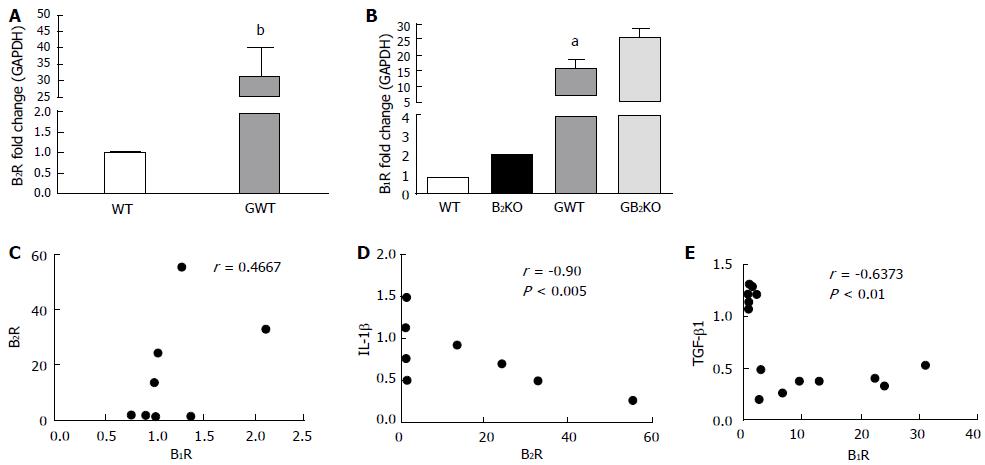
Figure 2 Renal gene expression and association between genes.
A: B2R fold change (bP < 0.01 vs WT); B: B1R fold change (aP < 0.05 vs B2KO); C: Association between B2R and B1R; D: Association between IL-1β and B1R; E: Association between TGF-β1 and B1R. WT: Wild type; B2KO: Kinin B2 receptor knockout mice; GWT: Glycerol wild type; GB2KO: Glycerol kinin B2 receptor knockout mice; BUN: Blood urea nitrogen.
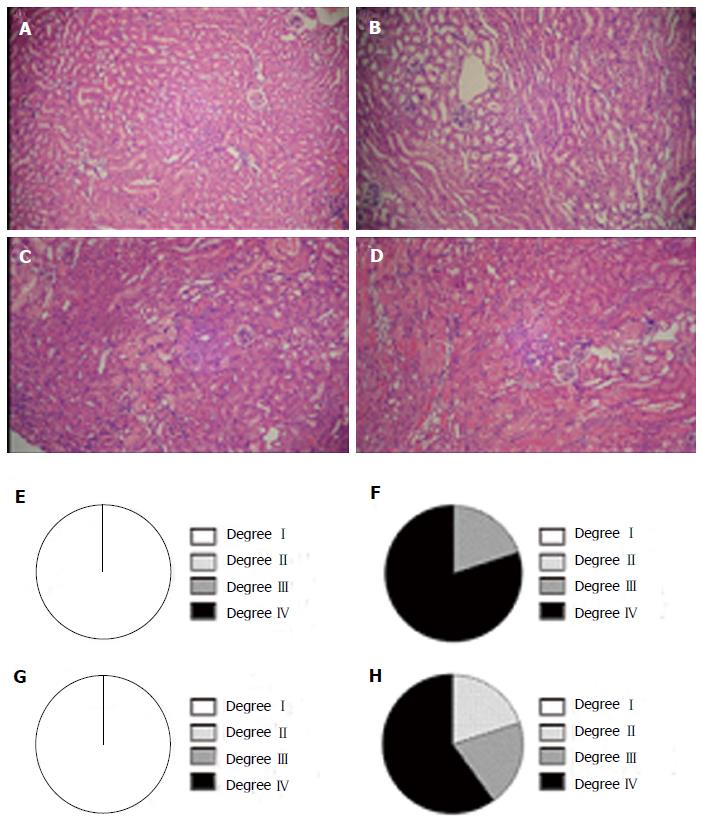
Figure 3 Histological evaluation and Graphs show the degrees of renal injury.
A: Degree I; B: Degree II; C: Degree III; D: Degree IV; E: WT; F: GWT; G: B2KO; H: GB2KO. WT: Wild type; B2KO: Kinin B2 receptor knockout mice; GWT: Glycerol wild type; GB2KO: Glycerol kinin B2 receptor knockout mice;
- Citation: Gattai PP, Mafra FFP, Wasinski F, Almeida SS, Cenedeze MA, Malheiros DMAC, Bacurau RFP, Barros CC, Câmara NOS, Araujo RC. Kinin B2 receptor does not exert renoprotective effects on mice with glycerol-induced rhabdomyolysis. World J Nephrol 2014; 3(3): 85-91
- URL: https://www.wjgnet.com/2220-6124/full/v3/i3/85.htm
- DOI: https://dx.doi.org/10.5527/wjn.v3.i3.85


