Copyright
©2014 Baishideng Publishing Group Co.
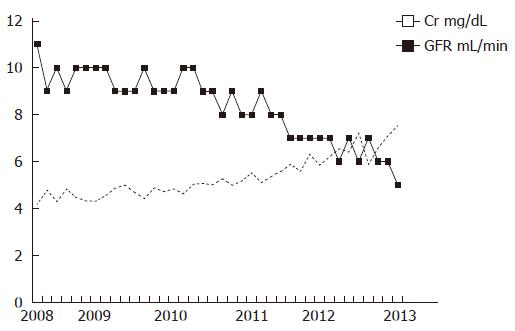
Figure 1 Serum creatinine and estimated glomerular filtration rate from patient 1 are depicted from 2008-2013.
Note slow but progressive increase in creatinine (Cr) and decrease in glomerular filtration rate (GFR).
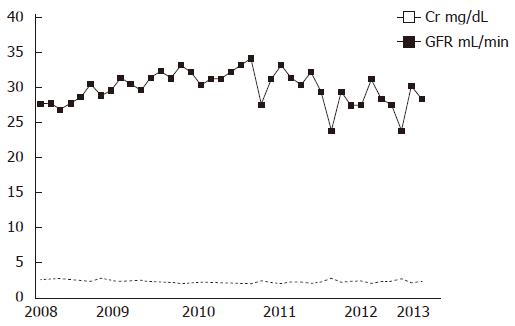
Figure 2 Elevated but essentially unchanged serum creatinin around 2.
5 mg/dL yearly from 2008-2013, while estimated glomerular filtration ratevaried between 25 and 35 mL/min throughout the period from 2008-2013. Cr: Creatinine; GFR: Glomerular filtration rate.
- Citation: Mandal AK. Frequent office visits of patients with chronic kidney disease: Is a prelude to prevention of dialysis. World J Nephrol 2014; 3(1): 1-5
- URL: https://www.wjgnet.com/2220-6124/full/v3/i1/1.htm
- DOI: https://dx.doi.org/10.5527/wjn.v3.i1.1


