Copyright
©2014 Baishideng Publishing Group Inc.
World J Transplant. Sep 24, 2014; 4(3): 153-167
Published online Sep 24, 2014. doi: 10.5500/wjt.v4.i3.153
Published online Sep 24, 2014. doi: 10.5500/wjt.v4.i3.153
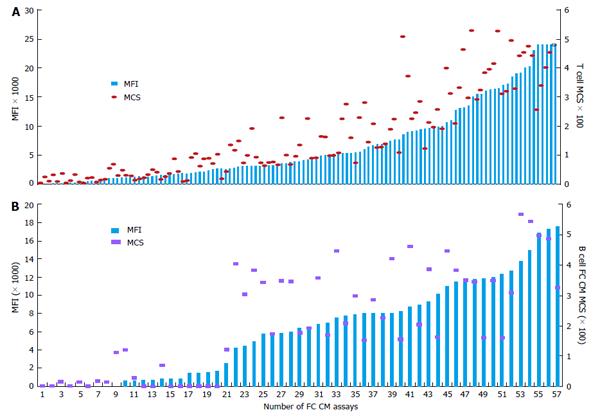
Figure 1 Concordance of mean fluorescence intensity values of monospecific anti-human leukocyte antigen class I (A) and class II (B) antibodies and results of flow cytometry cross match assay.
Left Y axis indicates MFI values of antibodies, right Y axis indicates MCS for T- and B-cells FC CM assay, respectively. Blue bars indicate class I and class II MFI values, respectively; red circles and purple squares indicate MCS values of each FC CM test for T and B lymphocytes, respectively. MCS: Median channel shift; MFI: Mean fluorescence intensity; FC: Flow cytometry; CM: Cross match.
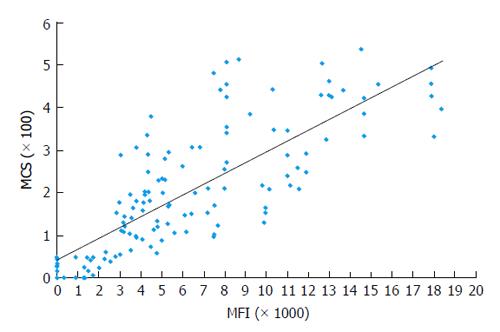
Figure 2 Correlation analysis between mean fluorescence intensity of anti-human leukocyte antigen class I antibodies and T cell flow cytometry cross match median channel shift.
Each blue diamond represents a single test. MCS: Median channel shift; MFI: Mean fluorescence intensity.
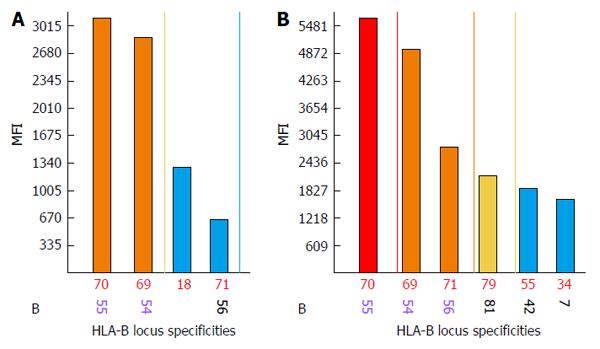
Figure 3 High affinity antibodies against denatured human leukocyte antigen-B55 and human leukocyte antigen-B54 proteins.
A: Acid untreated sample; B: Acid treated sample; Y axis indicates MFI values of the antibodies; X axis indicates HLA-B locus specific antibodies. Colored bars represent MFI values of different intensity: Blue 500-2000, yellow 2001-3000, brown 3001-5000, and red > 5000. HLA: Human leukocyte antigen; MFI: Mean fluorescence intensity.
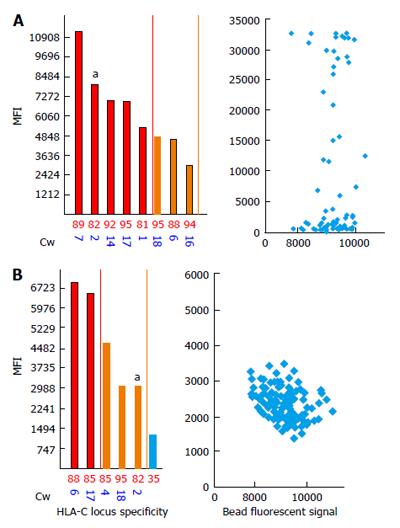
Figure 4 Uneven bead (bead #82) distribution results in falsely positive reactivity of antibodies to human leukocyte antigen-C2.
aAnti-HLA-C2 antibodies MFI values in original (A) and repeated (B) samples, respectively. Left panels in figure A and B represent HLA-C locus specific antibody analysis, whereas right panels represent beads distribution on the basis of their fluorescence and MFI values produced by bound antibodies. Colored bars represent MFI values of different intensity: Blue 500-2000, yellow 2001-3000, brown 3001-5000, and red > 5000. Blue diamonds represent beads coated with HLA-C2 proteins. HLA: Human leukocyte antigen; MFI: Mean fluorescence intensity.
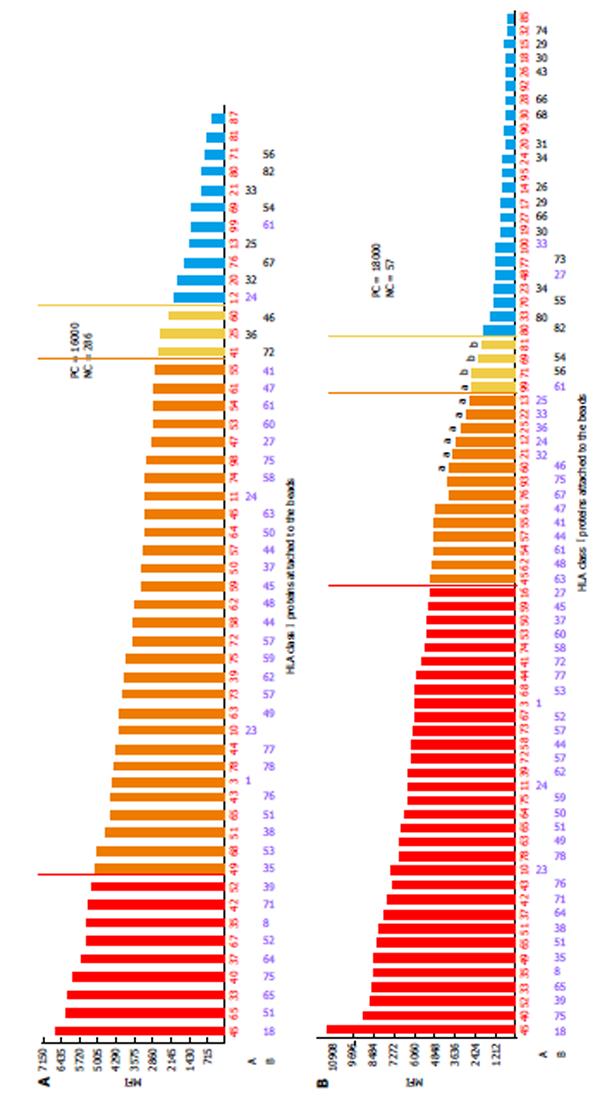
Figure 5 Anti-Class I antibodies detected in unabsorbed (A) and absorbed (B) serum samples.
The numbers on the right indicate control values before and after absorption; aAdditional antibody specificities with MFI ≥ 2600; bAdditional antibody specificities with MFI = 1500-2600; HLA: Human leukocyte antigen; MFI: Mean fluorescence intensity; NC: Negative control MFI values; PC: Positive control MFI values; Y axis indicates MFI values; X axis indicates bead number and HLA-A and -B loci specificities. Colored bars represent MFI values of different intensity: Blue 500-2000, yellow 2001-3000, brown 3001-5000, and red > 5000.
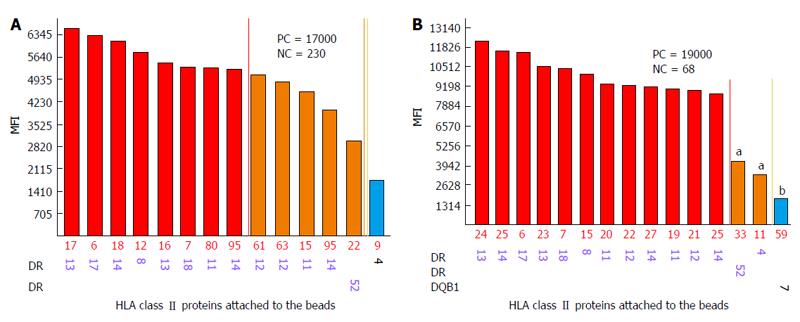
Figure 6 Anti-Class II antibodies detected in unabsorbed (A) and absorbed (B) serum samples.
The numbers on the right indicate control values before and after absorption; aAdditional antibody specificities with MFI ≥ 3100; bAdditional antibody specificities with MFI = 1500-3100; MFI: Mean fluorescence intensity; NC: Negative control MFI values; PC: Positive control MFI values; Y axis indicates MFI value, X axis indicates bead number and HLA-A and -B loci specificities. Colored bars represent MFI values of different intensity: Blue 2001-3000, brown 3001-5000, and red > 5000.
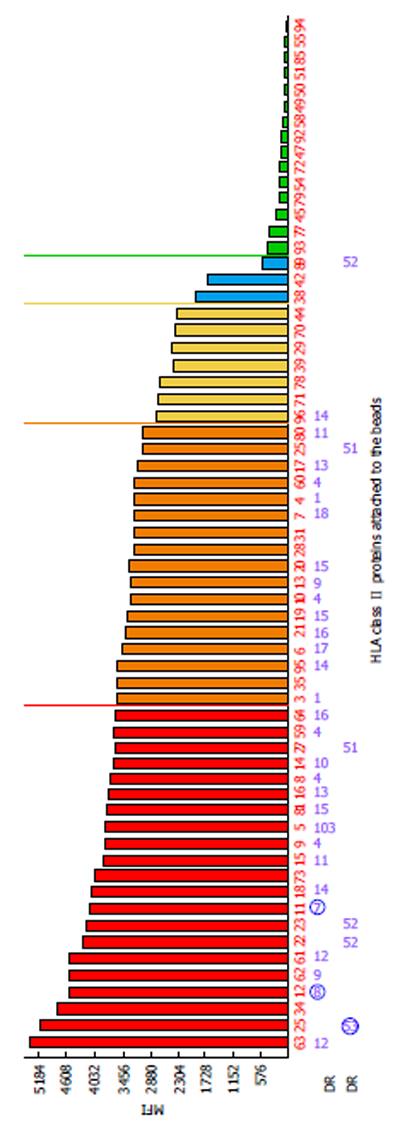
Figure 7 Pan-reactive anti-human leukocyte antigen-DRB1 antibodies detected in kidney transplant candidate serum.
Y axis indicates MFI values, X axis indicate beads number and HLA-DR specificities; HLA-DR specificities in the blue circles are self. Colored bars represent MFI values of different intensity: Green < 500; blue 501-2000; yellow 2001-3000; brown 3001-3500; red > 3500. HLA: Human leukocyte antigen; MFI: Mean fluorescence intensity.
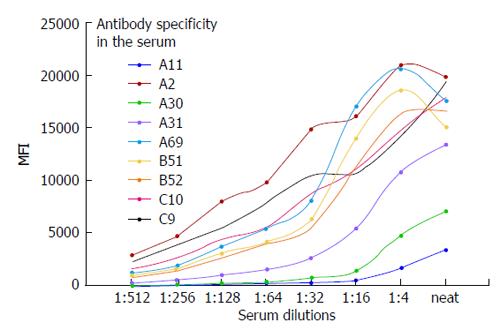
Figure 8 Phenomenon of class I bead oversaturation with antibodies.
Y axis indicates MFI values, X axis indicates serum dilution. Ten percent fetal bovine serum in roswell park memorial institute medium was used as diluents. MFI: Mean fluorescence intensity.
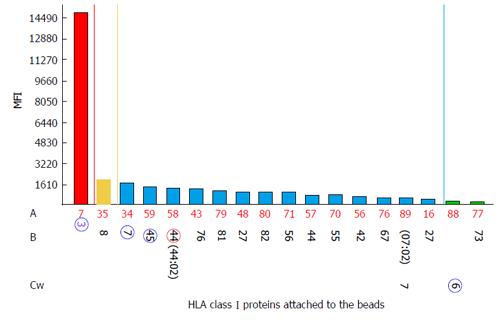
Figure 9 Anti-Class I antibodies detected in the serum of kidney transplant candidate C.
The numbers in blue circles indicate HLA specificities mismatched with the 1st donor. The number in red circle indicates HLA specificity mismatched with the current donor; the numbers in parenthesis indicate allelic assignment of HLA. Y axis indicates MFI values, X axis indicates bead number and HLA-A and -B loci specificities. Colored bars represent MFI values of different intensity: Green < 500; blue 501-1600; brown 1601-2500; red > 2500. HLA: Human leukocyte antigen; MFI: Mean fluorescence intensity.
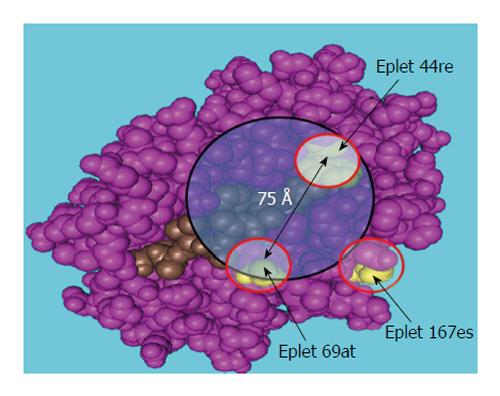
Figure 10 Three dimensional map of mismatched and shared eplets.
Alpha chain domains are in purple; peptide in the antigen presenting groove is in brown color; eplets are in yellow; black transparent circle specifies the patch comprising two eplets.
- Citation: Lobashevsky AL. Methodological aspects of anti-human leukocyte antigen antibody analysis in solid organ transplantation. World J Transplant 2014; 4(3): 153-167
- URL: https://www.wjgnet.com/2220-3230/full/v4/i3/153.htm
- DOI: https://dx.doi.org/10.5500/wjt.v4.i3.153


