Copyright
©2014 Baishideng Publishing Group Inc.
World J Transplant. Sep 24, 2014; 4(3): 153-167
Published online Sep 24, 2014. doi: 10.5500/wjt.v4.i3.153
Published online Sep 24, 2014. doi: 10.5500/wjt.v4.i3.153
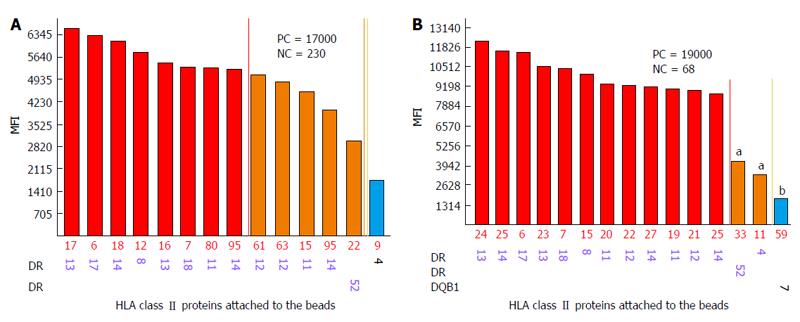
Figure 6 Anti-Class II antibodies detected in unabsorbed (A) and absorbed (B) serum samples.
The numbers on the right indicate control values before and after absorption; aAdditional antibody specificities with MFI ≥ 3100; bAdditional antibody specificities with MFI = 1500-3100; MFI: Mean fluorescence intensity; NC: Negative control MFI values; PC: Positive control MFI values; Y axis indicates MFI value, X axis indicates bead number and HLA-A and -B loci specificities. Colored bars represent MFI values of different intensity: Blue 2001-3000, brown 3001-5000, and red > 5000.
- Citation: Lobashevsky AL. Methodological aspects of anti-human leukocyte antigen antibody analysis in solid organ transplantation. World J Transplant 2014; 4(3): 153-167
- URL: https://www.wjgnet.com/2220-3230/full/v4/i3/153.htm
- DOI: https://dx.doi.org/10.5500/wjt.v4.i3.153


