
















Copyright: ©Author(s) 2026.
World J Transplant. Sep 18, 2026; 16(3): 122485
Published online Sep 18, 2026. doi: 10.5500/wjt.122485
Published online Sep 18, 2026. doi: 10.5500/wjt.122485
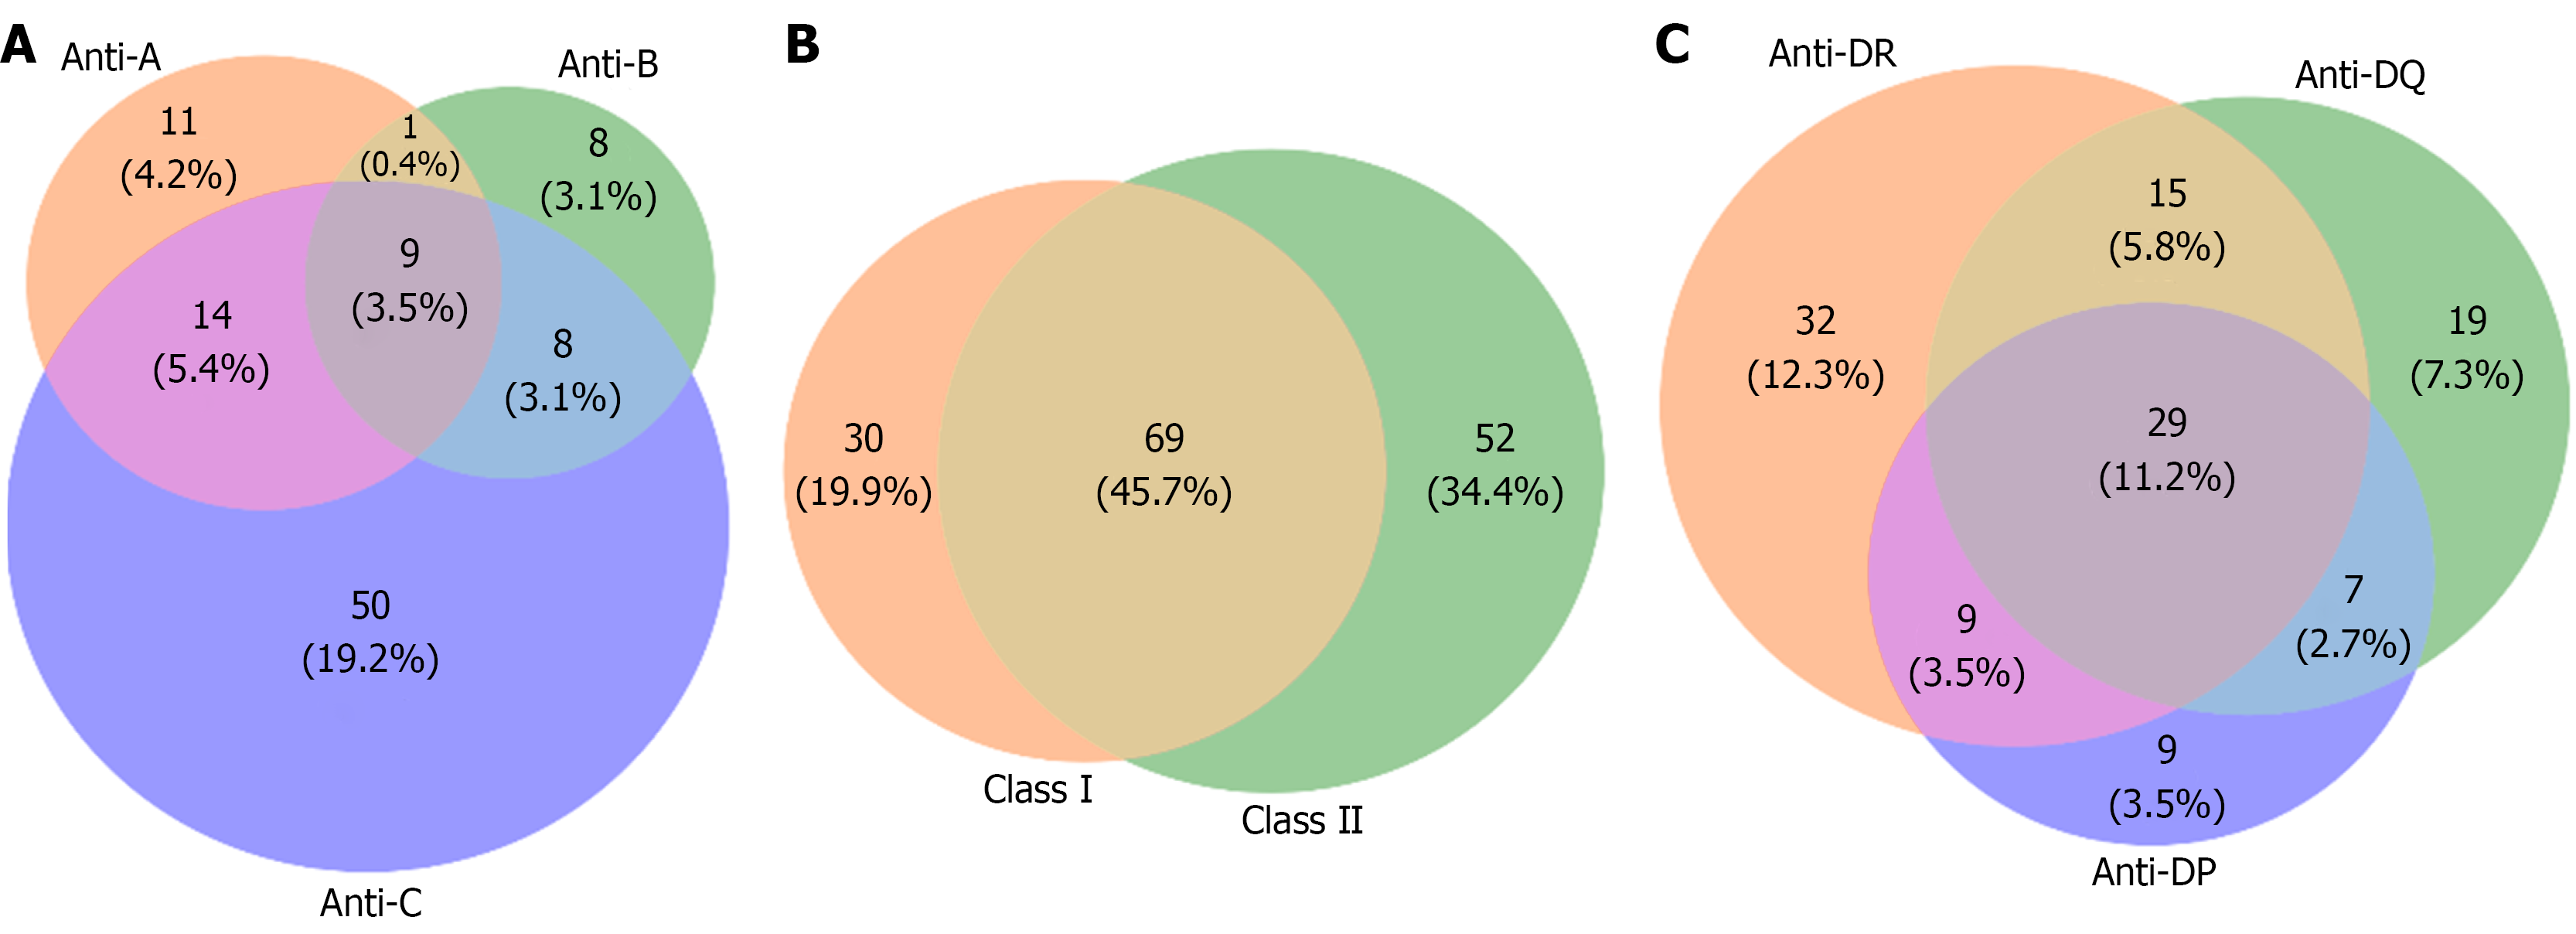
Figure 1 Venn diagrams illustrating the prevalence and overlap of donor-specific antibodies.
A: Distribution of anti-human leukocyte antigen (HLA)-A, -B, and -C antibodies (class I); B: Overlap between Class I and Class II antibodies; C: Distribution of anti-HLA-DR, -DQ, and -DP antibodies (Class II).
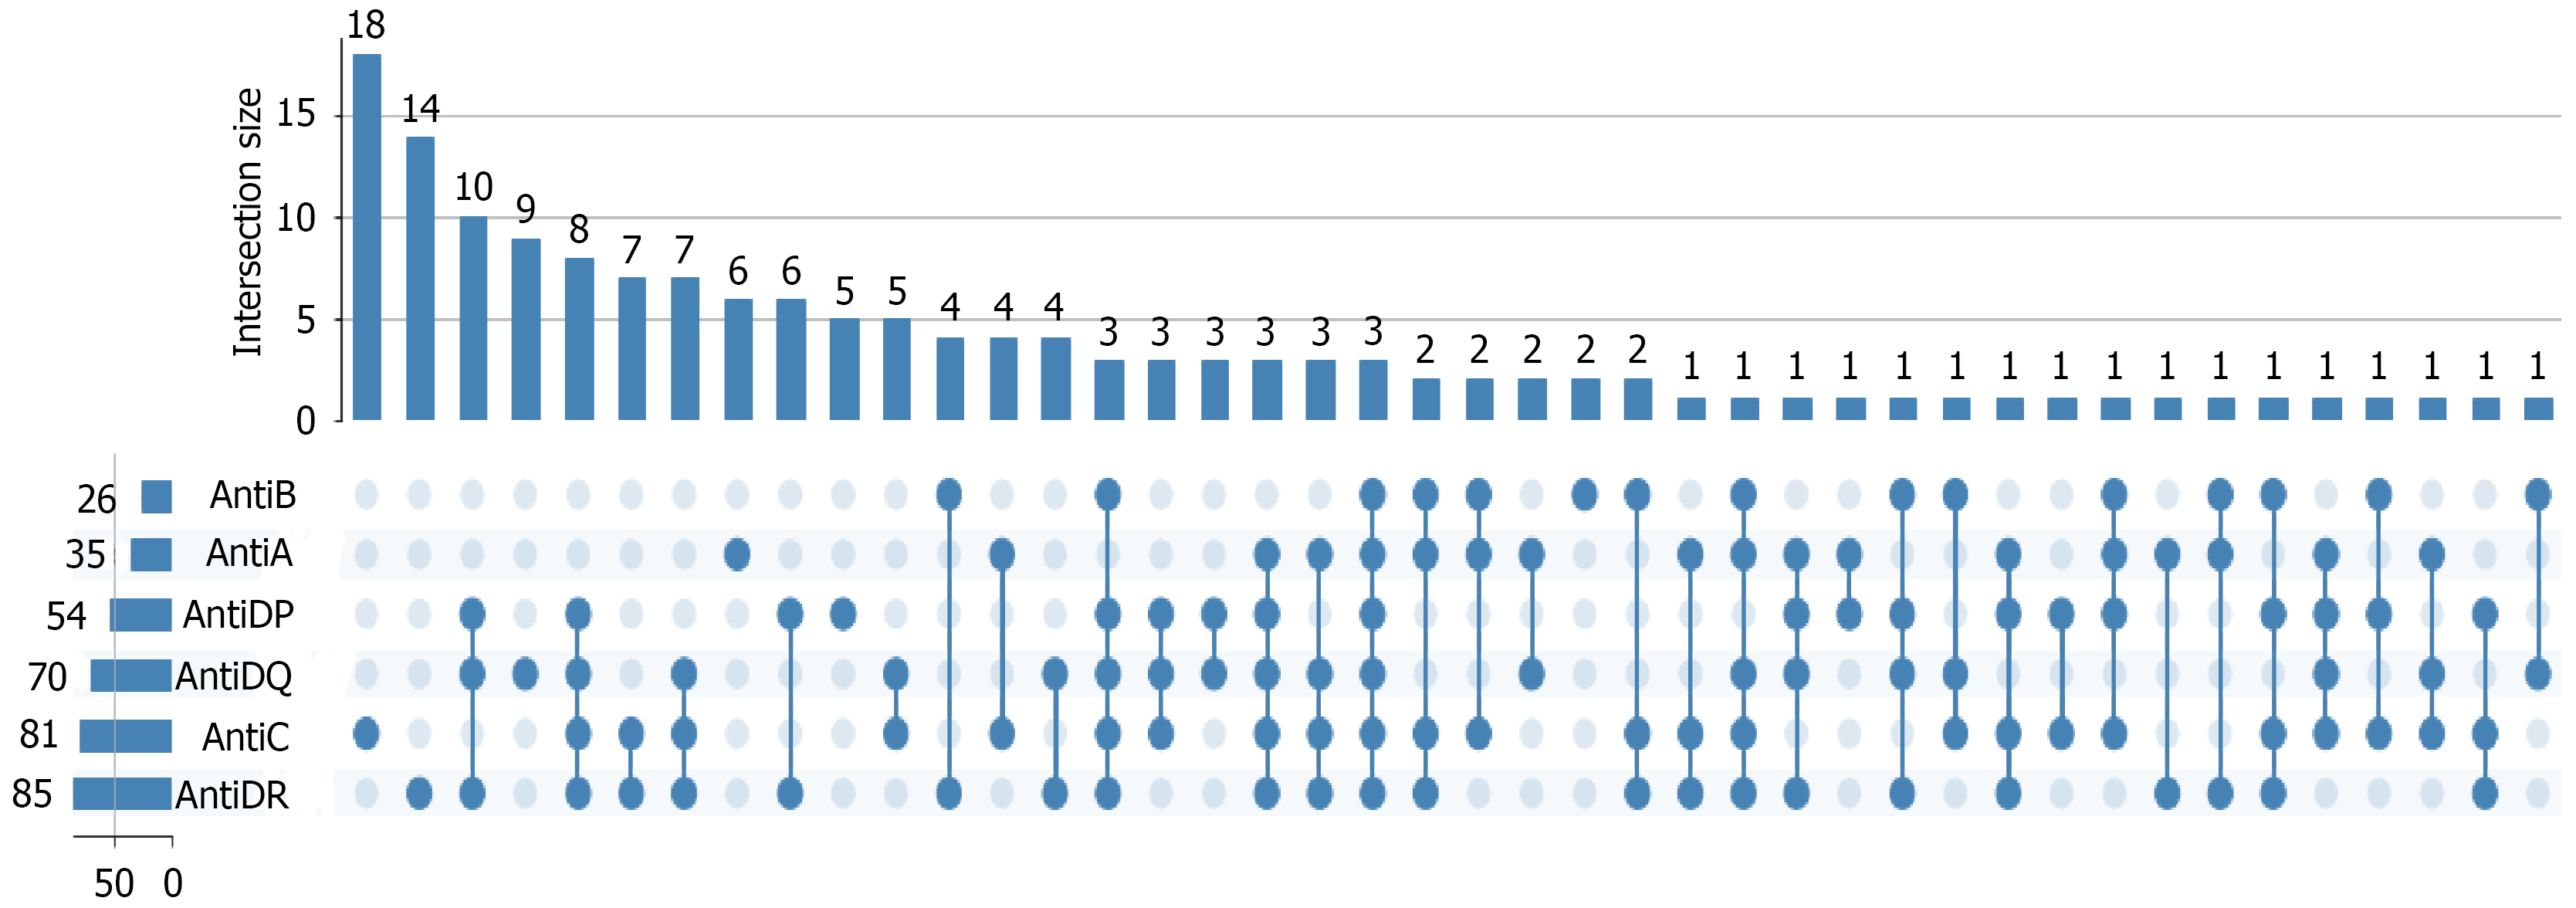
Figure 2 UpSet plot showing the distribution of pretransplant human leukocyte antigen antibody class combinations (human leukocyte antigen-A, -B, -C, -DR, -DQ, -DP) among kidney transplant candidates.
Each vertical bar quantifies the number of patients with a specific antibody combination.
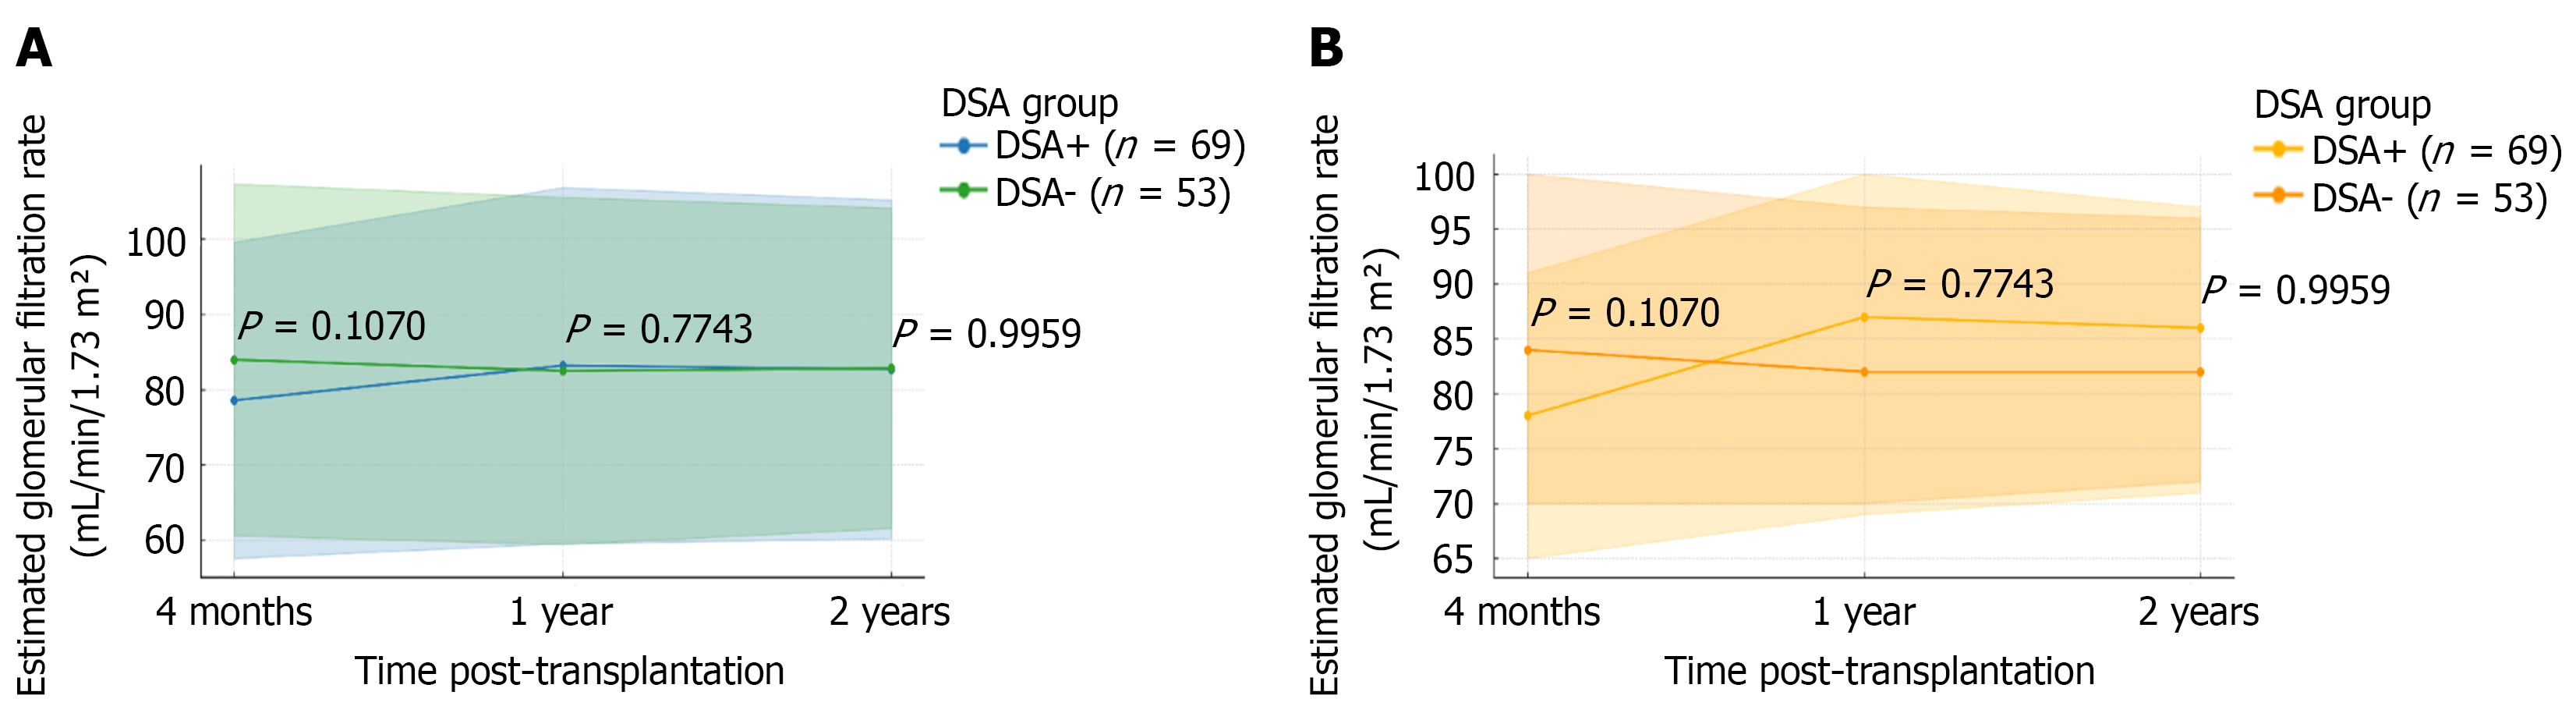
Figure 3 Longitudinal trends in estimated glomerular filtration rate by donor-specific antibodies status.
A: Medians with interquartile ranges; B: Means with standard deviations. Measurements were obtained at 4 months, 1 year, and 2 years post-transplant. DSA: Donor-specific antibodies.
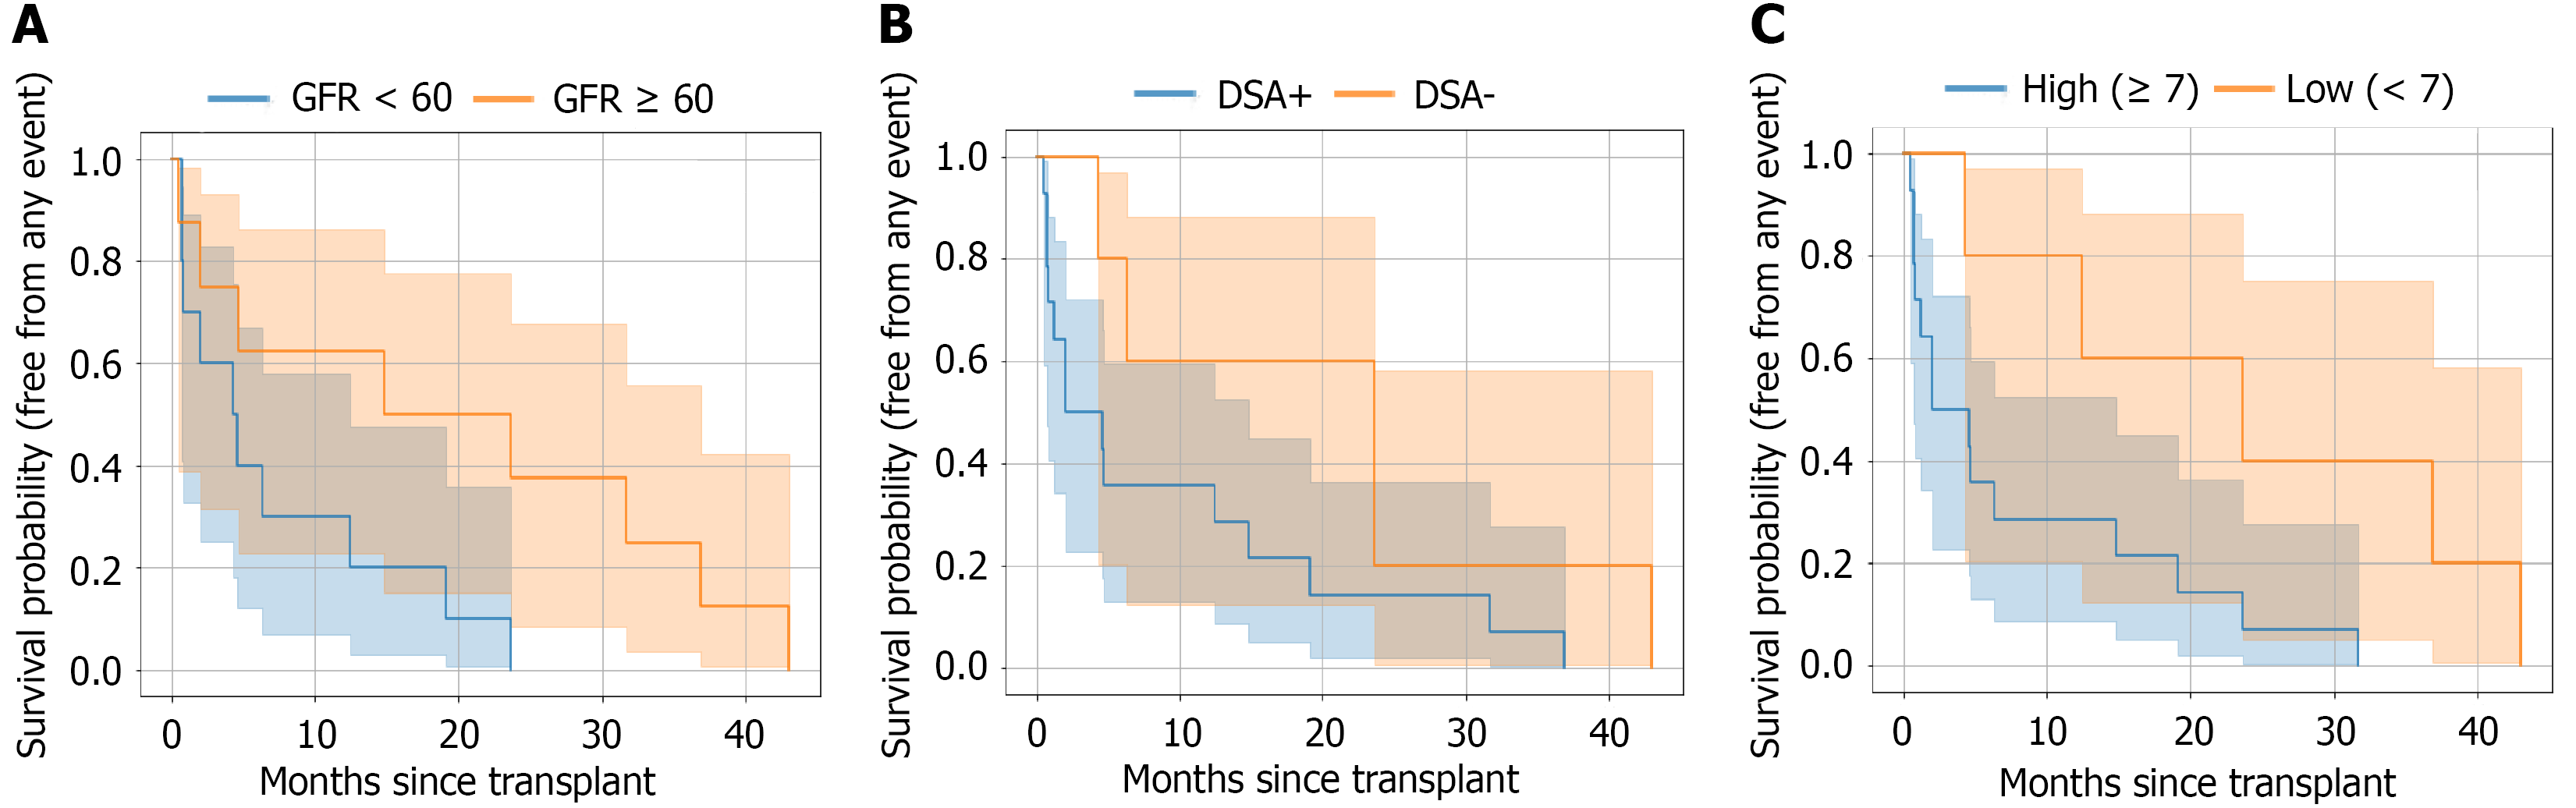
Figure 4 Kaplan-Meier survival analysis of post-transplant outcomes.
Patients with ≥ 7 human leukocyte antigen mismatches had worse composite event-free survival. No statistically significant survival differences were observed by donor-specific antibodies (DSA) status, although DSA-positive patients showed numerically lower survival. DSA: Donor-specific antibodies; GFR: Glomerular filtration rate.
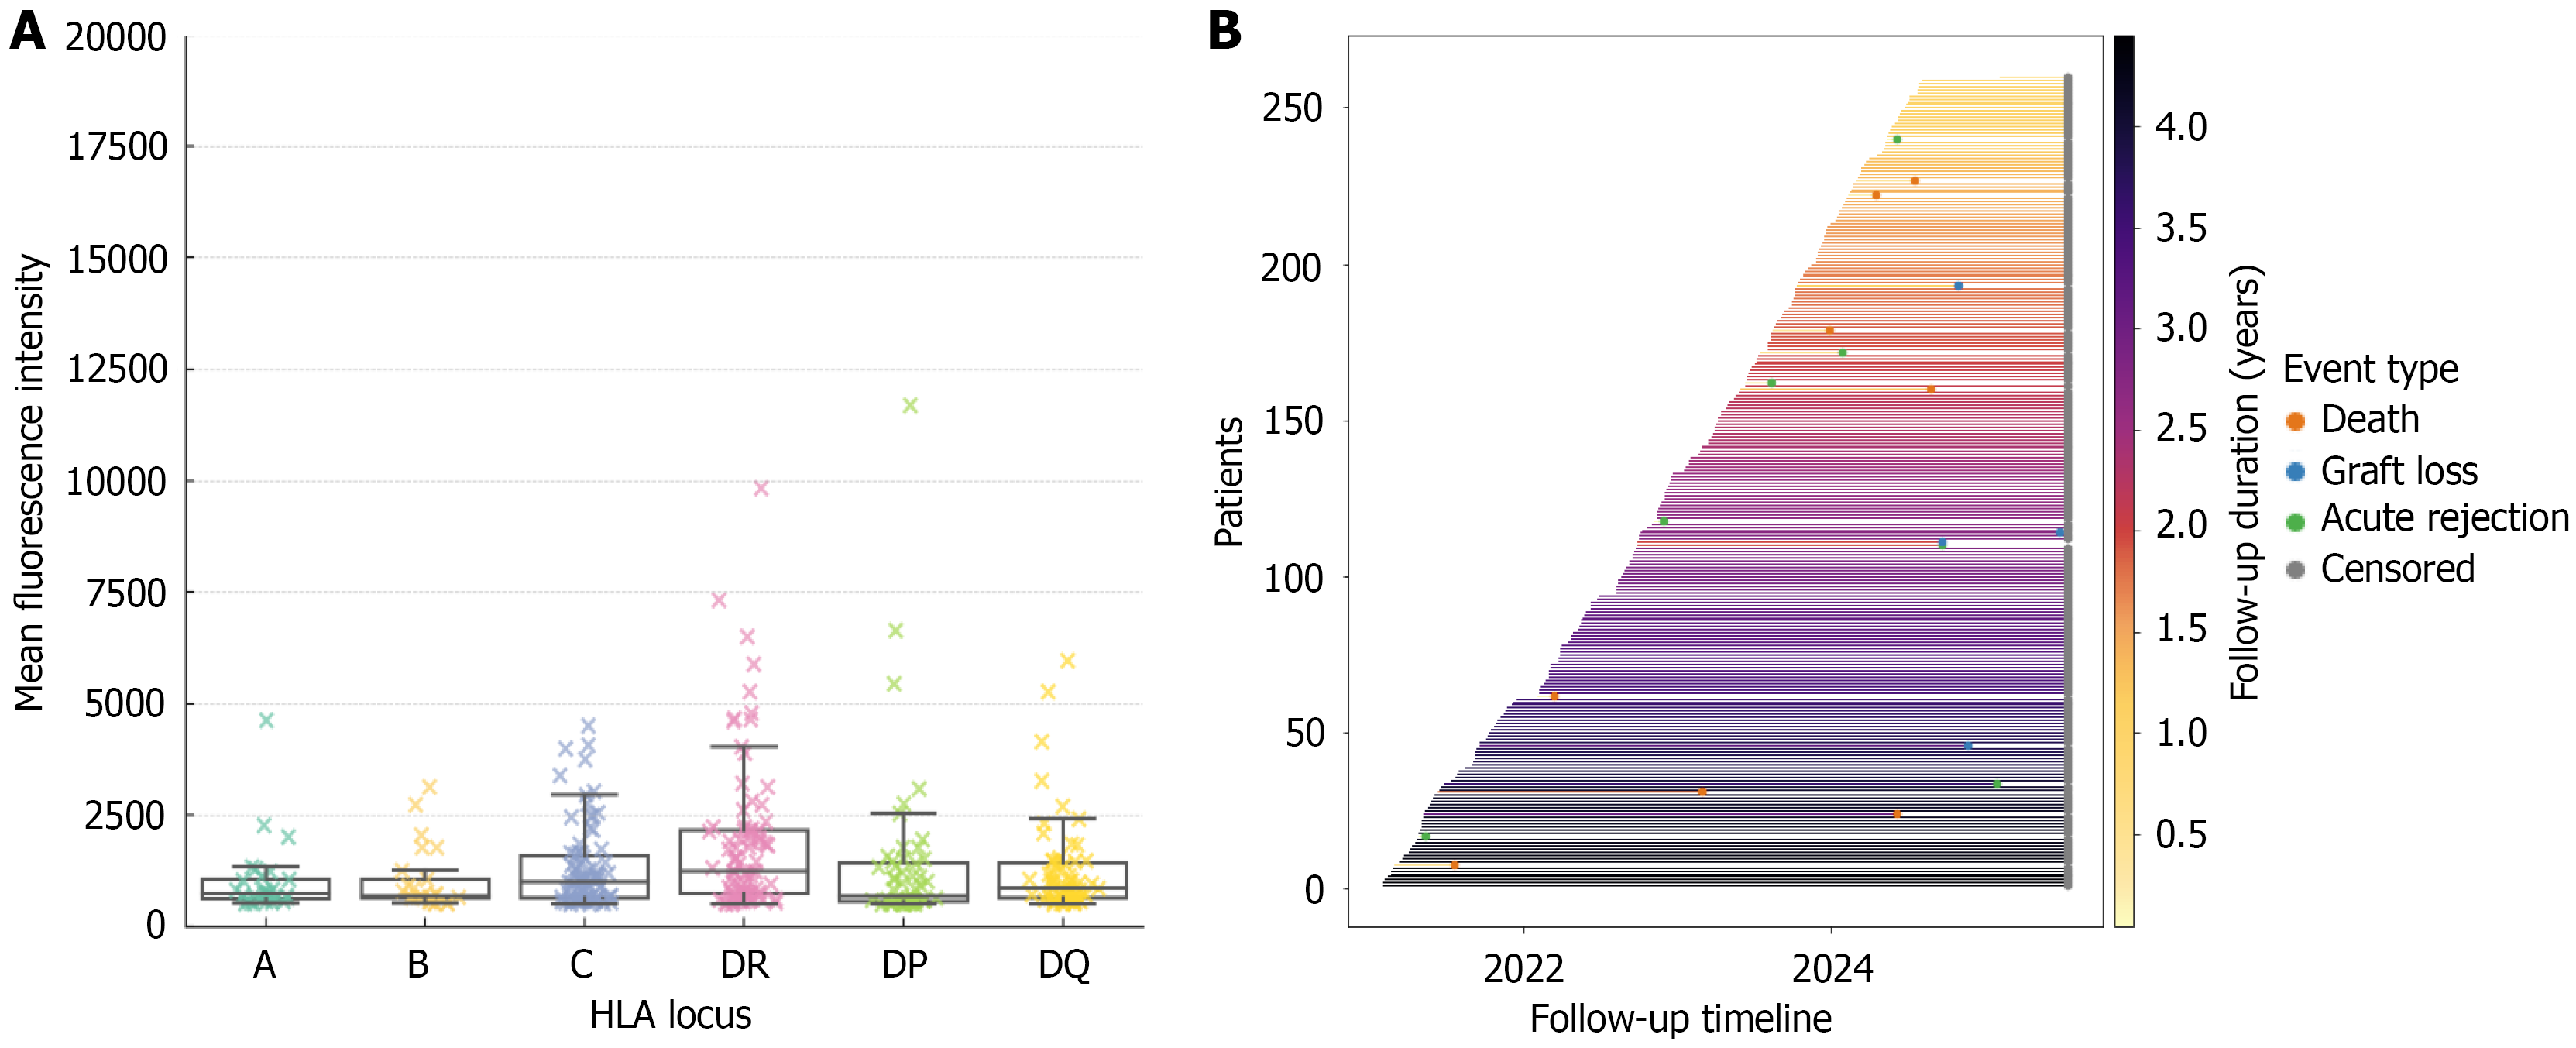
Figure 5 Distribution of pretransplant donor-specific antibodies mean fluorescence intensity across human leukocyte antigen loci (A, B, C, DR, DQ, DP) and patient follow-up timeline.
A: Box plots show locus-specific mean fluorescence intensity values; B: Horizontal timeline plot illustrates individual follow-up duration and outcomes, with markers for death, graft loss, acute rejection, and censoring. HLA: Human leukocyte antigen.
- Citation: Al-Qurashi SH, Khalil MAM, Mahmood HHK, Altom AA, Alqurashi YF, Alsaedi ZA, Cruz AJD, Alsharif MM, Bawayan RM, Housawi AA, Sadagah NM. Impact of pretransplant donor-specific antibodies and human leukocyte antigen mismatches on graft and patient outcomes: A cohort from Saudi Arabia. World J Transplant 2026; 16(3): 122485
- URL: https://www.wjgnet.com/2220-3230/full/v16/i3/122485.htm
- DOI: https://dx.doi.org/10.5500/wjt.122485