
















Copyright: ©Author(s) 2026.
World J Transplant. Sep 18, 2026; 16(3): 122485
Published online Sep 18, 2026. doi: 10.5500/wjt.122485
Published online Sep 18, 2026. doi: 10.5500/wjt.122485
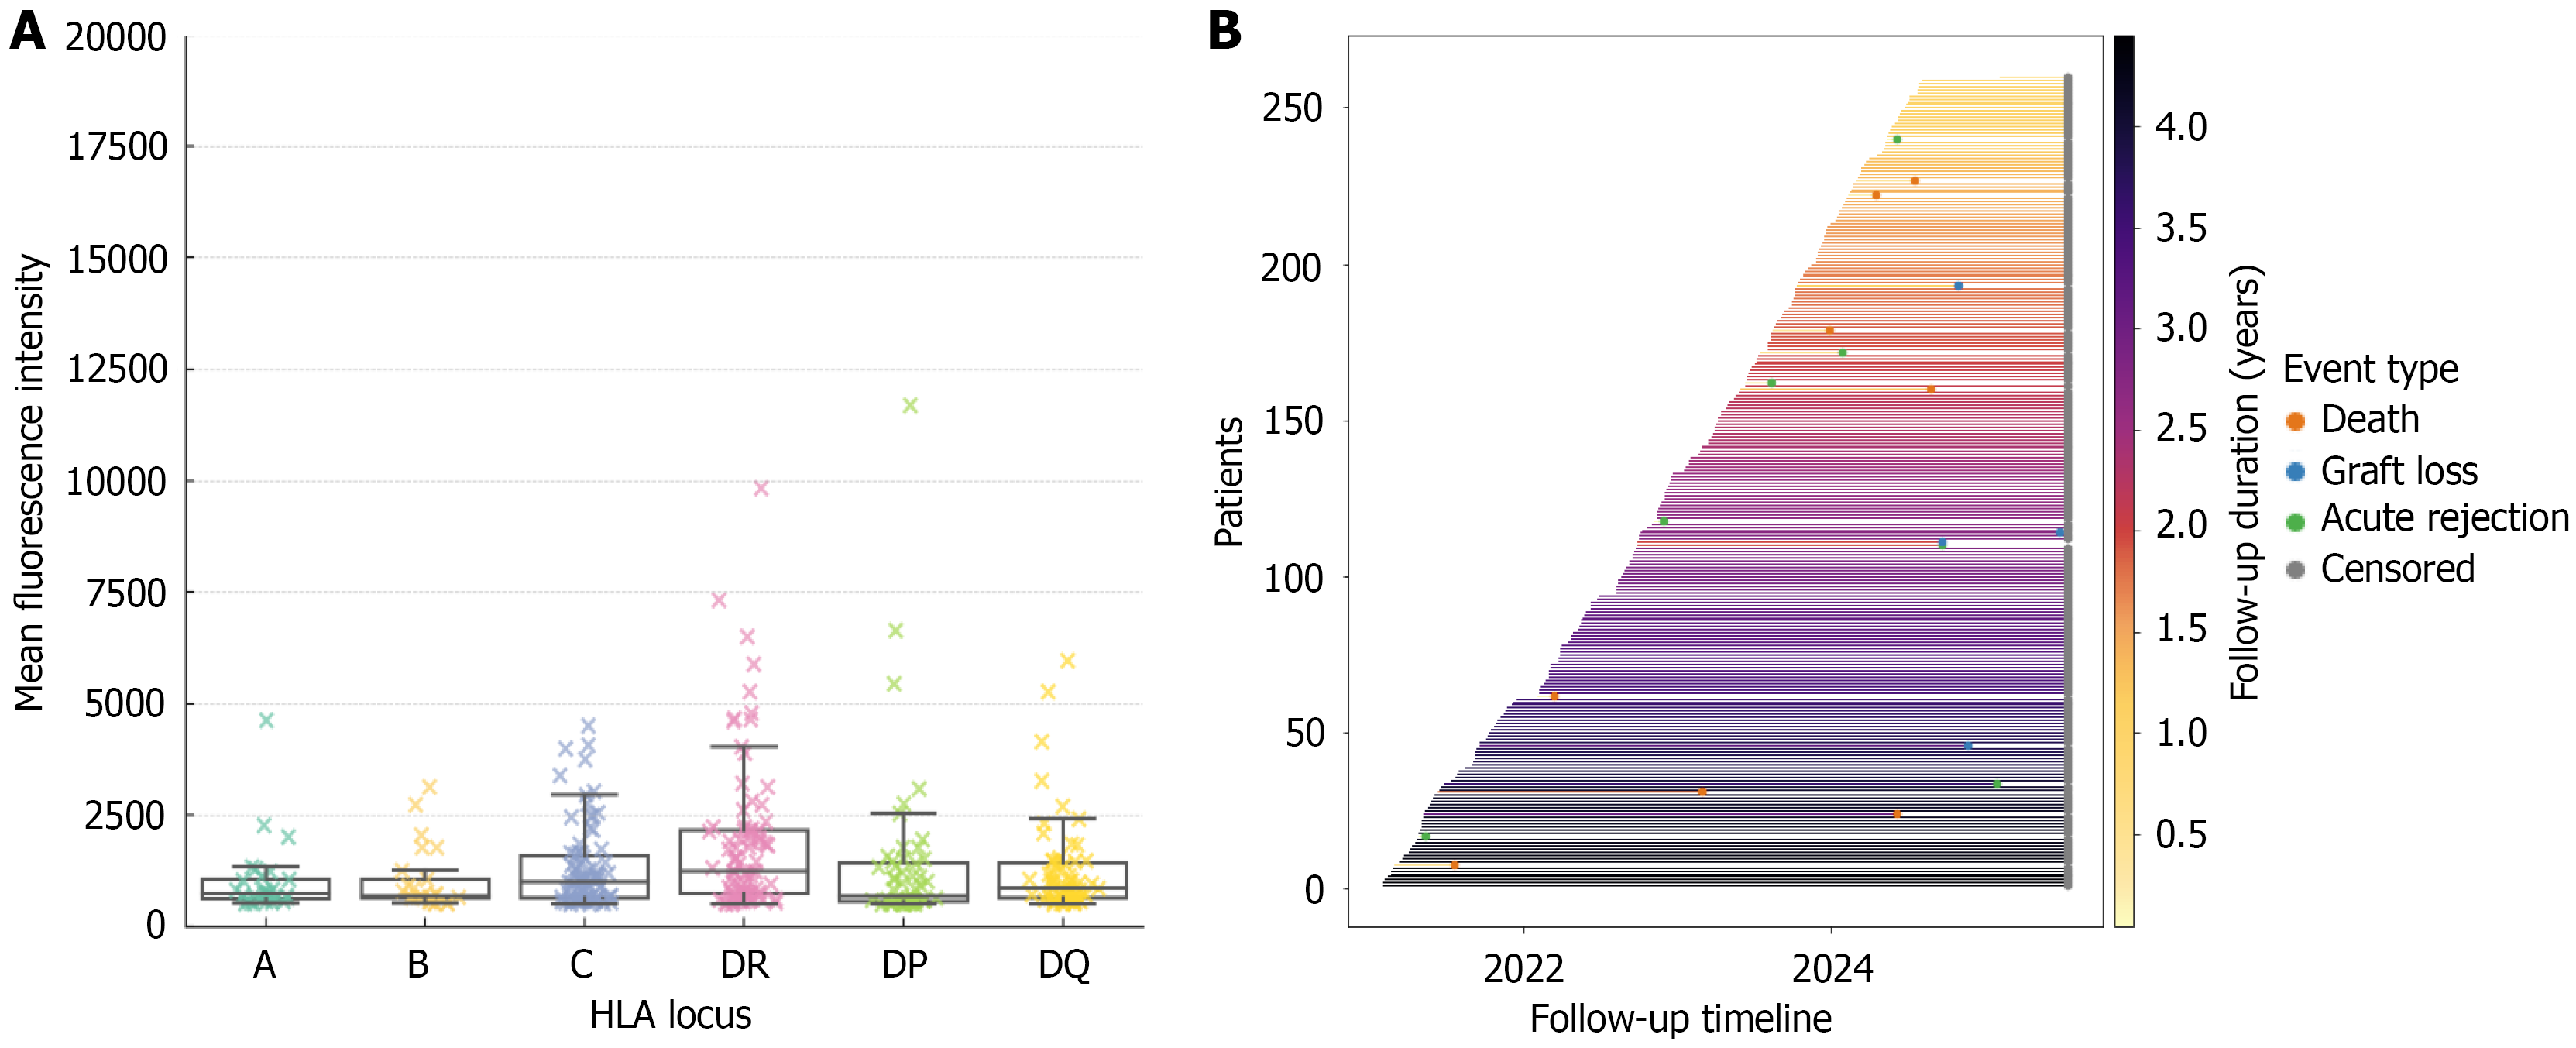
Figure 5 Distribution of pretransplant donor-specific antibodies mean fluorescence intensity across human leukocyte antigen loci (A, B, C, DR, DQ, DP) and patient follow-up timeline.
A: Box plots show locus-specific mean fluorescence intensity values; B: Horizontal timeline plot illustrates individual follow-up duration and outcomes, with markers for death, graft loss, acute rejection, and censoring. HLA: Human leukocyte antigen.
- Citation: Al-Qurashi SH, Khalil MAM, Mahmood HHK, Altom AA, Alqurashi YF, Alsaedi ZA, Cruz AJD, Alsharif MM, Bawayan RM, Housawi AA, Sadagah NM. Impact of pretransplant donor-specific antibodies and human leukocyte antigen mismatches on graft and patient outcomes: A cohort from Saudi Arabia. World J Transplant 2026; 16(3): 122485
- URL: https://www.wjgnet.com/2220-3230/full/v16/i3/122485.htm
- DOI: https://dx.doi.org/10.5500/wjt.122485