Copyright
©The Author(s) 2020.
World J Transplant. Jun 29, 2020; 10(6): 173-182
Published online Jun 29, 2020. doi: 10.5500/wjt.v10.i6.173
Published online Jun 29, 2020. doi: 10.5500/wjt.v10.i6.173
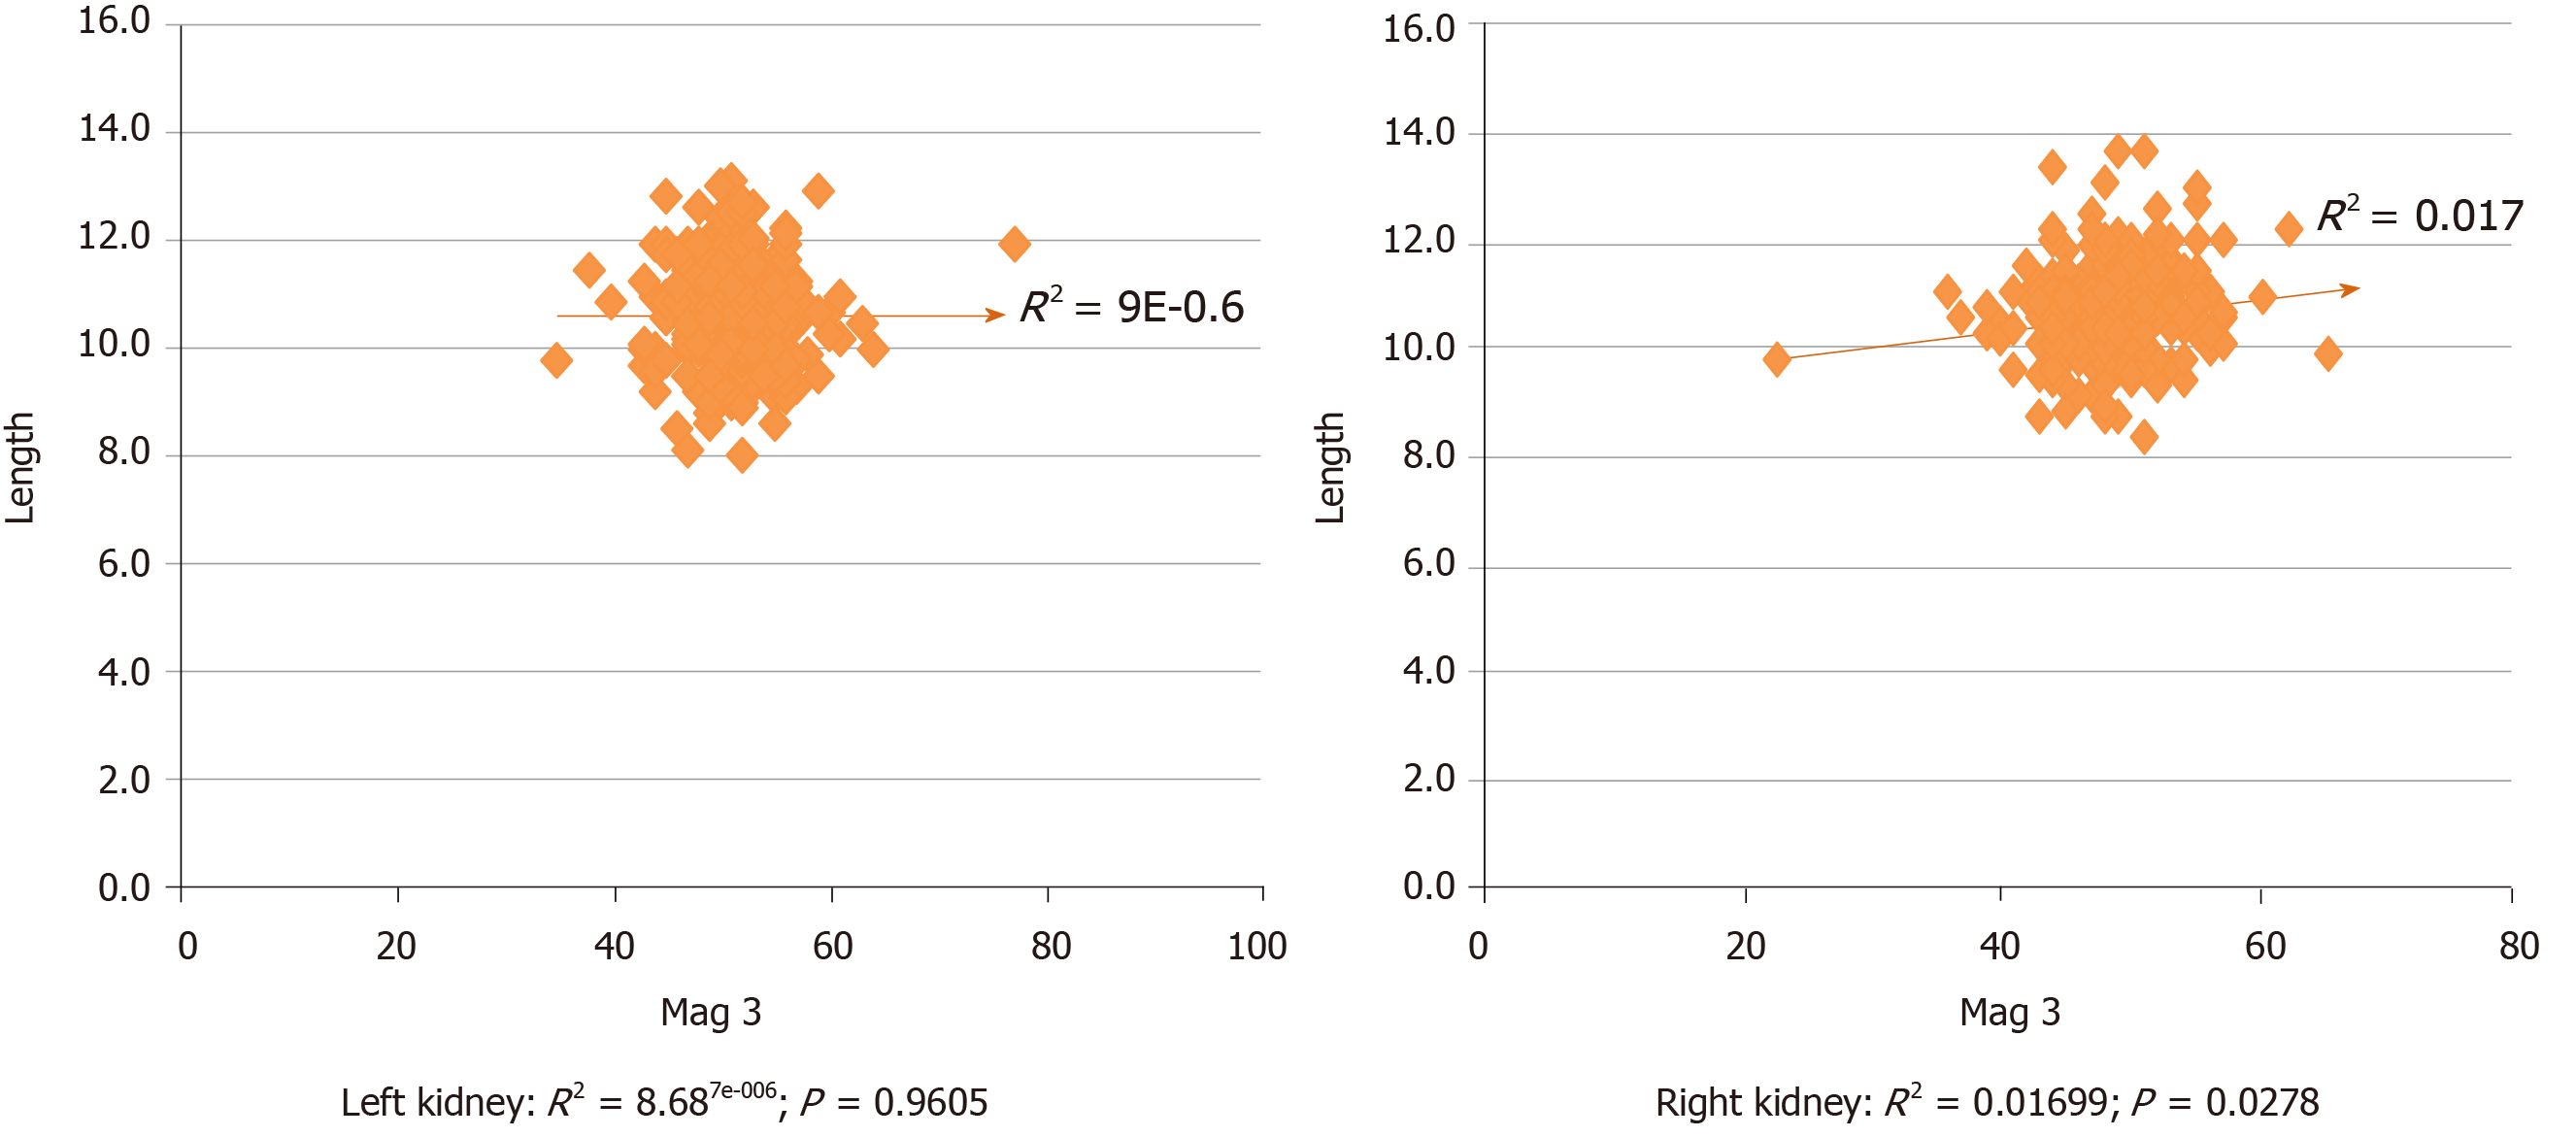
Figure 1 Correlation of kidney length with divided function (differential function x donor glomerular filtration rate) for 285 kidney pairs.
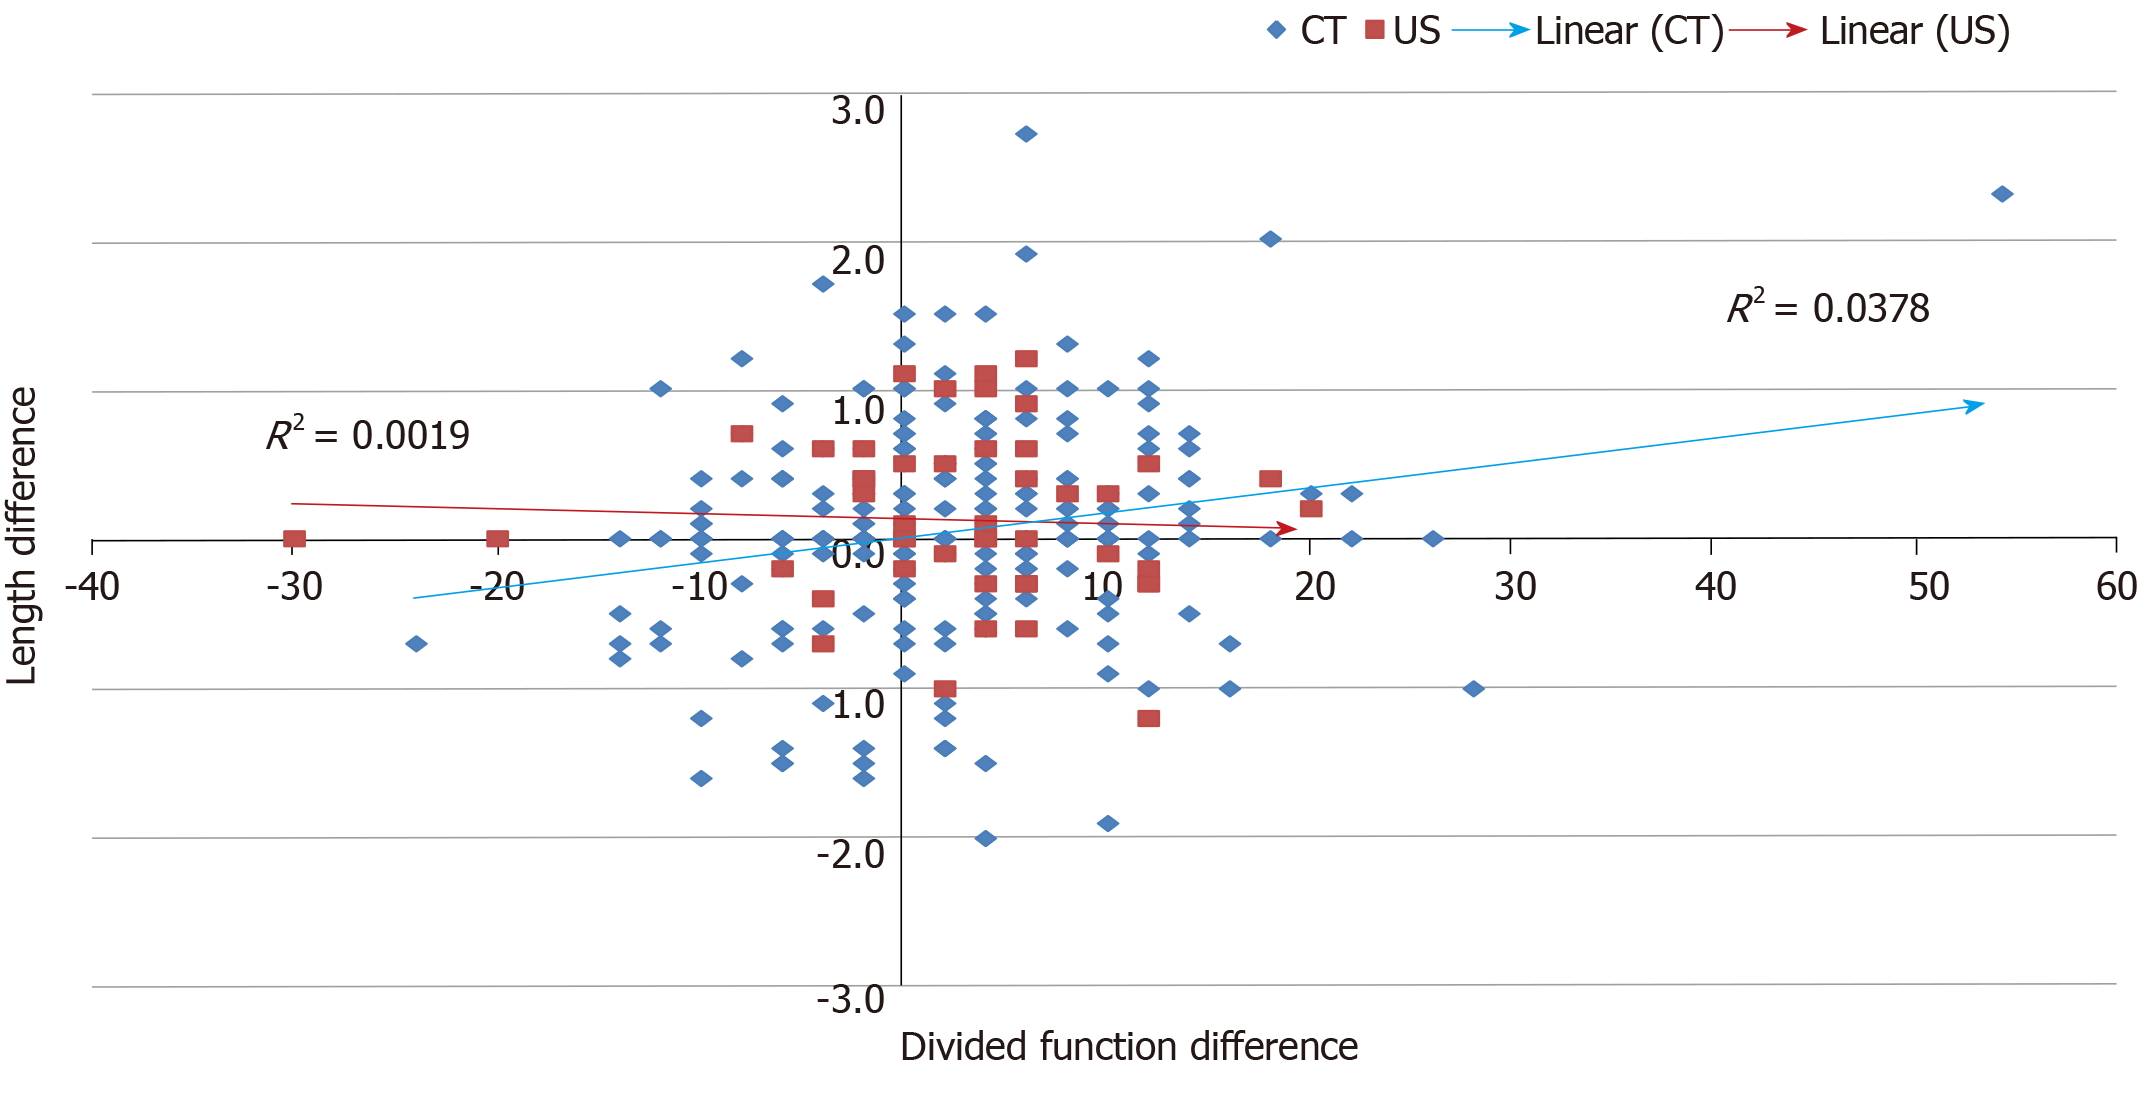
Figure 2 Correlation between difference in length and divided function of kidney pairs according to imaging modality.
CT: Computed tomography; US: Ultrasonography.
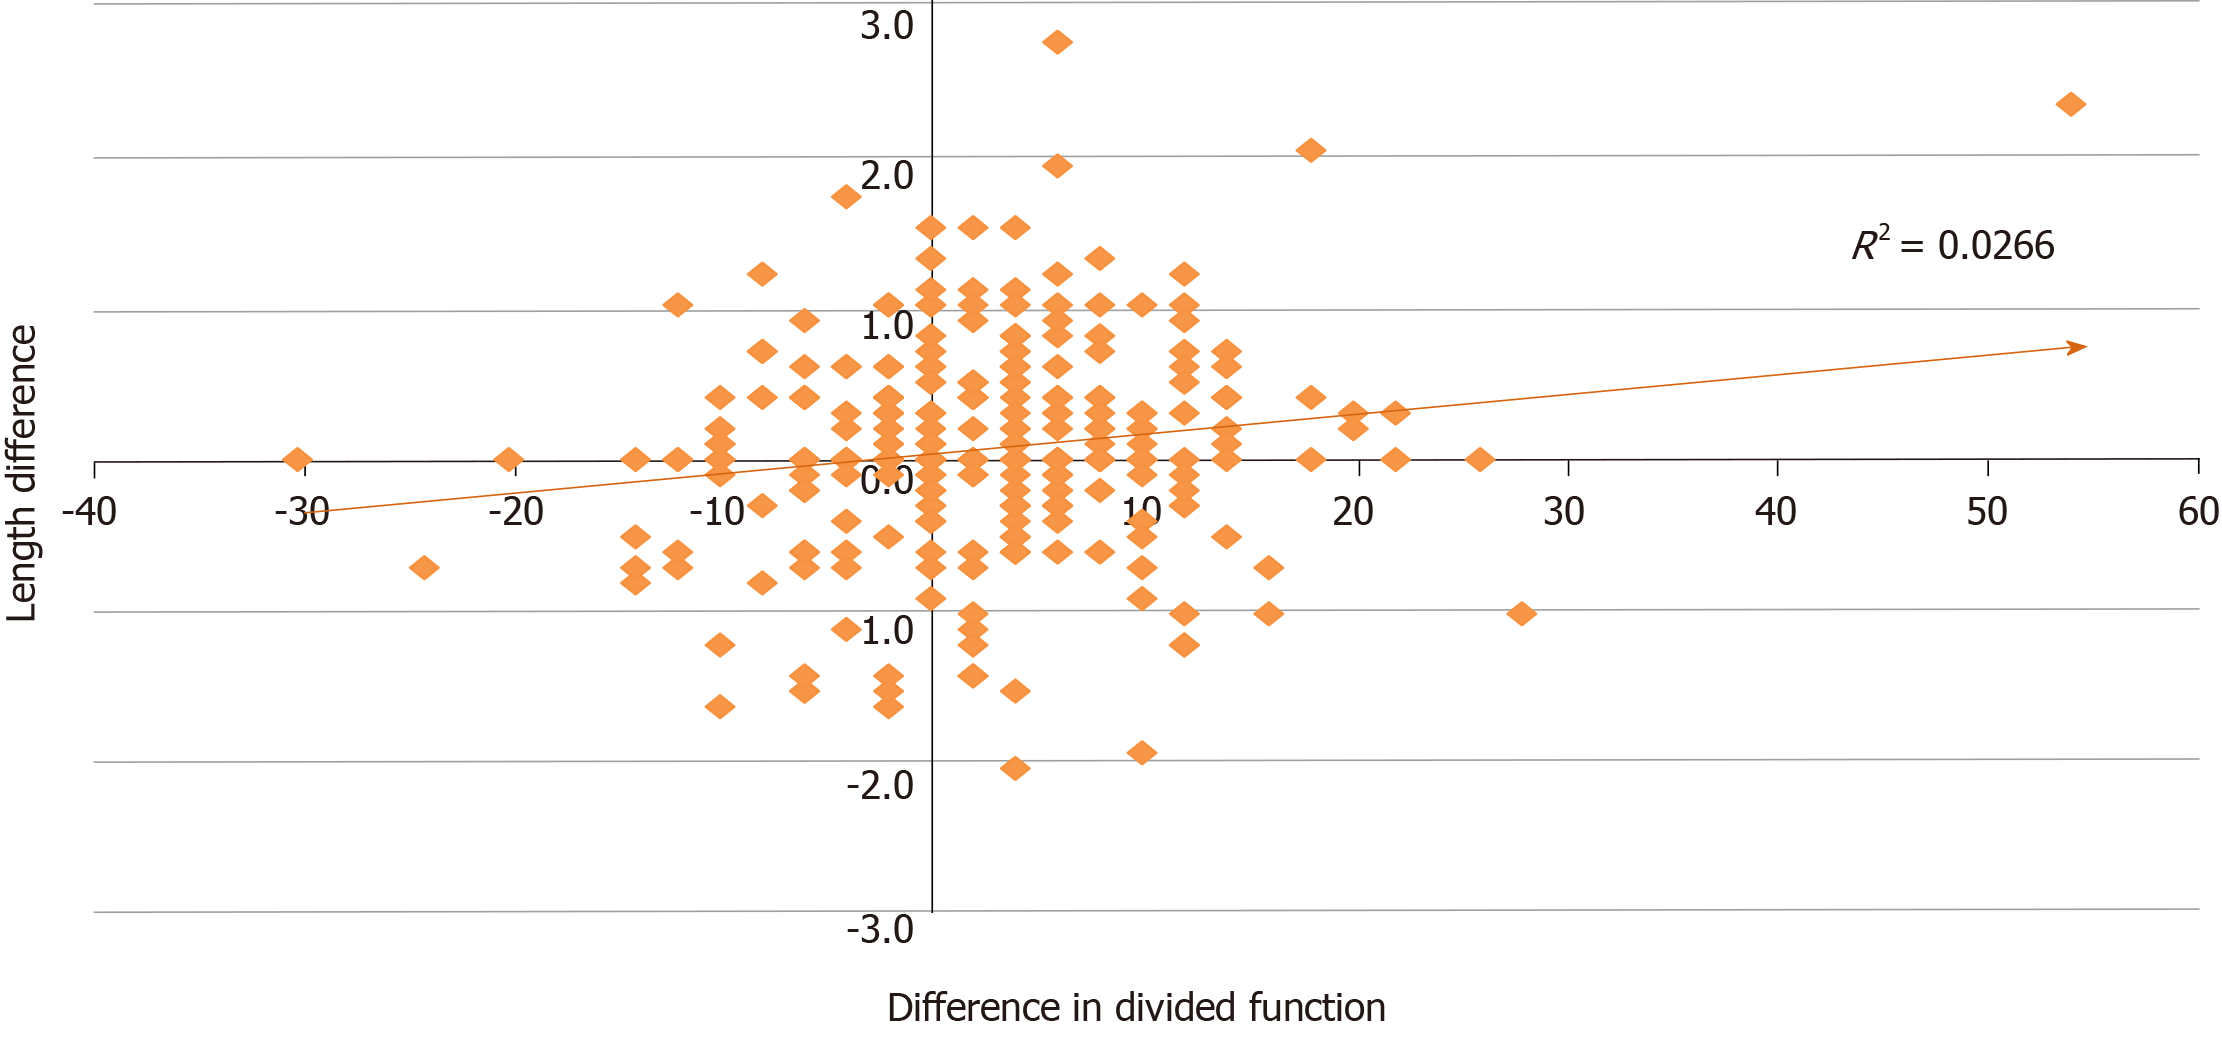
Figure 3 Correlation between differences in length and function of 285 potential donors.
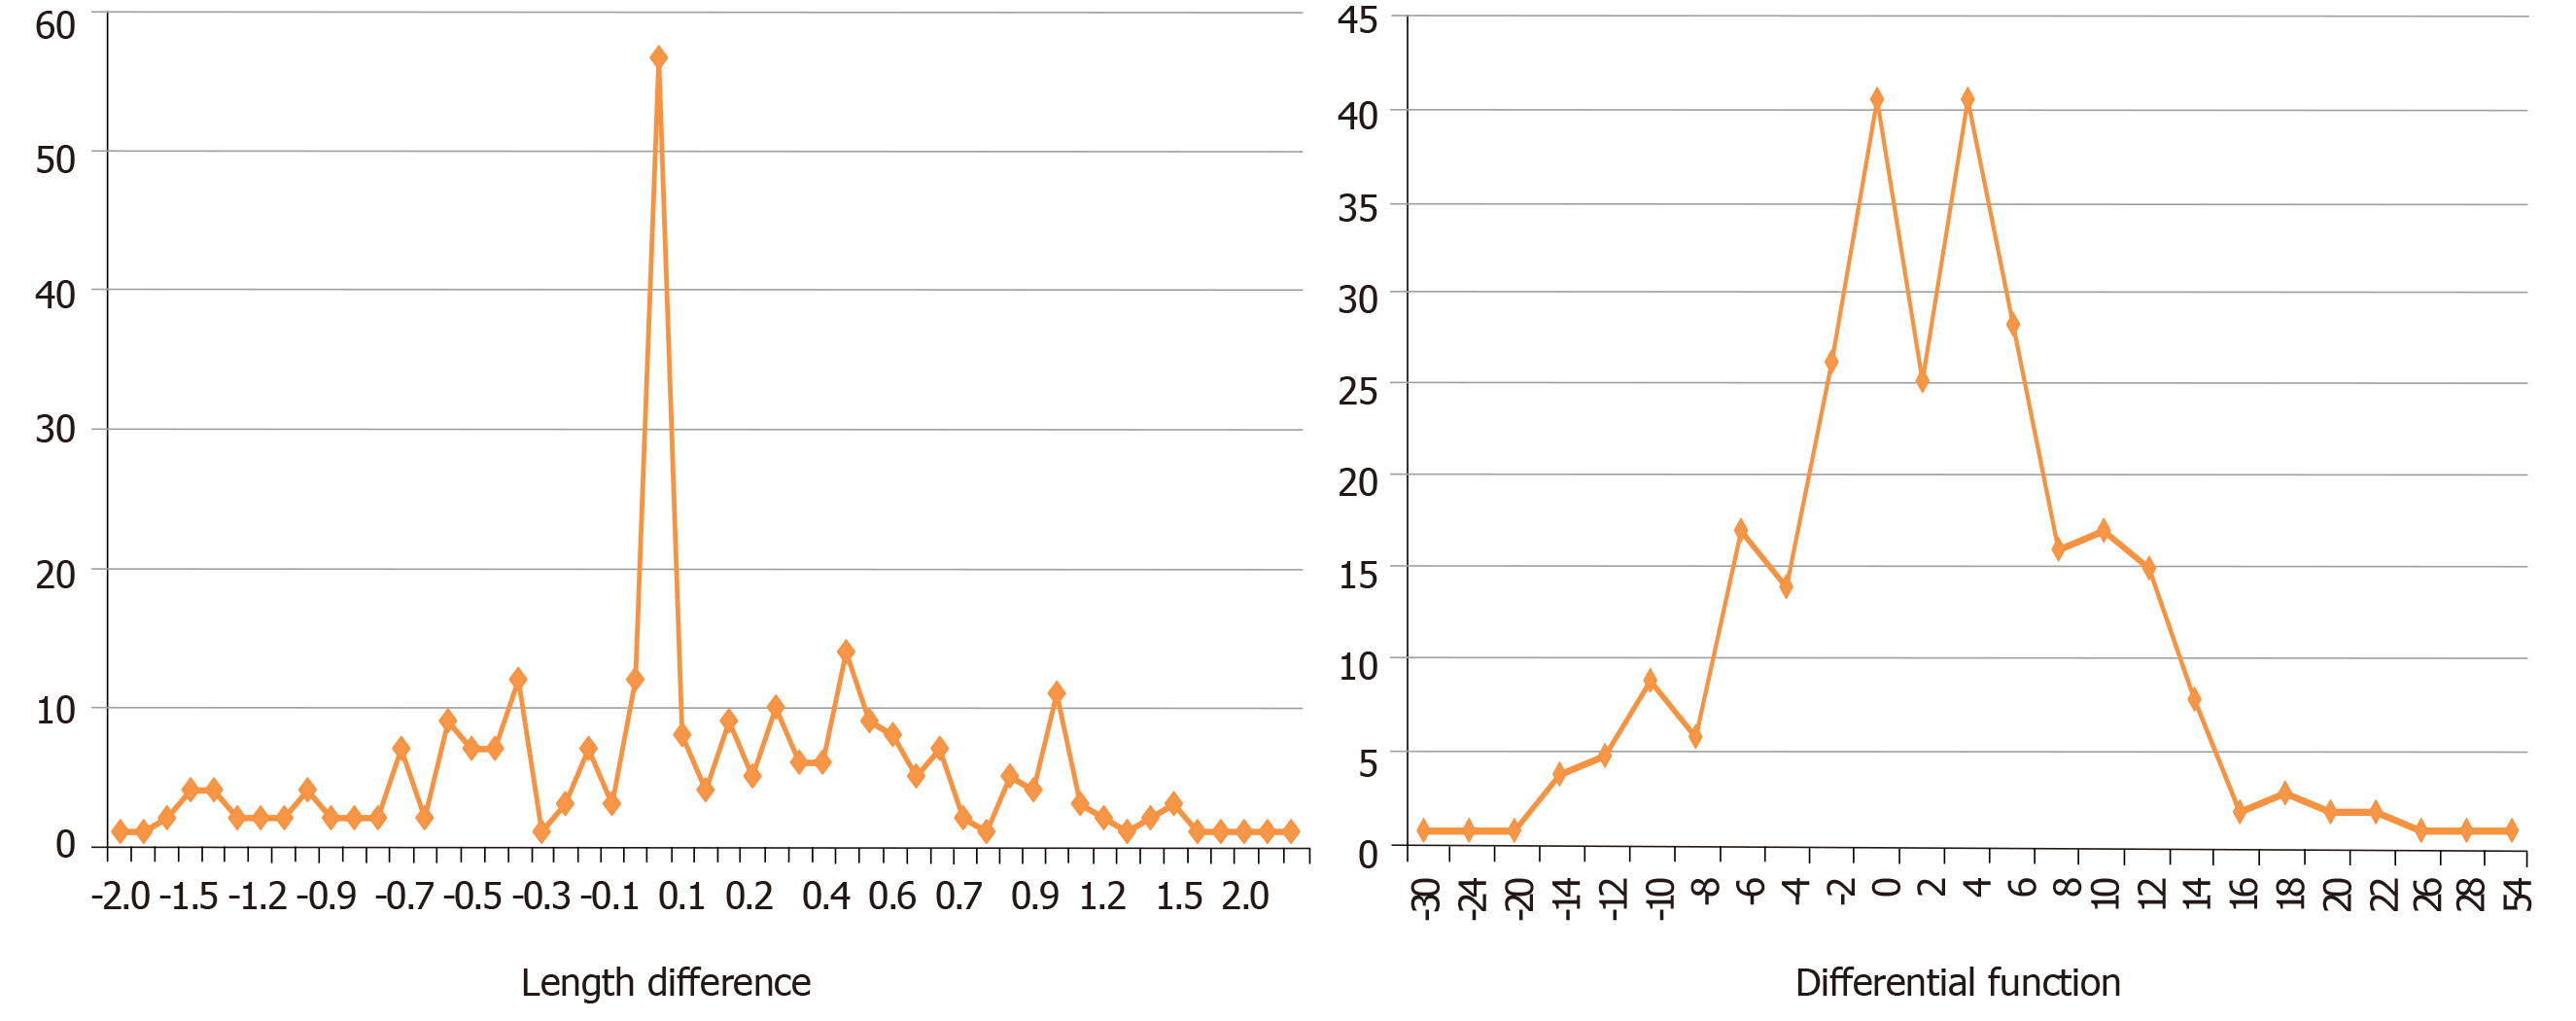
Figure 4 The frequency distribution of the differences in length and divided function between 285 kidney pairs.
- Citation: Akoh JA, Schumacher KJ. Living kidney donor assessment: Kidney length vs differential function. World J Transplant 2020; 10(6): 173-182
- URL: https://www.wjgnet.com/2220-3230/full/v10/i6/173.htm
- DOI: https://dx.doi.org/10.5500/wjt.v10.i6.173


