Copyright
©The Author(s) 2016.
World J Psychiatr. Dec 22, 2016; 6(4): 442-448
Published online Dec 22, 2016. doi: 10.5498/wjp.v6.i4.442
Published online Dec 22, 2016. doi: 10.5498/wjp.v6.i4.442
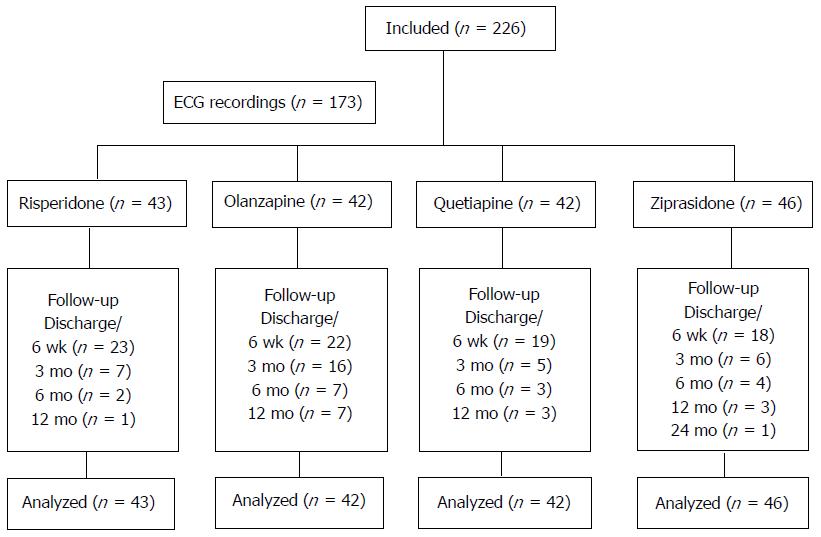
Figure 1 Flow of participants (n) through the study.
ECG: Electrocardiogram.
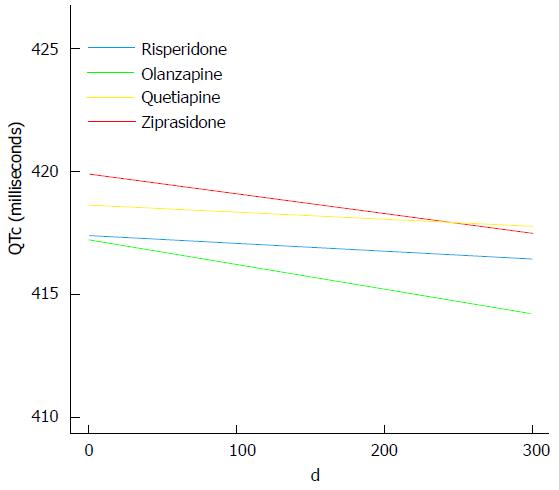
Figure 2 Change of QTc intervals.
The curves were generated based on the drug-specific linear mixed effects slopes for risperidone, olanzapine, quetiapine, and ziprasidone, respectively. The curves are confined to the first 300 d because the bulk of data was obtained before this point in time.
- Citation: Olsen RE, Kroken RA, Bjørhovde S, Aanesen K, Jørgensen HA, Løberg EM, Johnsen E. Influence of different second generation antipsychotics on the QTc interval: A pragmatic study. World J Psychiatr 2016; 6(4): 442-448
- URL: https://www.wjgnet.com/2220-3206/full/v6/i4/442.htm
- DOI: https://dx.doi.org/10.5498/wjp.v6.i4.442


