Copyright
©The Author(s) 2025.
World J Psychiatry. Sep 19, 2025; 15(9): 109789
Published online Sep 19, 2025. doi: 10.5498/wjp.v15.i9.109789
Published online Sep 19, 2025. doi: 10.5498/wjp.v15.i9.109789
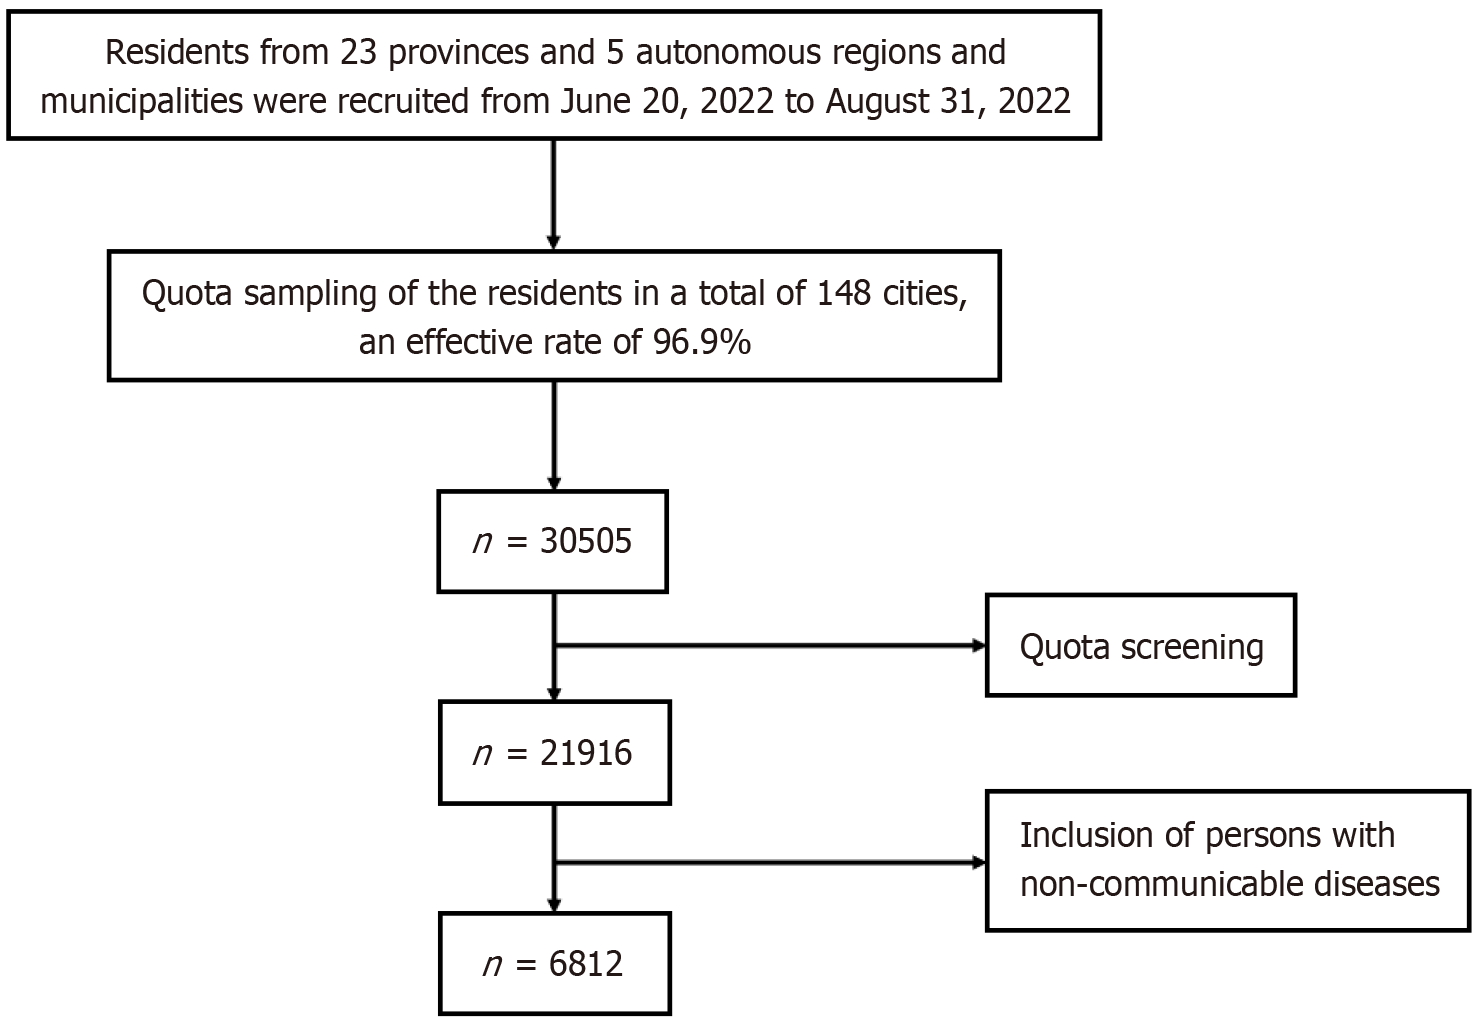
Figure 1
Flow diagram of participant selection.
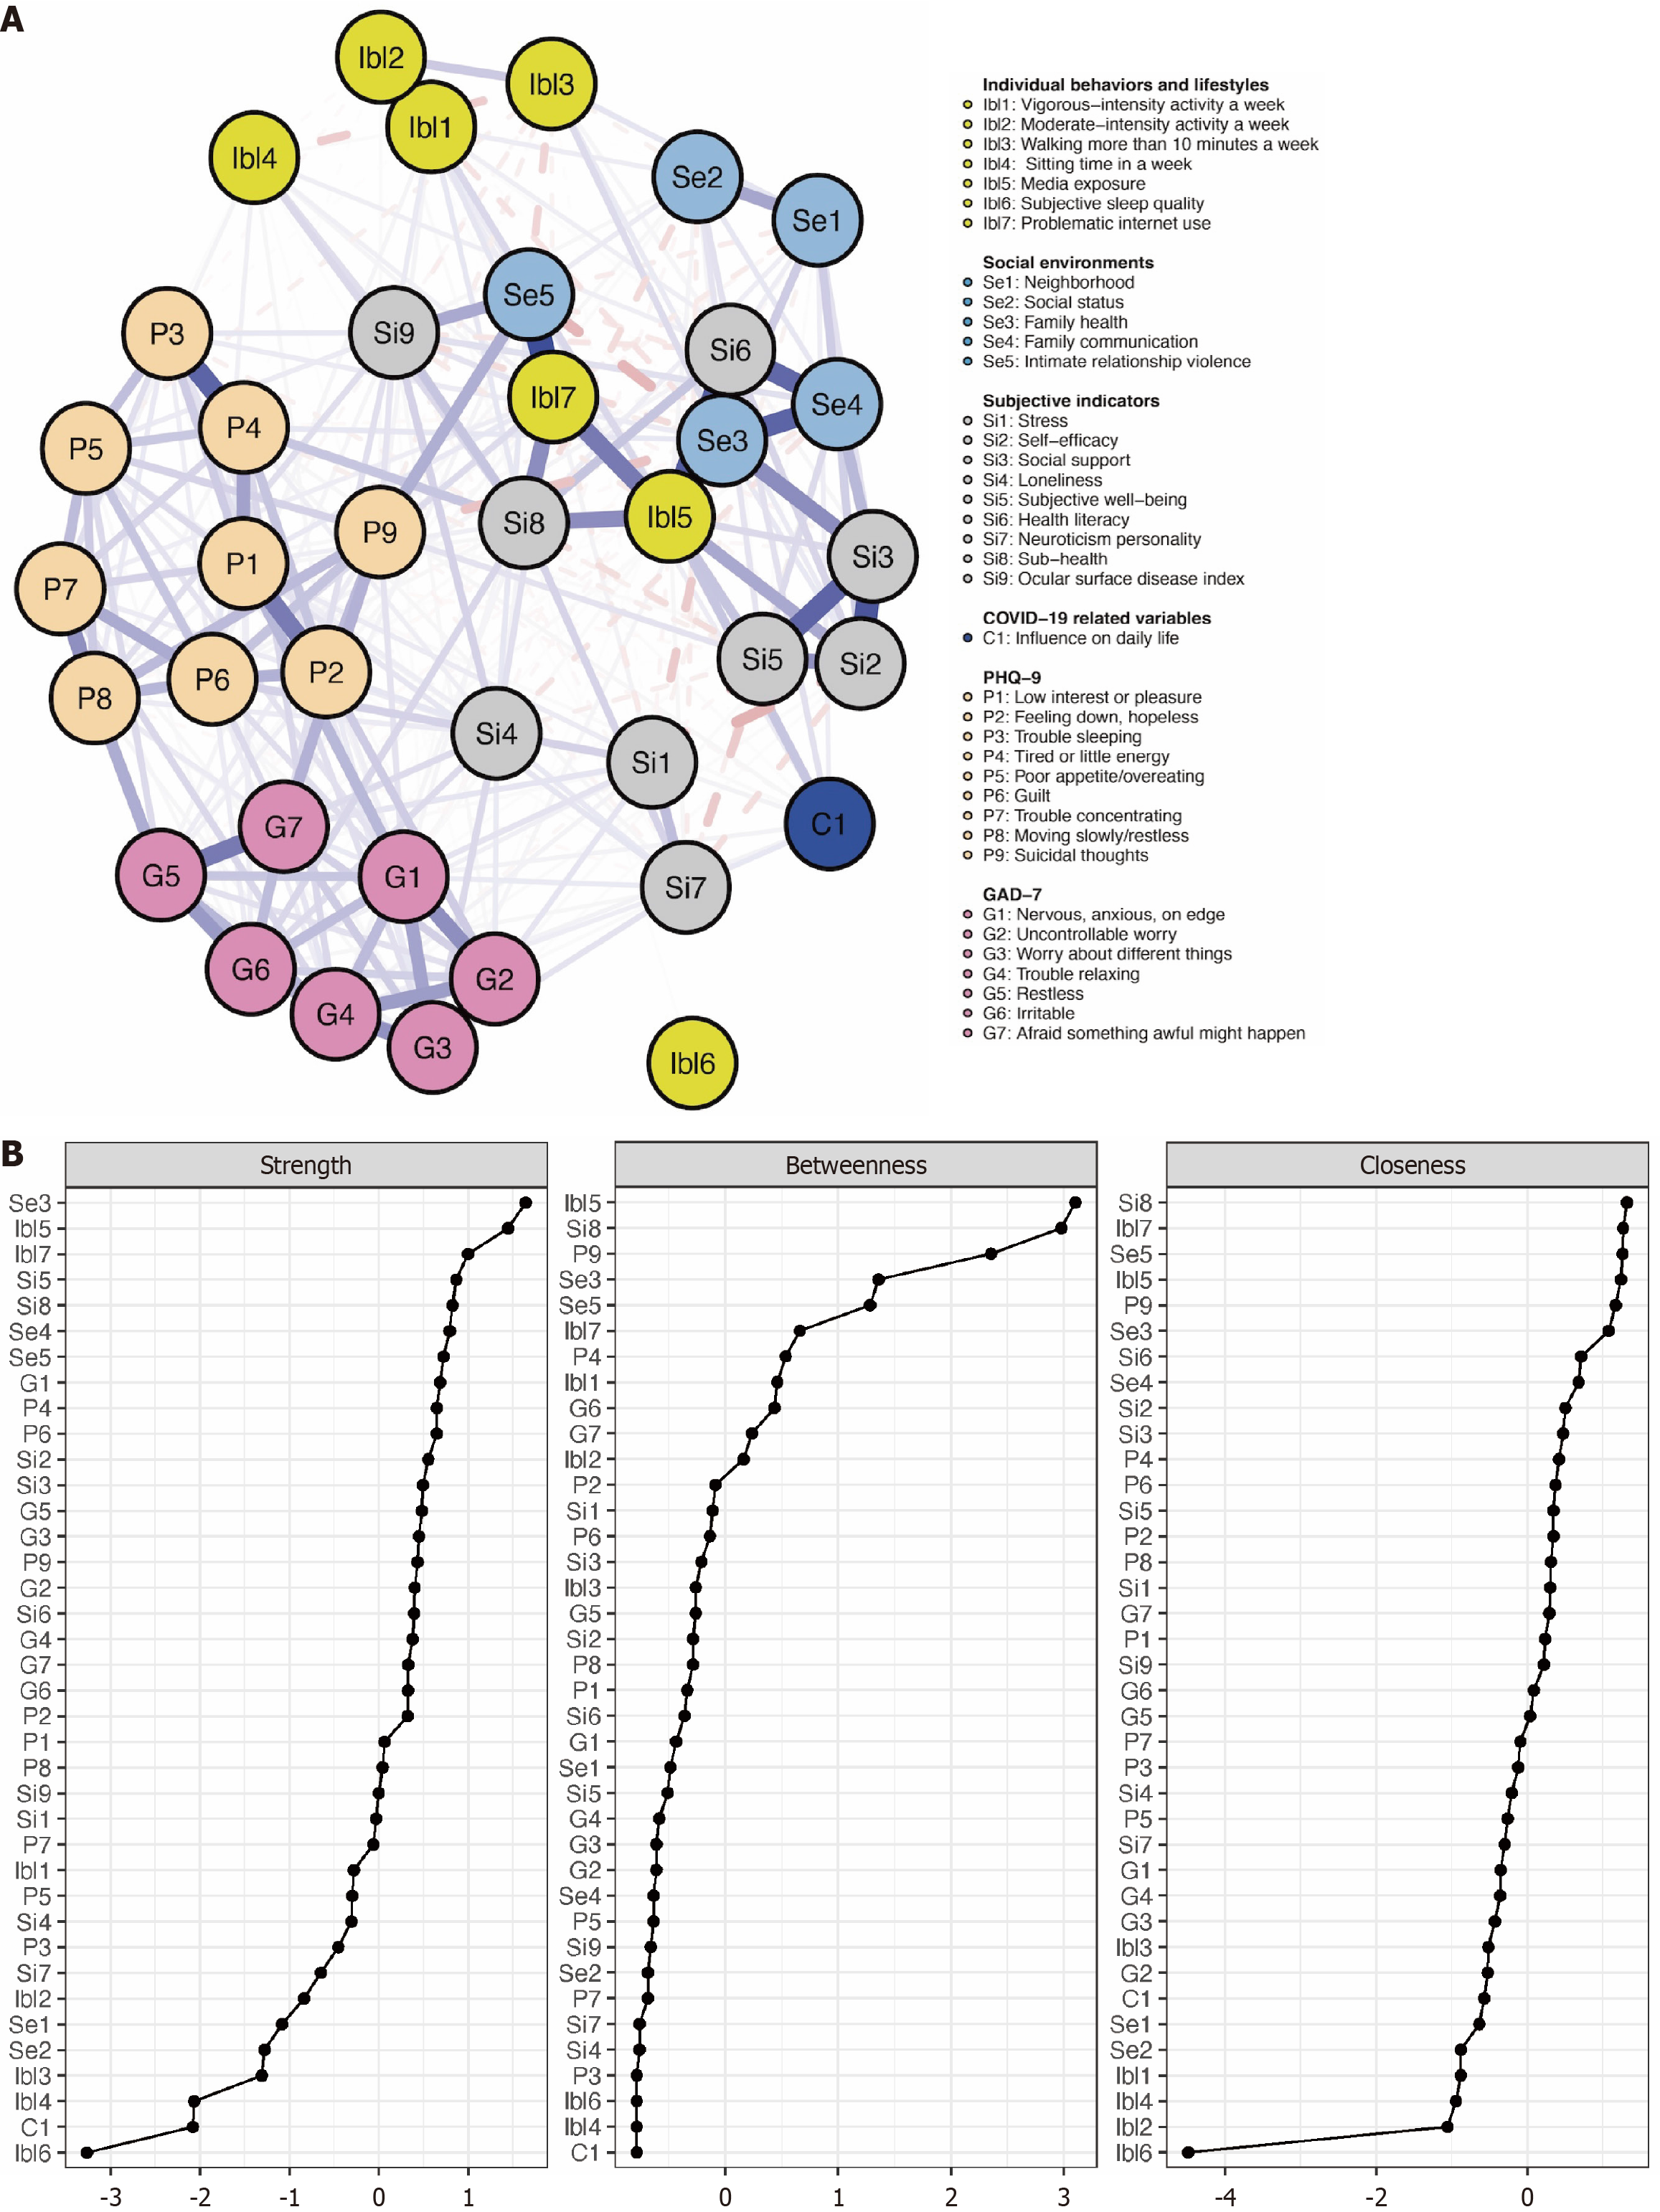
Figure 2 Estimated network model of depression-anxiety and their related factors and the centrality indices in the Chinese population with noncommunicable chronic diseases.
A: Estimated network model of depression-anxiety and their related factors; B: The centrality indices in the Chinese population with noncommunicable chronic diseases. Different colored nodes represent specific symptoms of anxiety and depression and related factors. Blue edges constitute positive partial correlations between variables, and red edges constitute negative partial correlations. The edge thickness represents the strength of the association between various nodes. C1: Influence on daily life; G1: Nervous, anxious, on edge; G2: Uncontrollable worry; G3: Worry about different things; G4: Trouble relaxing; G5: Restless; G6: Irritable; G7: Afraid something awful might happen; Ibl1: Vigorous-intensity activity a week; Ibl2: Moderate-intensity activity a week; Ibl3: Walking more than 10 minutes a week; Ibl4: Sitting time in a week; Ibl5 Media exposure; Ibl6: Subjective sleep quality; Ibl7: Problematic internet use; P1: Low interest or pleasure; P2: Feeling down, hopeless; P3: Trouble sleeping; P4: Tired or little energy; P5: Poor appetite/overeating; P6: Guilt; P7: Trouble concentrating; P8: Moving slowly/restless; P9: Suicidal thoughts; Se1: Neighborhood; Se2: Social status; Se3: Family health; Se4: Family communication; Se5: Intimate relationship violence; Si1: Stress; Si2: Self-efficacy; Si3: Social support; Si4: Loneliness; Si5: Subjective well-being; Si6: Health literacy; Si7: Neuroticism personality; Si8: Suboptimal health status; Si9: Ocular surface disease index.
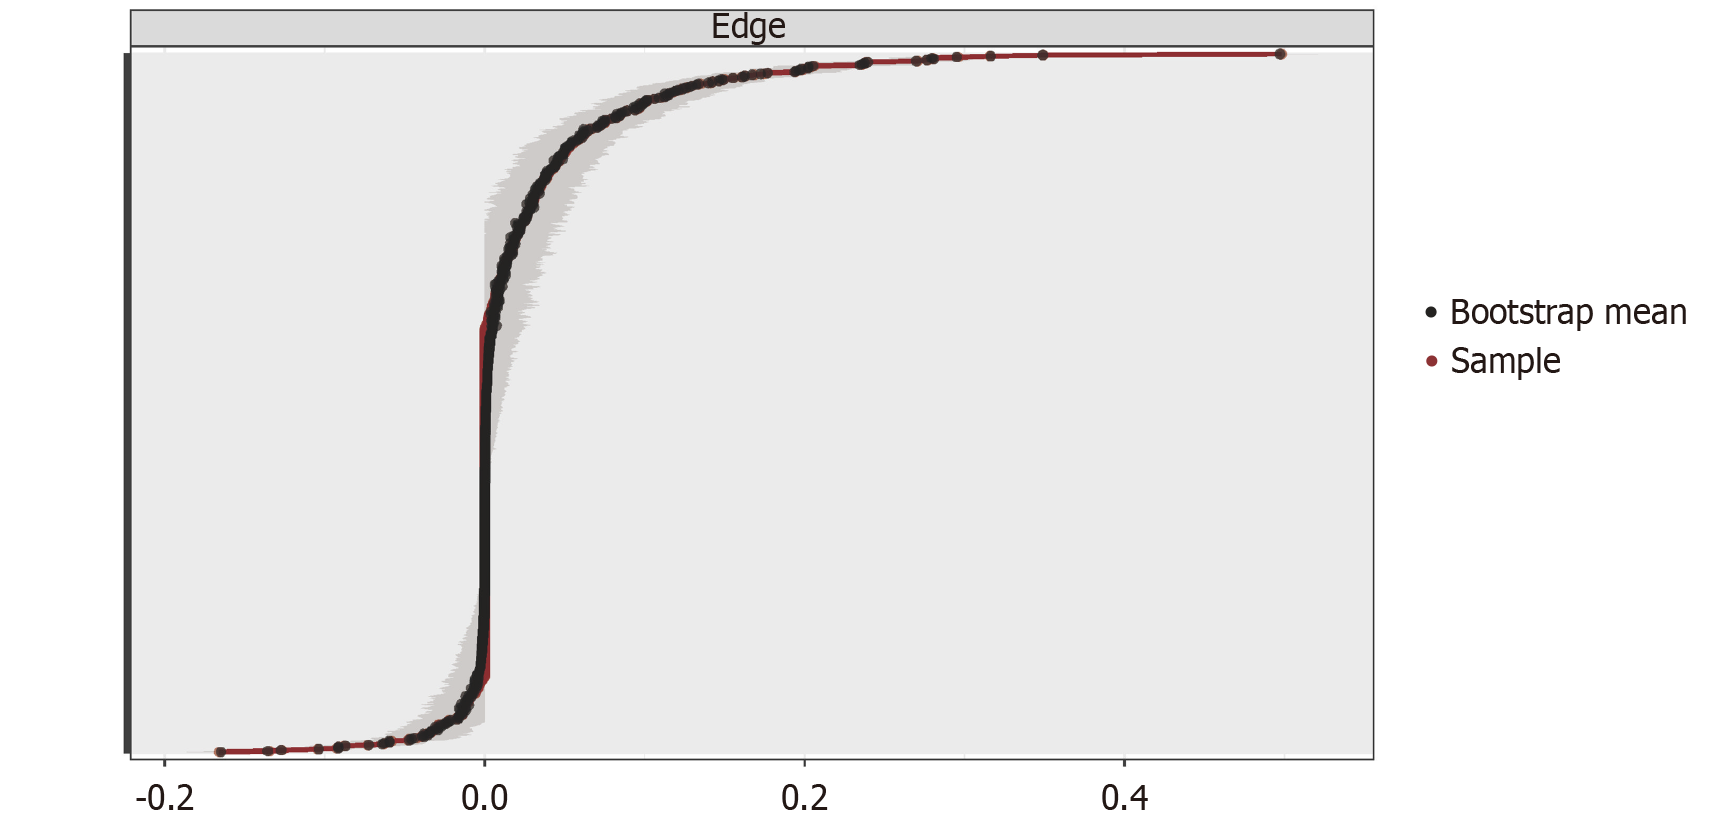
Figure 3 Accuracy of the network edges by non-parametric bootstrapping.
The gray area represents the bootstrap 95% confidence intervals. Narrower confidence intervals indicate reliable accuracy.
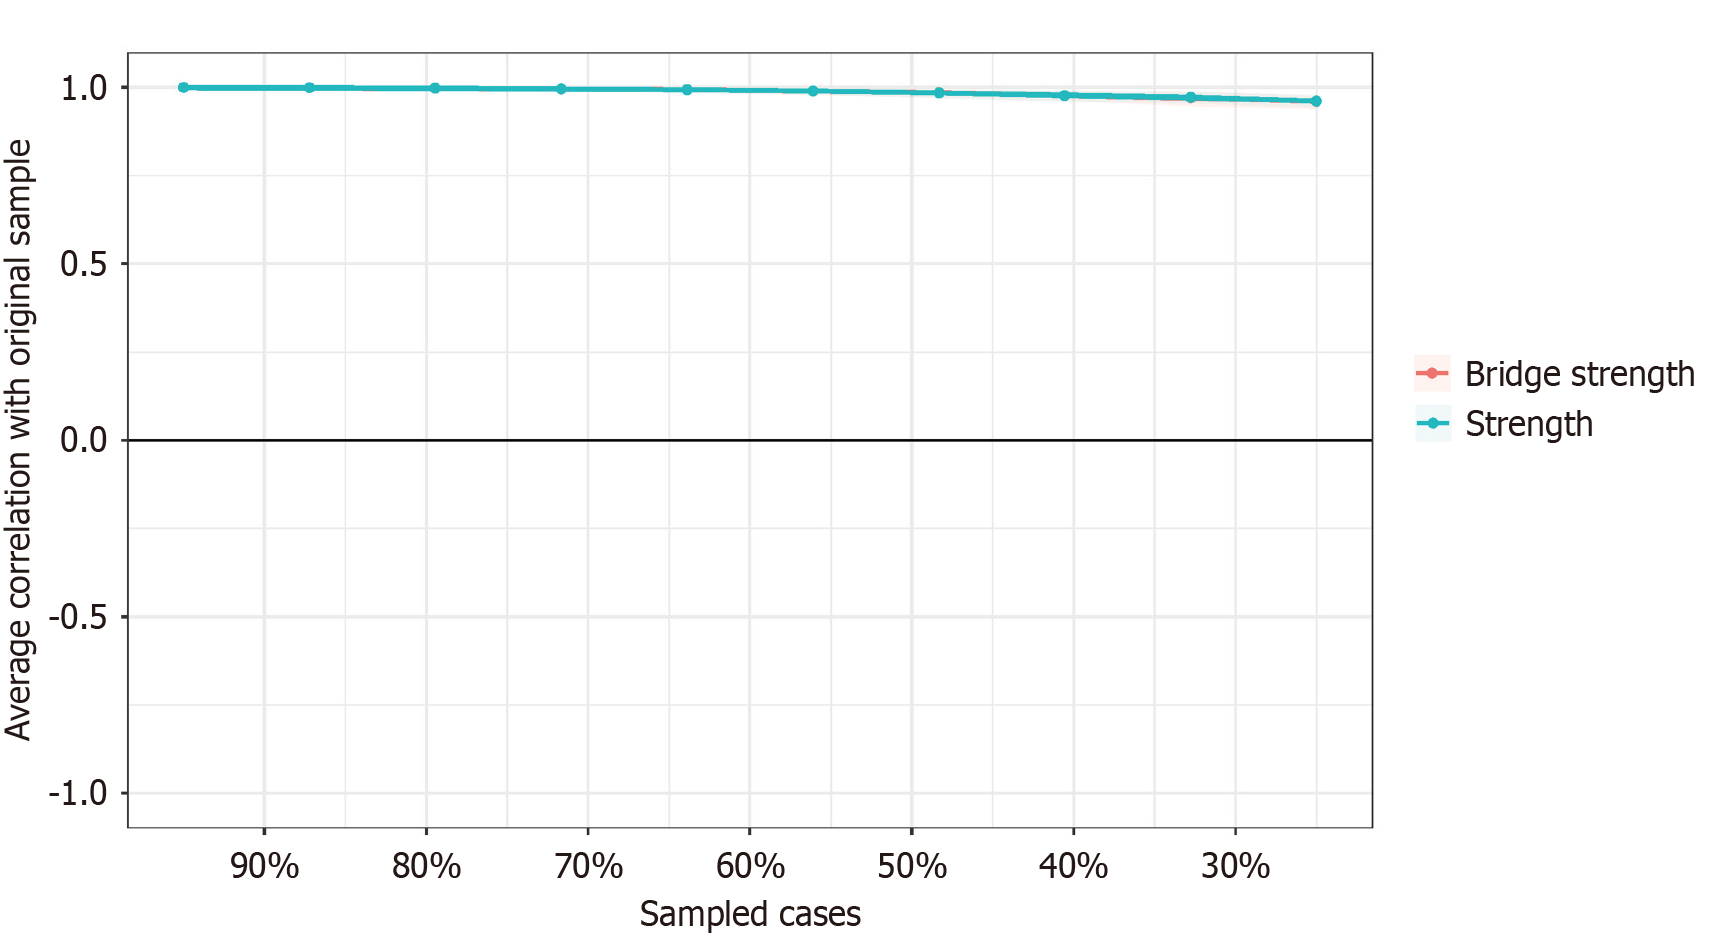
Figure 4 Stability of the network.
The stability of central and bridge strength by case-dropping bootstrap.
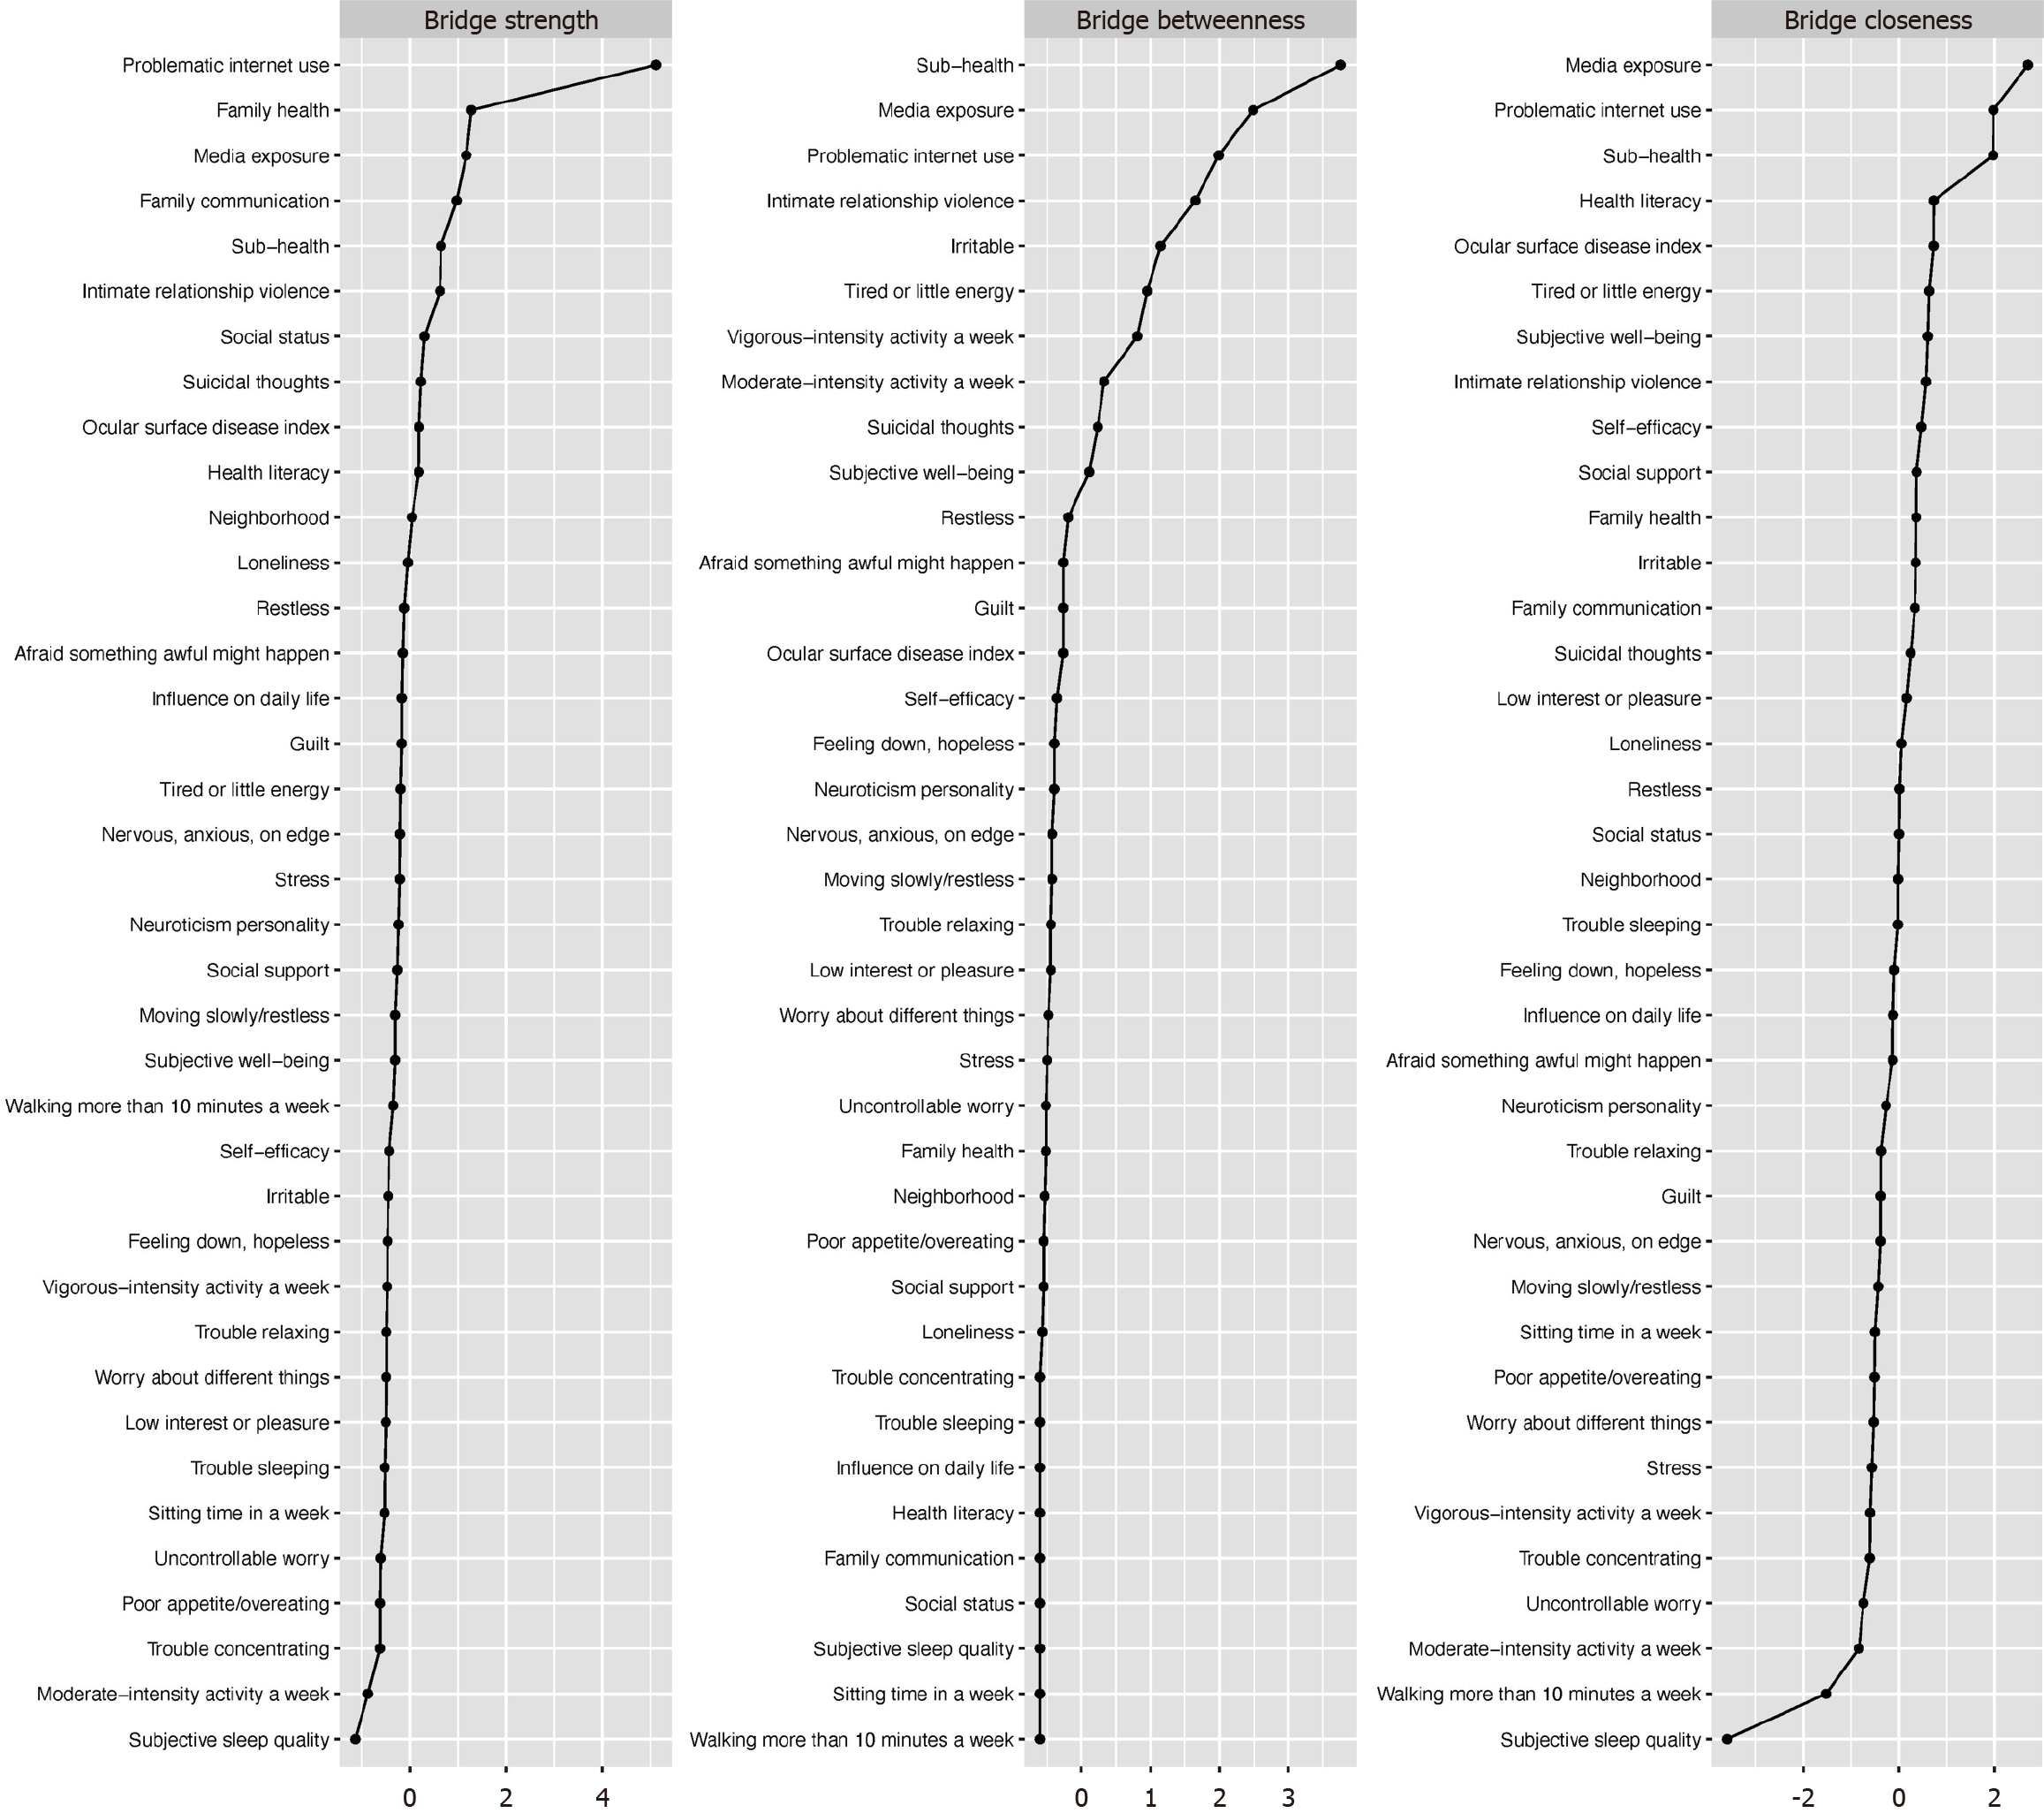
Figure 5 Bridge centrality indices of depression, anxiety, and their related factors.
The bridge centralities were ranked in order, and the z-scores (not raw score) are represented.
- Citation: Li HY, Song DY, Weng YQ, Tong YH, Wu YB, Wang HM. Prevalence of depression and anxiety and related influencing factors in the Chinese population with noncommunicable chronic diseases: A network perspective. World J Psychiatry 2025; 15(9): 109789
- URL: https://www.wjgnet.com/2220-3206/full/v15/i9/109789.htm
- DOI: https://dx.doi.org/10.5498/wjp.v15.i9.109789


