Copyright
©The Author(s) 2025.
World J Psychiatry. Sep 19, 2025; 15(9): 107754
Published online Sep 19, 2025. doi: 10.5498/wjp.v15.i9.107754
Published online Sep 19, 2025. doi: 10.5498/wjp.v15.i9.107754
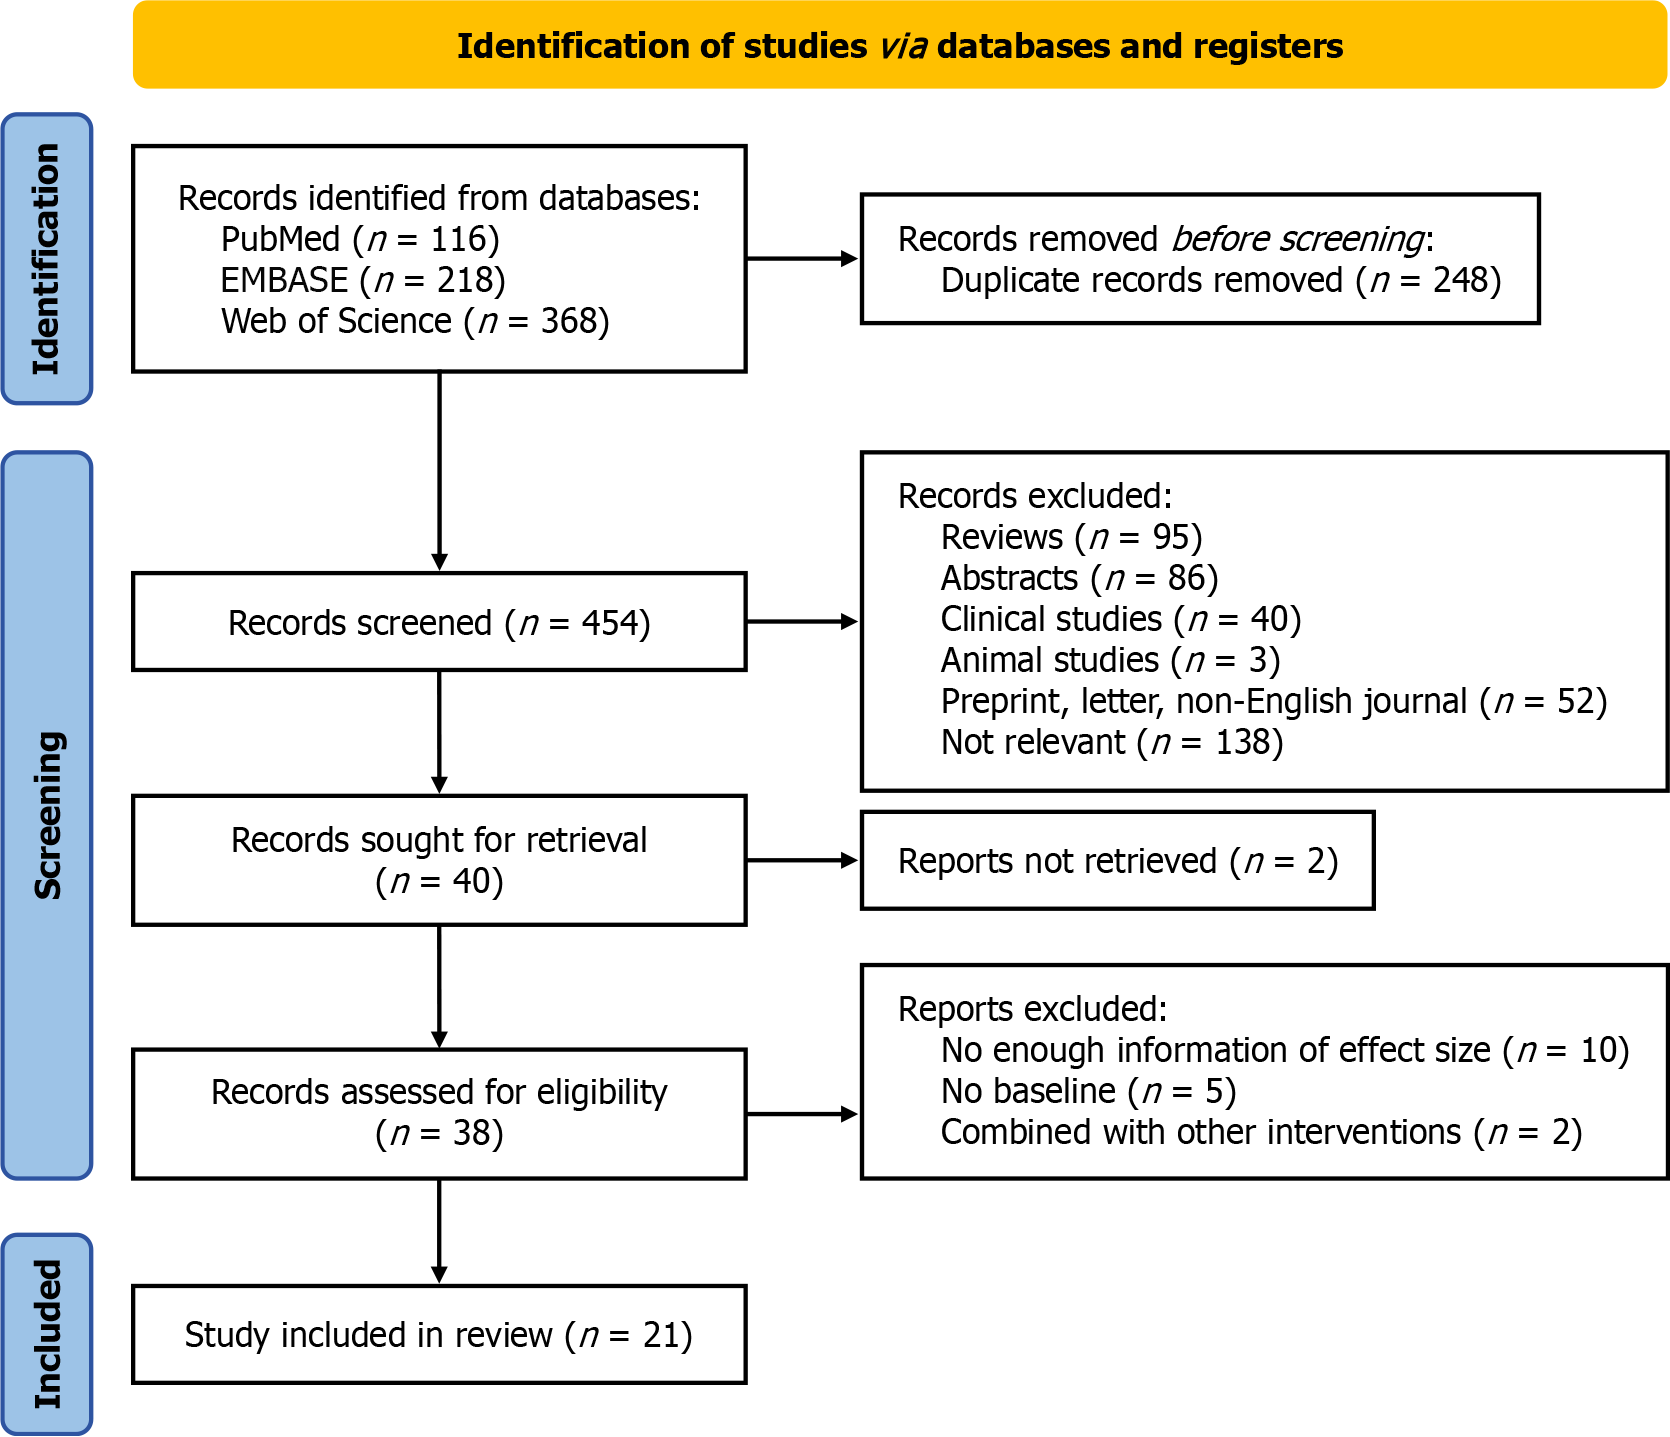
Figure 1
PRISMA flowchart of the study selection procedure.
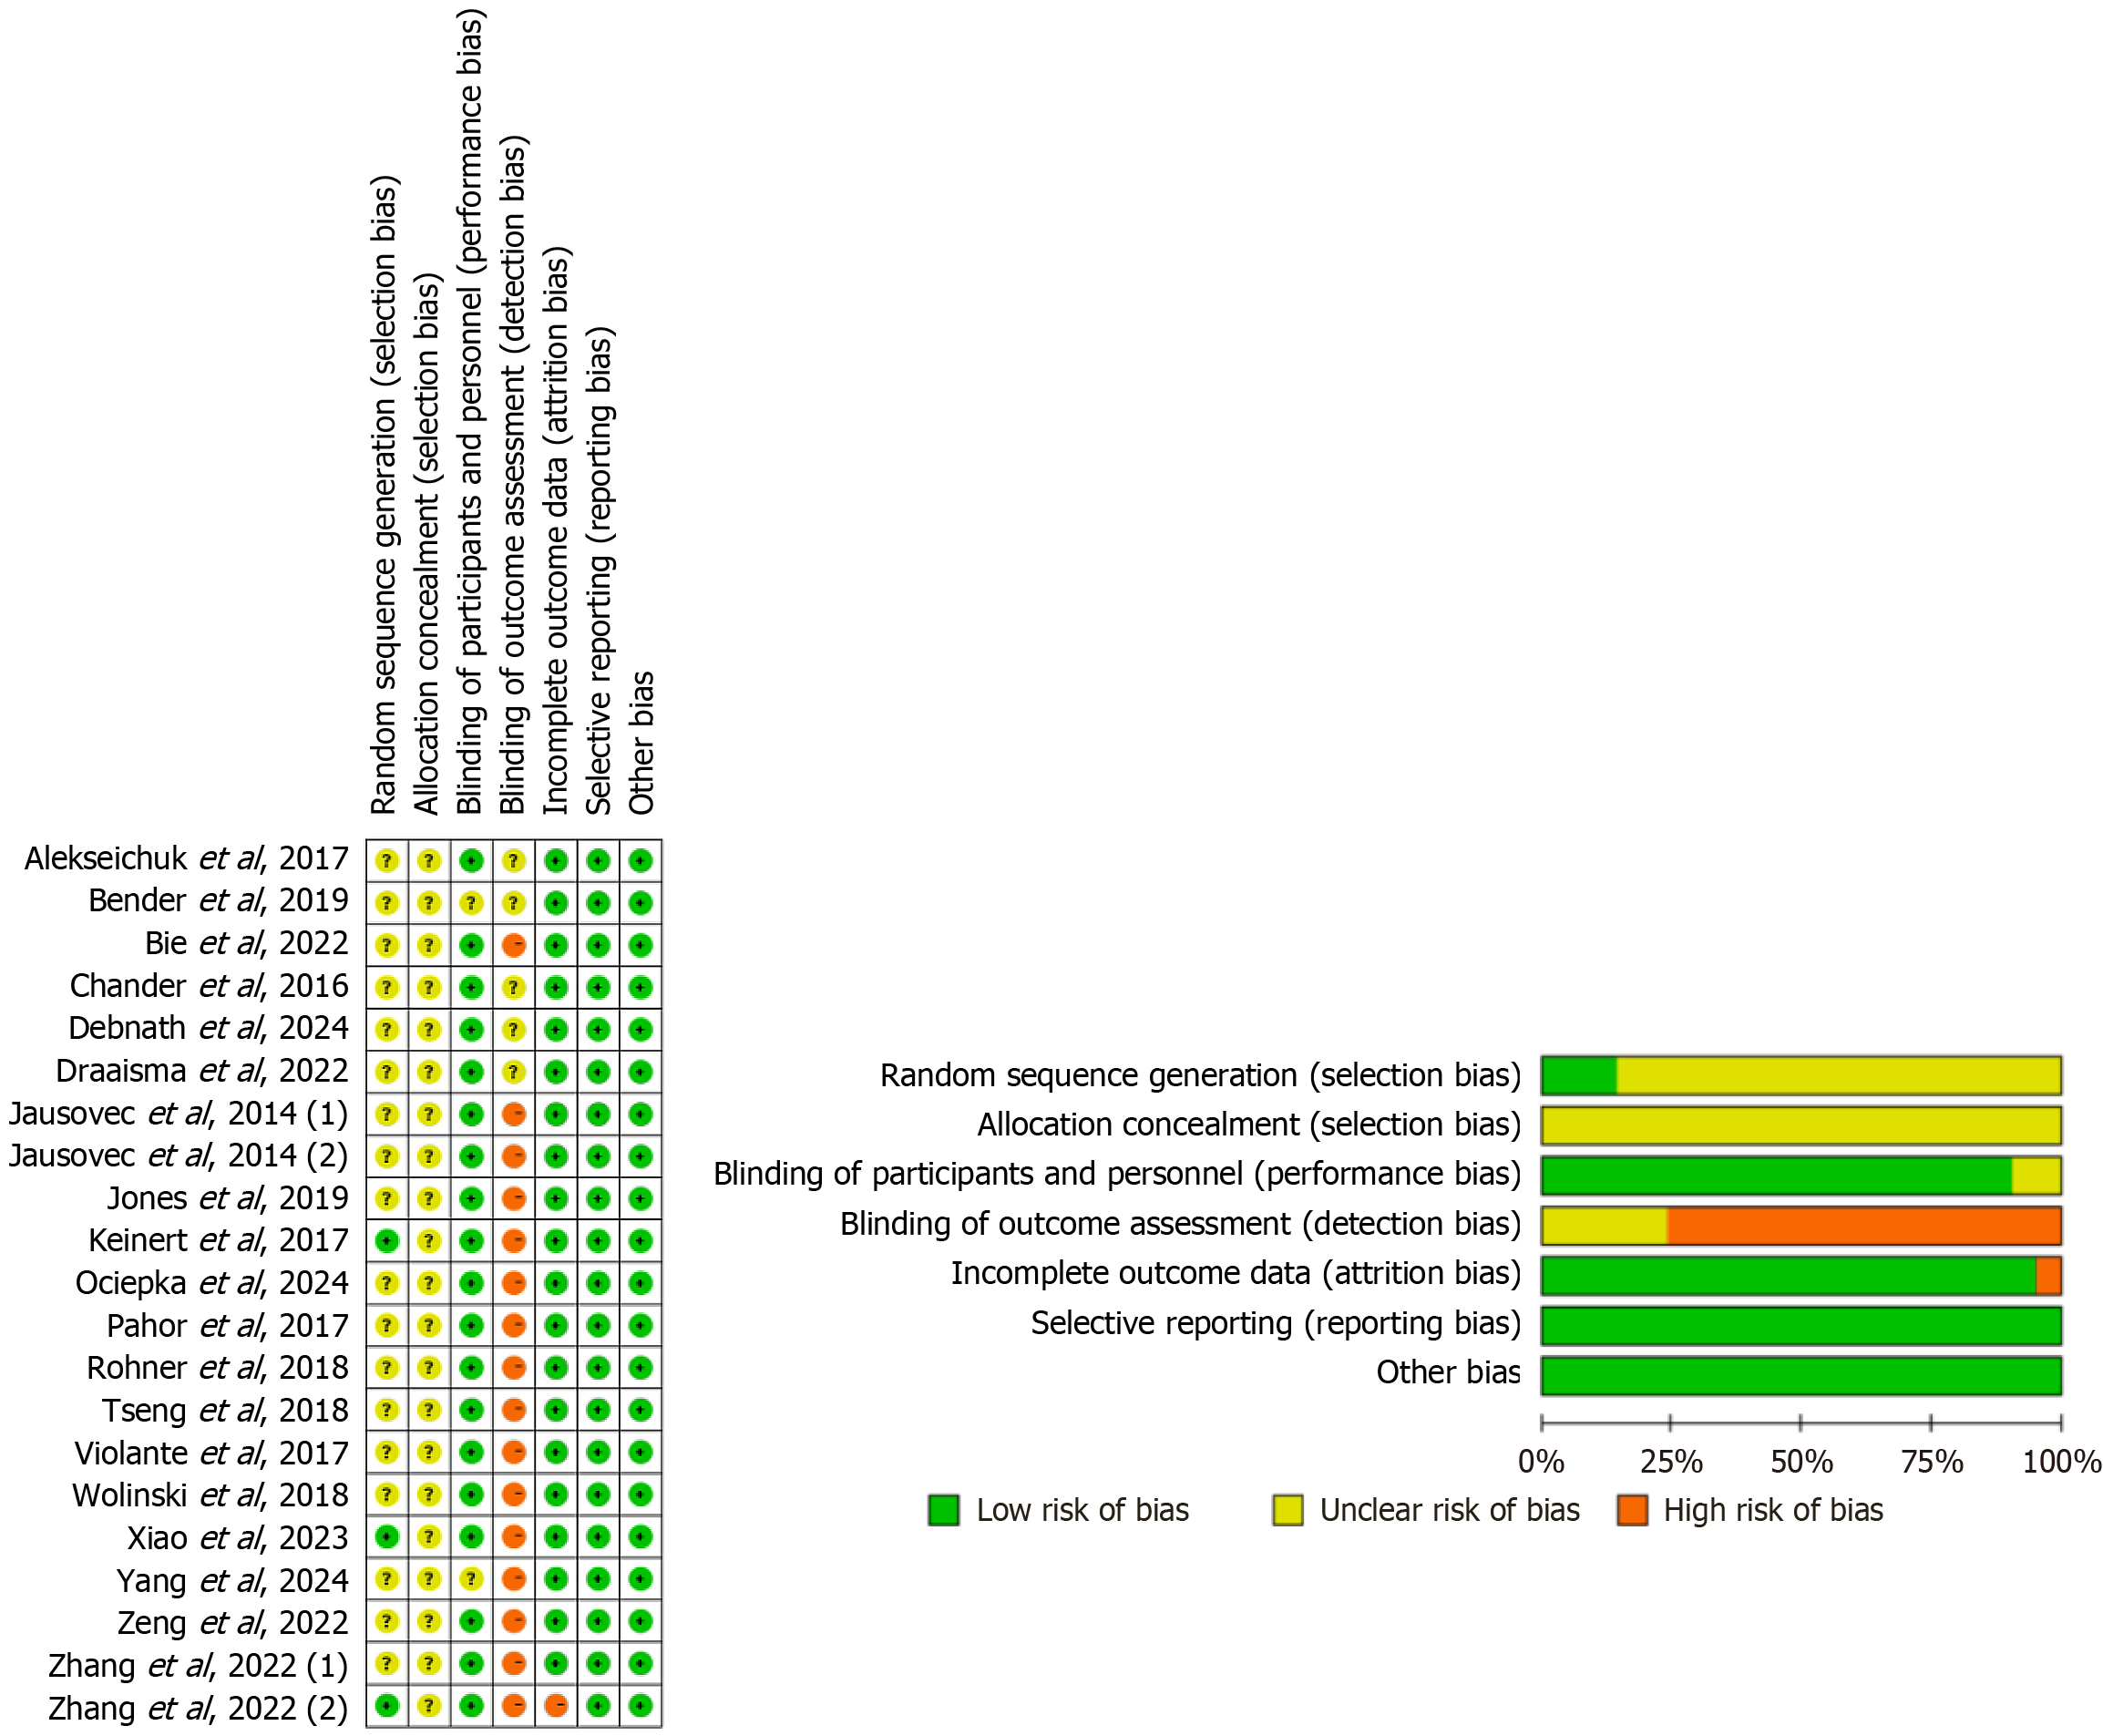
Figure 2
Summary of risk-of-bias for each study and domain.
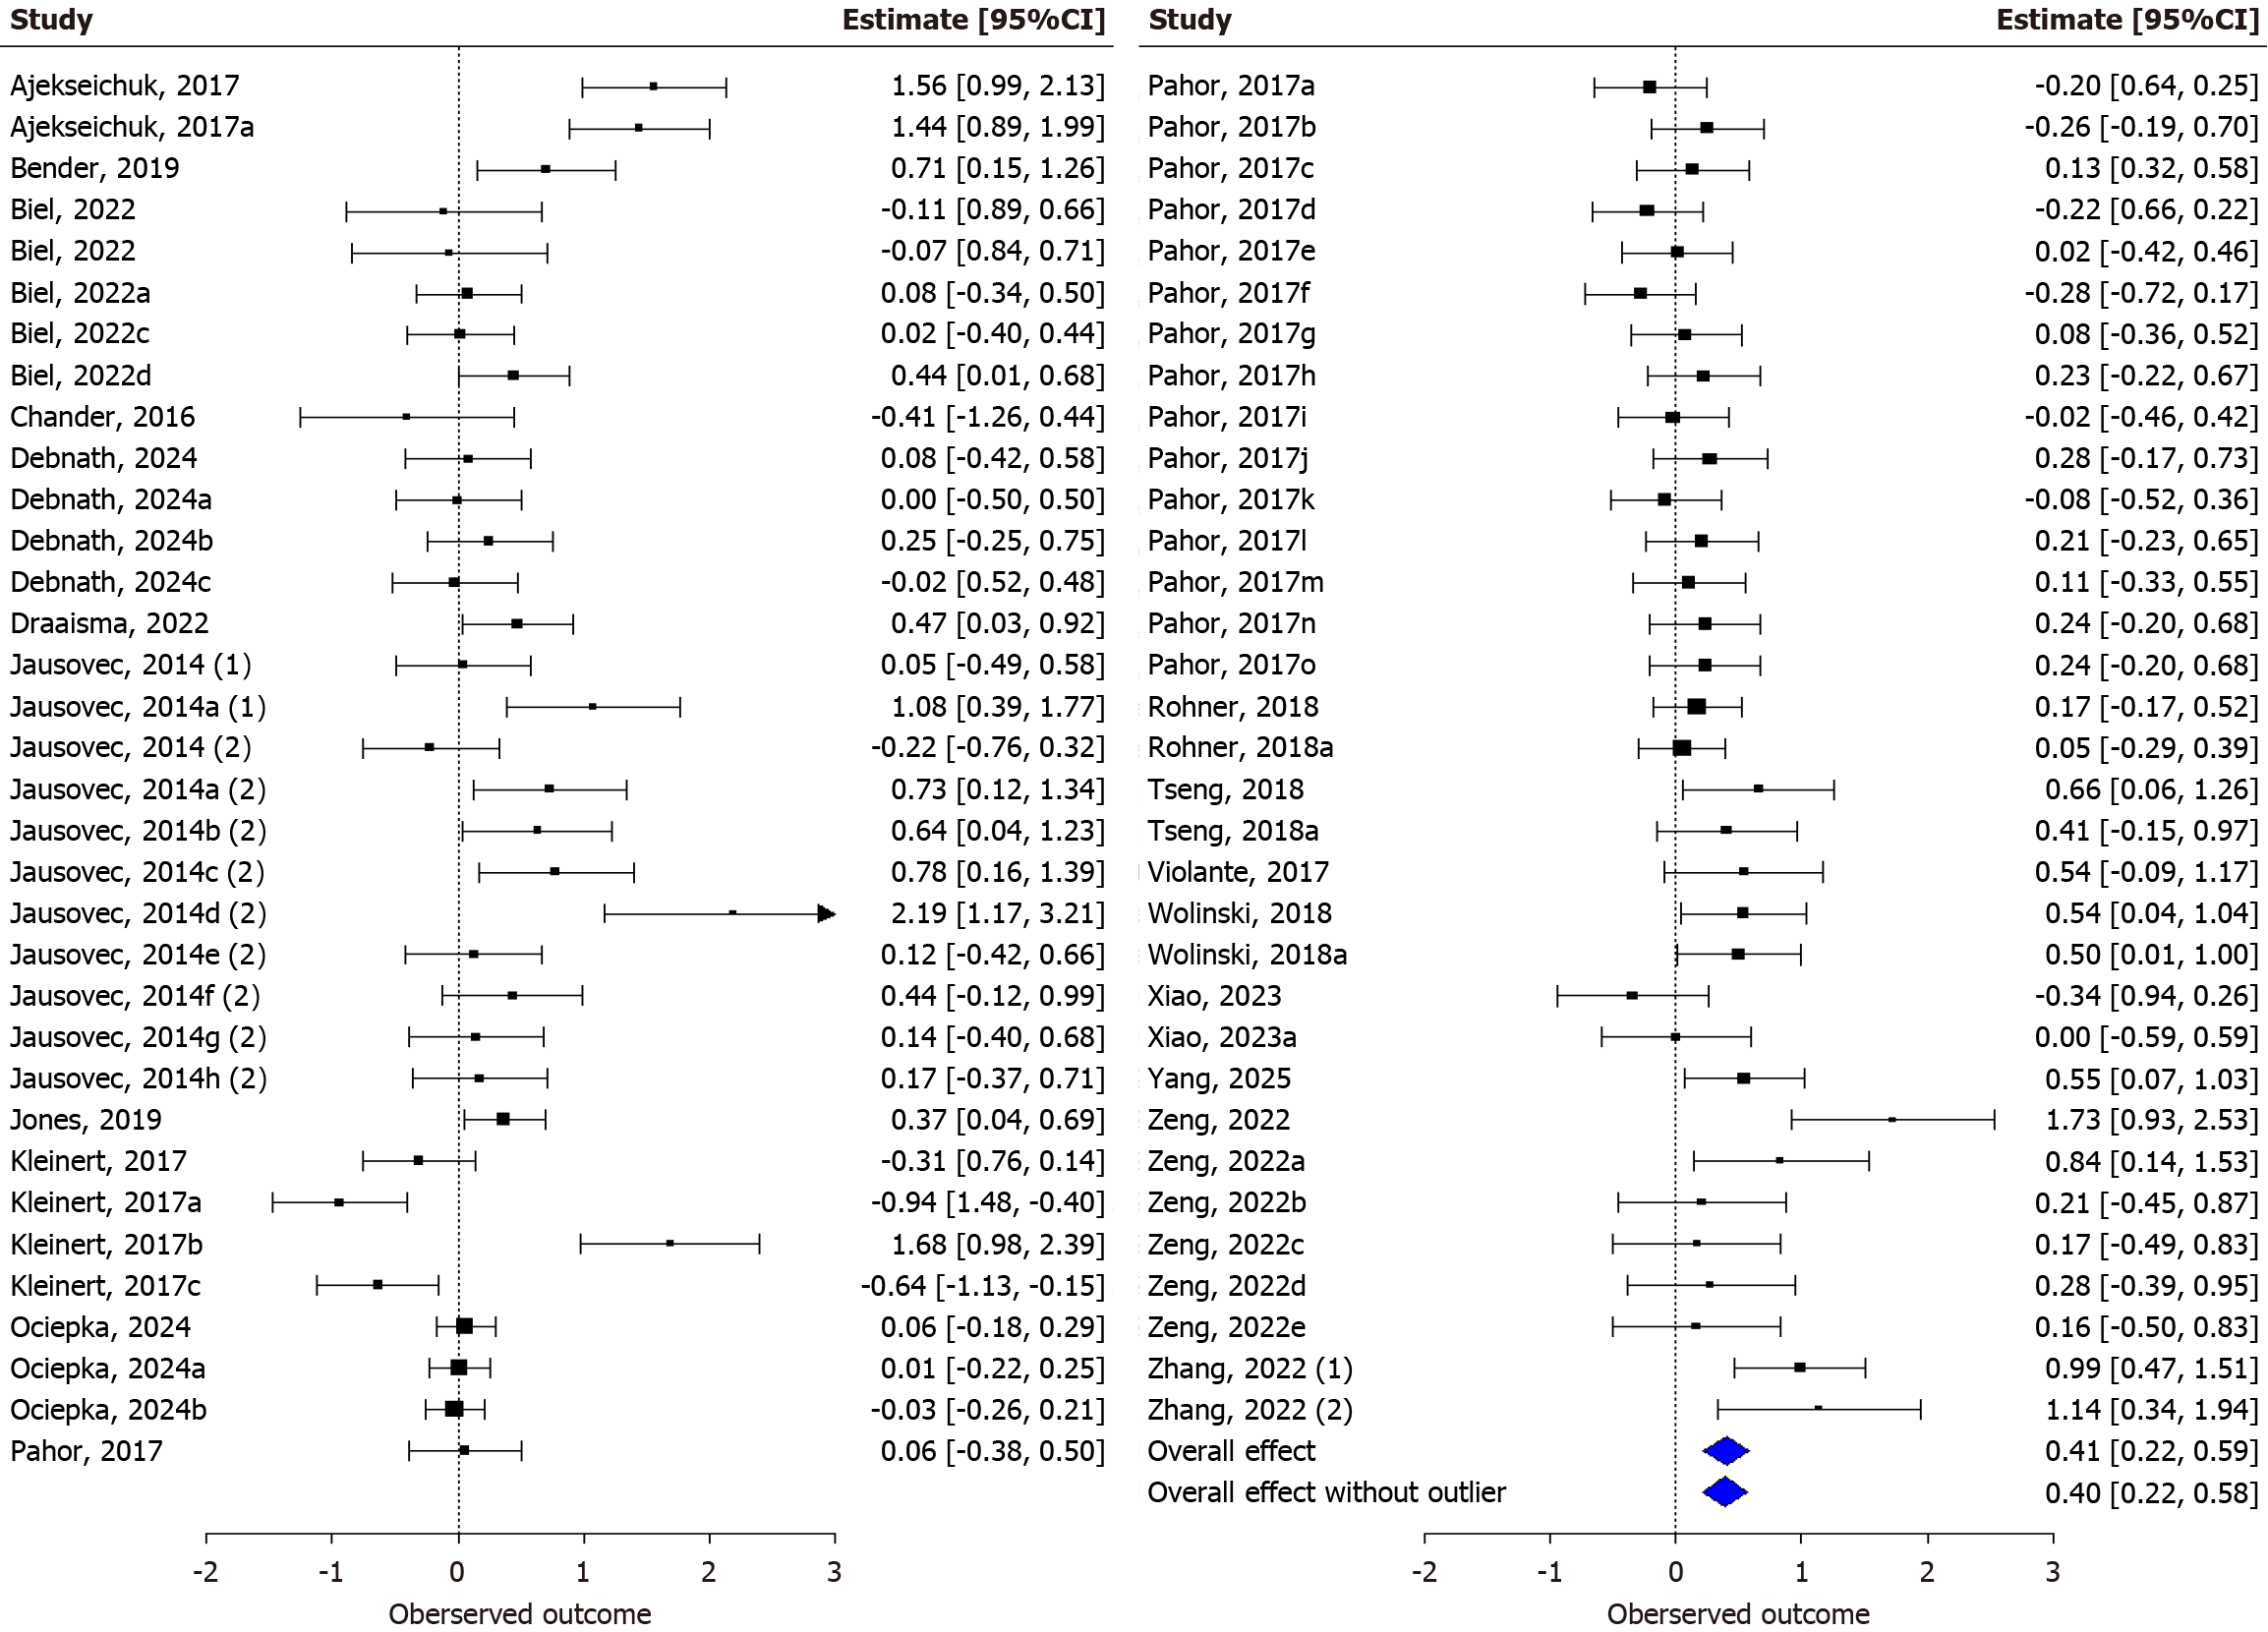
Figure 3 The overall meta-analysis effect size combines the results from all included studies.
The corresponding forest plot illustrates the comparative effects, with values greater than 0 indicating a preference for transcranial alternating current stimulation and values less than 0 indicating a preference for sham stimulation. CI: Confidence interval.
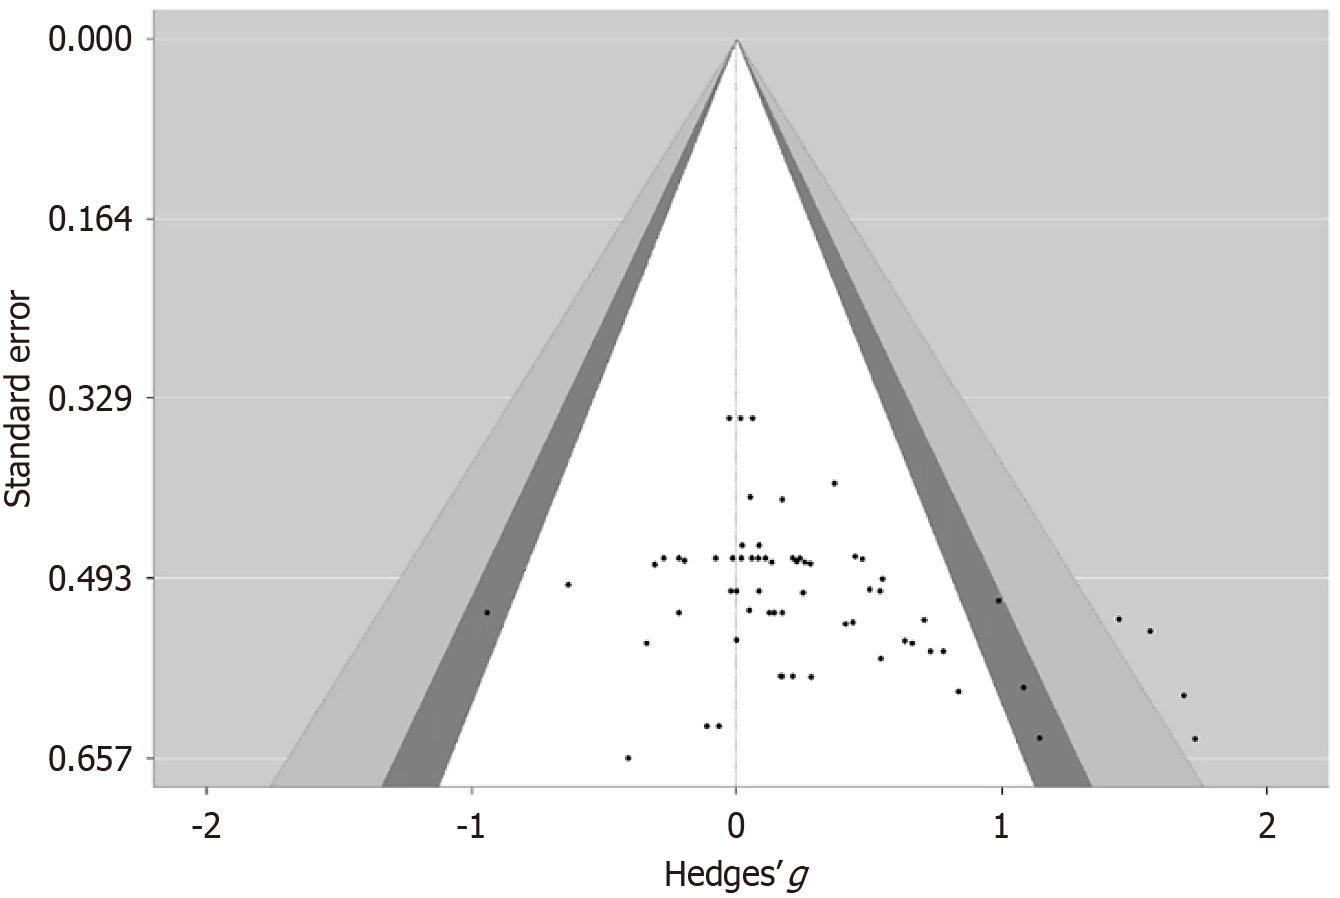
Figure 4
Funnel plot for the transcranial alternating current stimulation effect on working memory.
- Citation: Hou TY, Mao XF, Zhang RK. Effect of theta-transcranial alternating current stimulation on working memory performance among healthy adults: A systematic review and meta-analysis. World J Psychiatry 2025; 15(9): 107754
- URL: https://www.wjgnet.com/2220-3206/full/v15/i9/107754.htm
- DOI: https://dx.doi.org/10.5498/wjp.v15.i9.107754


