Copyright
©The Author(s) 2022.
World J Psychiatry. Jul 19, 2022; 12(7): 915-928
Published online Jul 19, 2022. doi: 10.5498/wjp.v12.i7.915
Published online Jul 19, 2022. doi: 10.5498/wjp.v12.i7.915
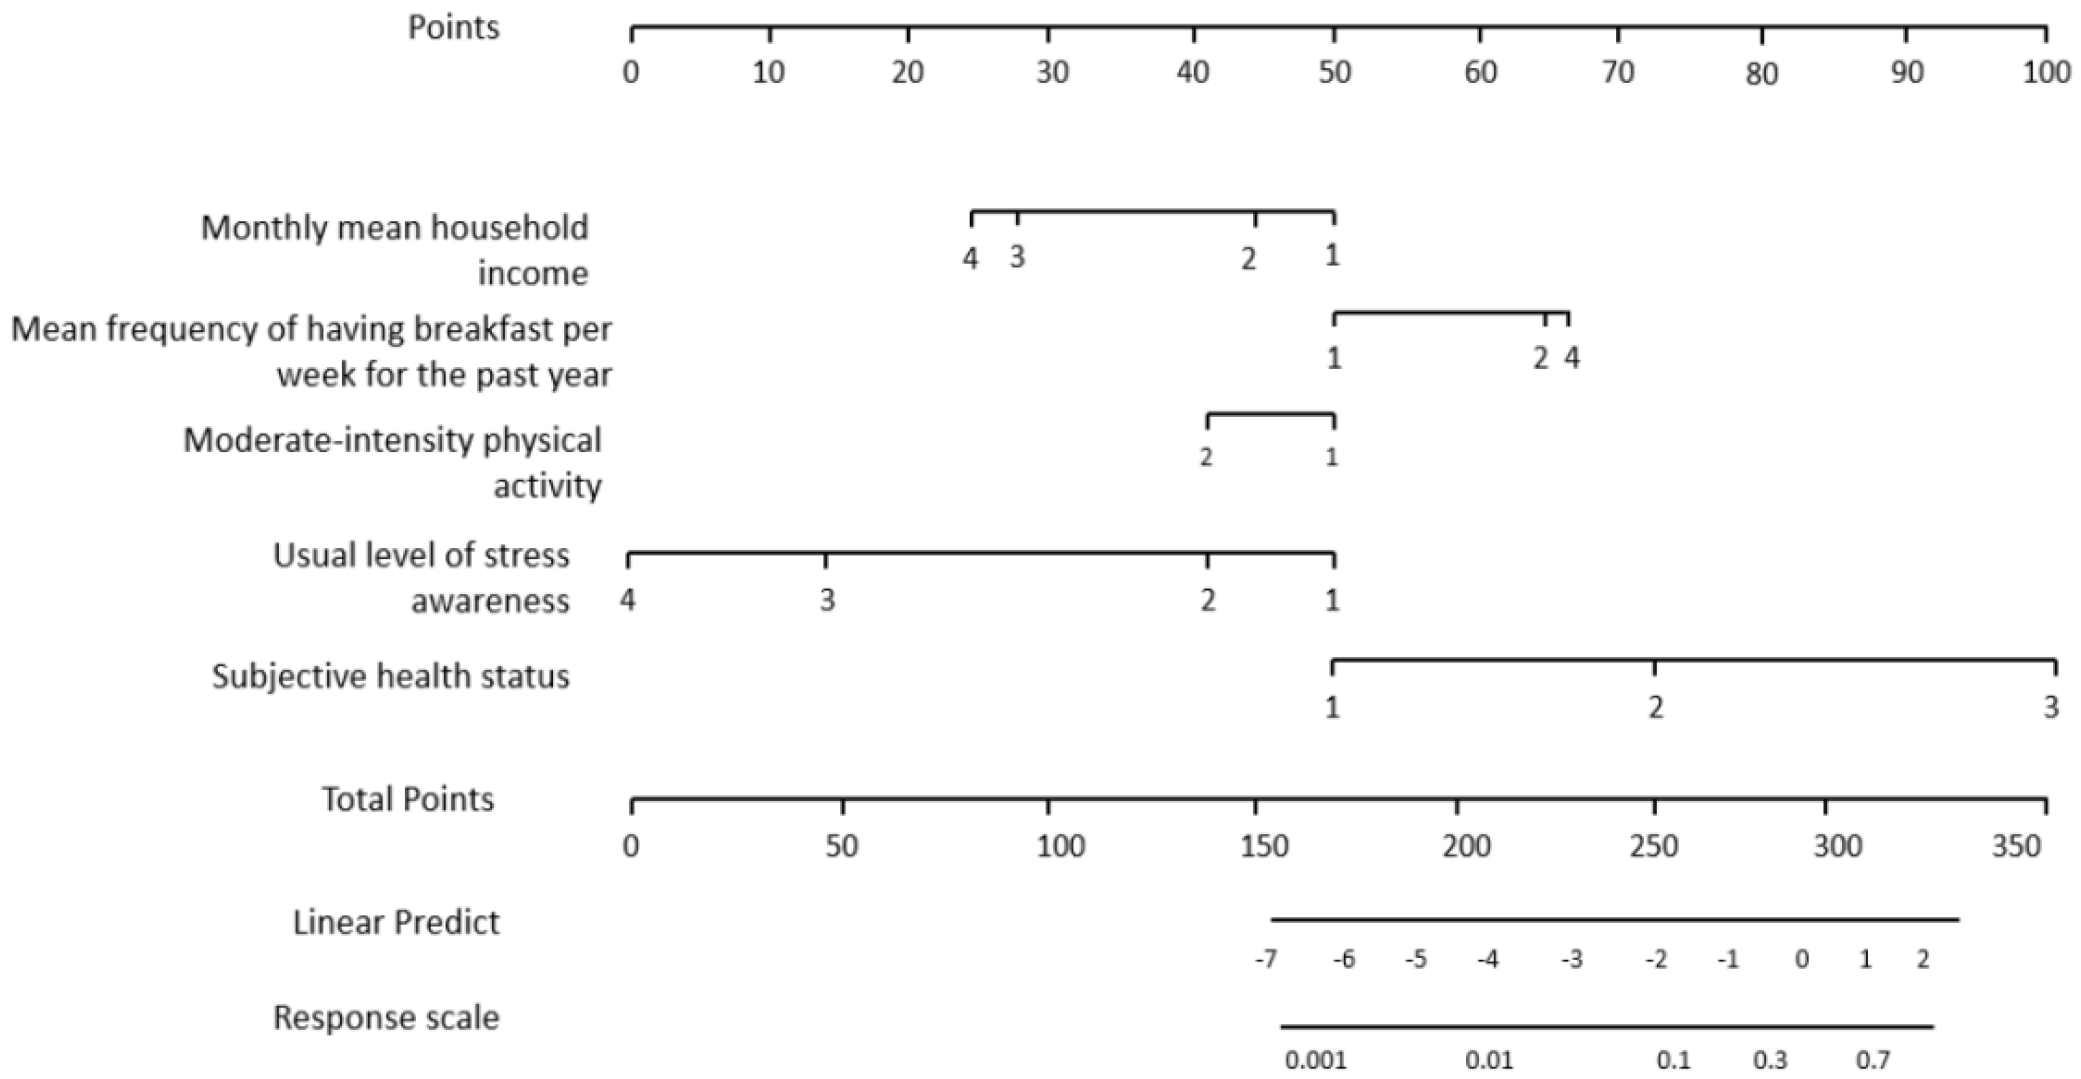
Figure 1 An example of a nomogram[22].
Citation: Byeon H. Developing a nomogram for predicting the depression of senior citizens living alone while focusing on perceived social support. World J Psychiatry 2021; 11: 1314-1327. Copyright ©The Authors 2021. Published by Baishideng Publishing Group Inc.
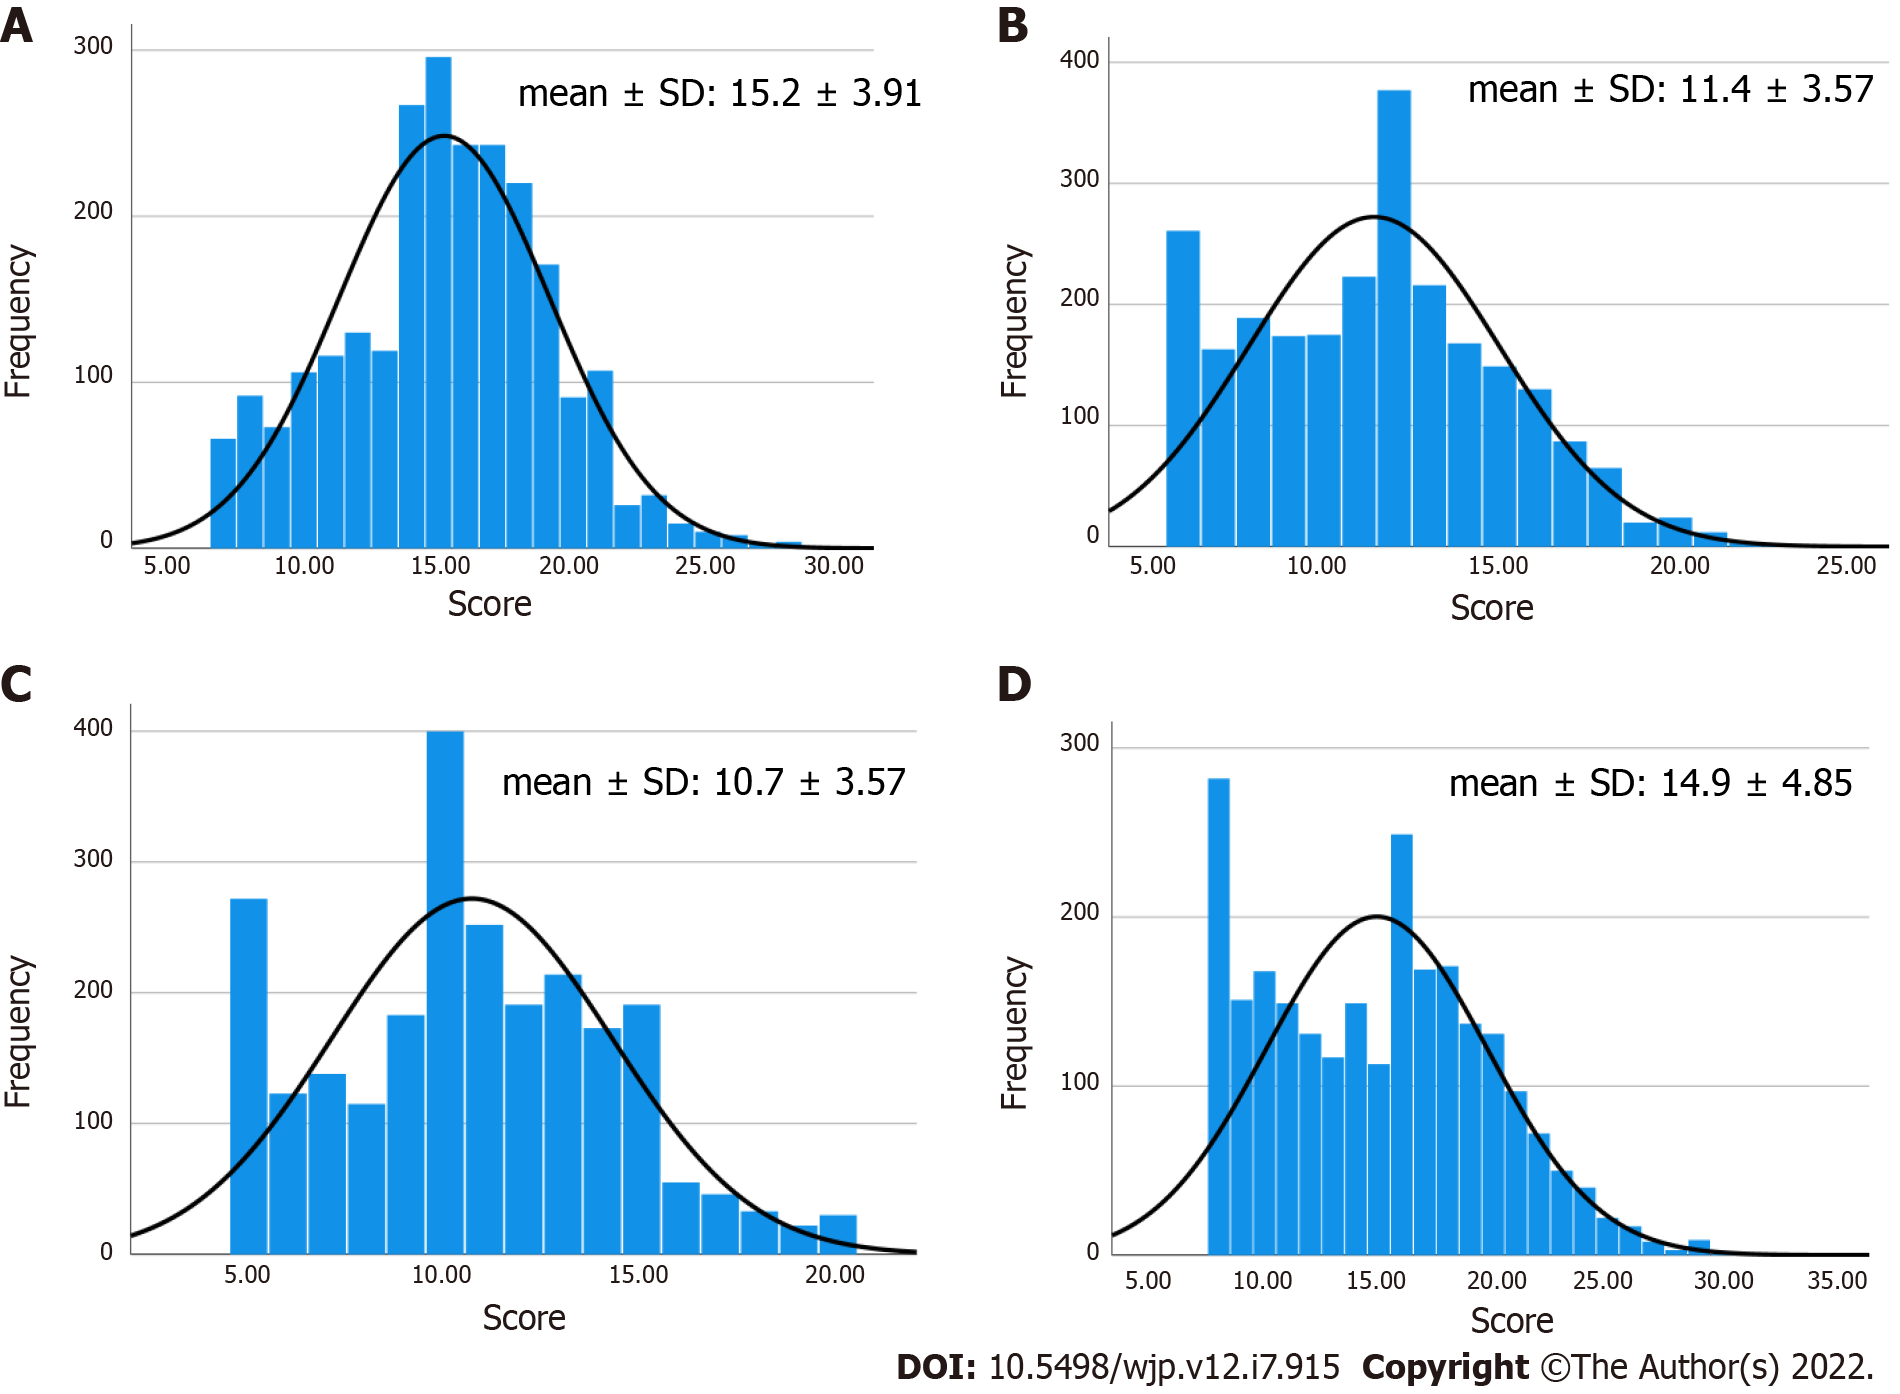
Figure 2 Test results.
A: Subject's attention test; B: Subject's aggression test; C: Subject's social withdrawal test; D: Subject's physical symptoms test.
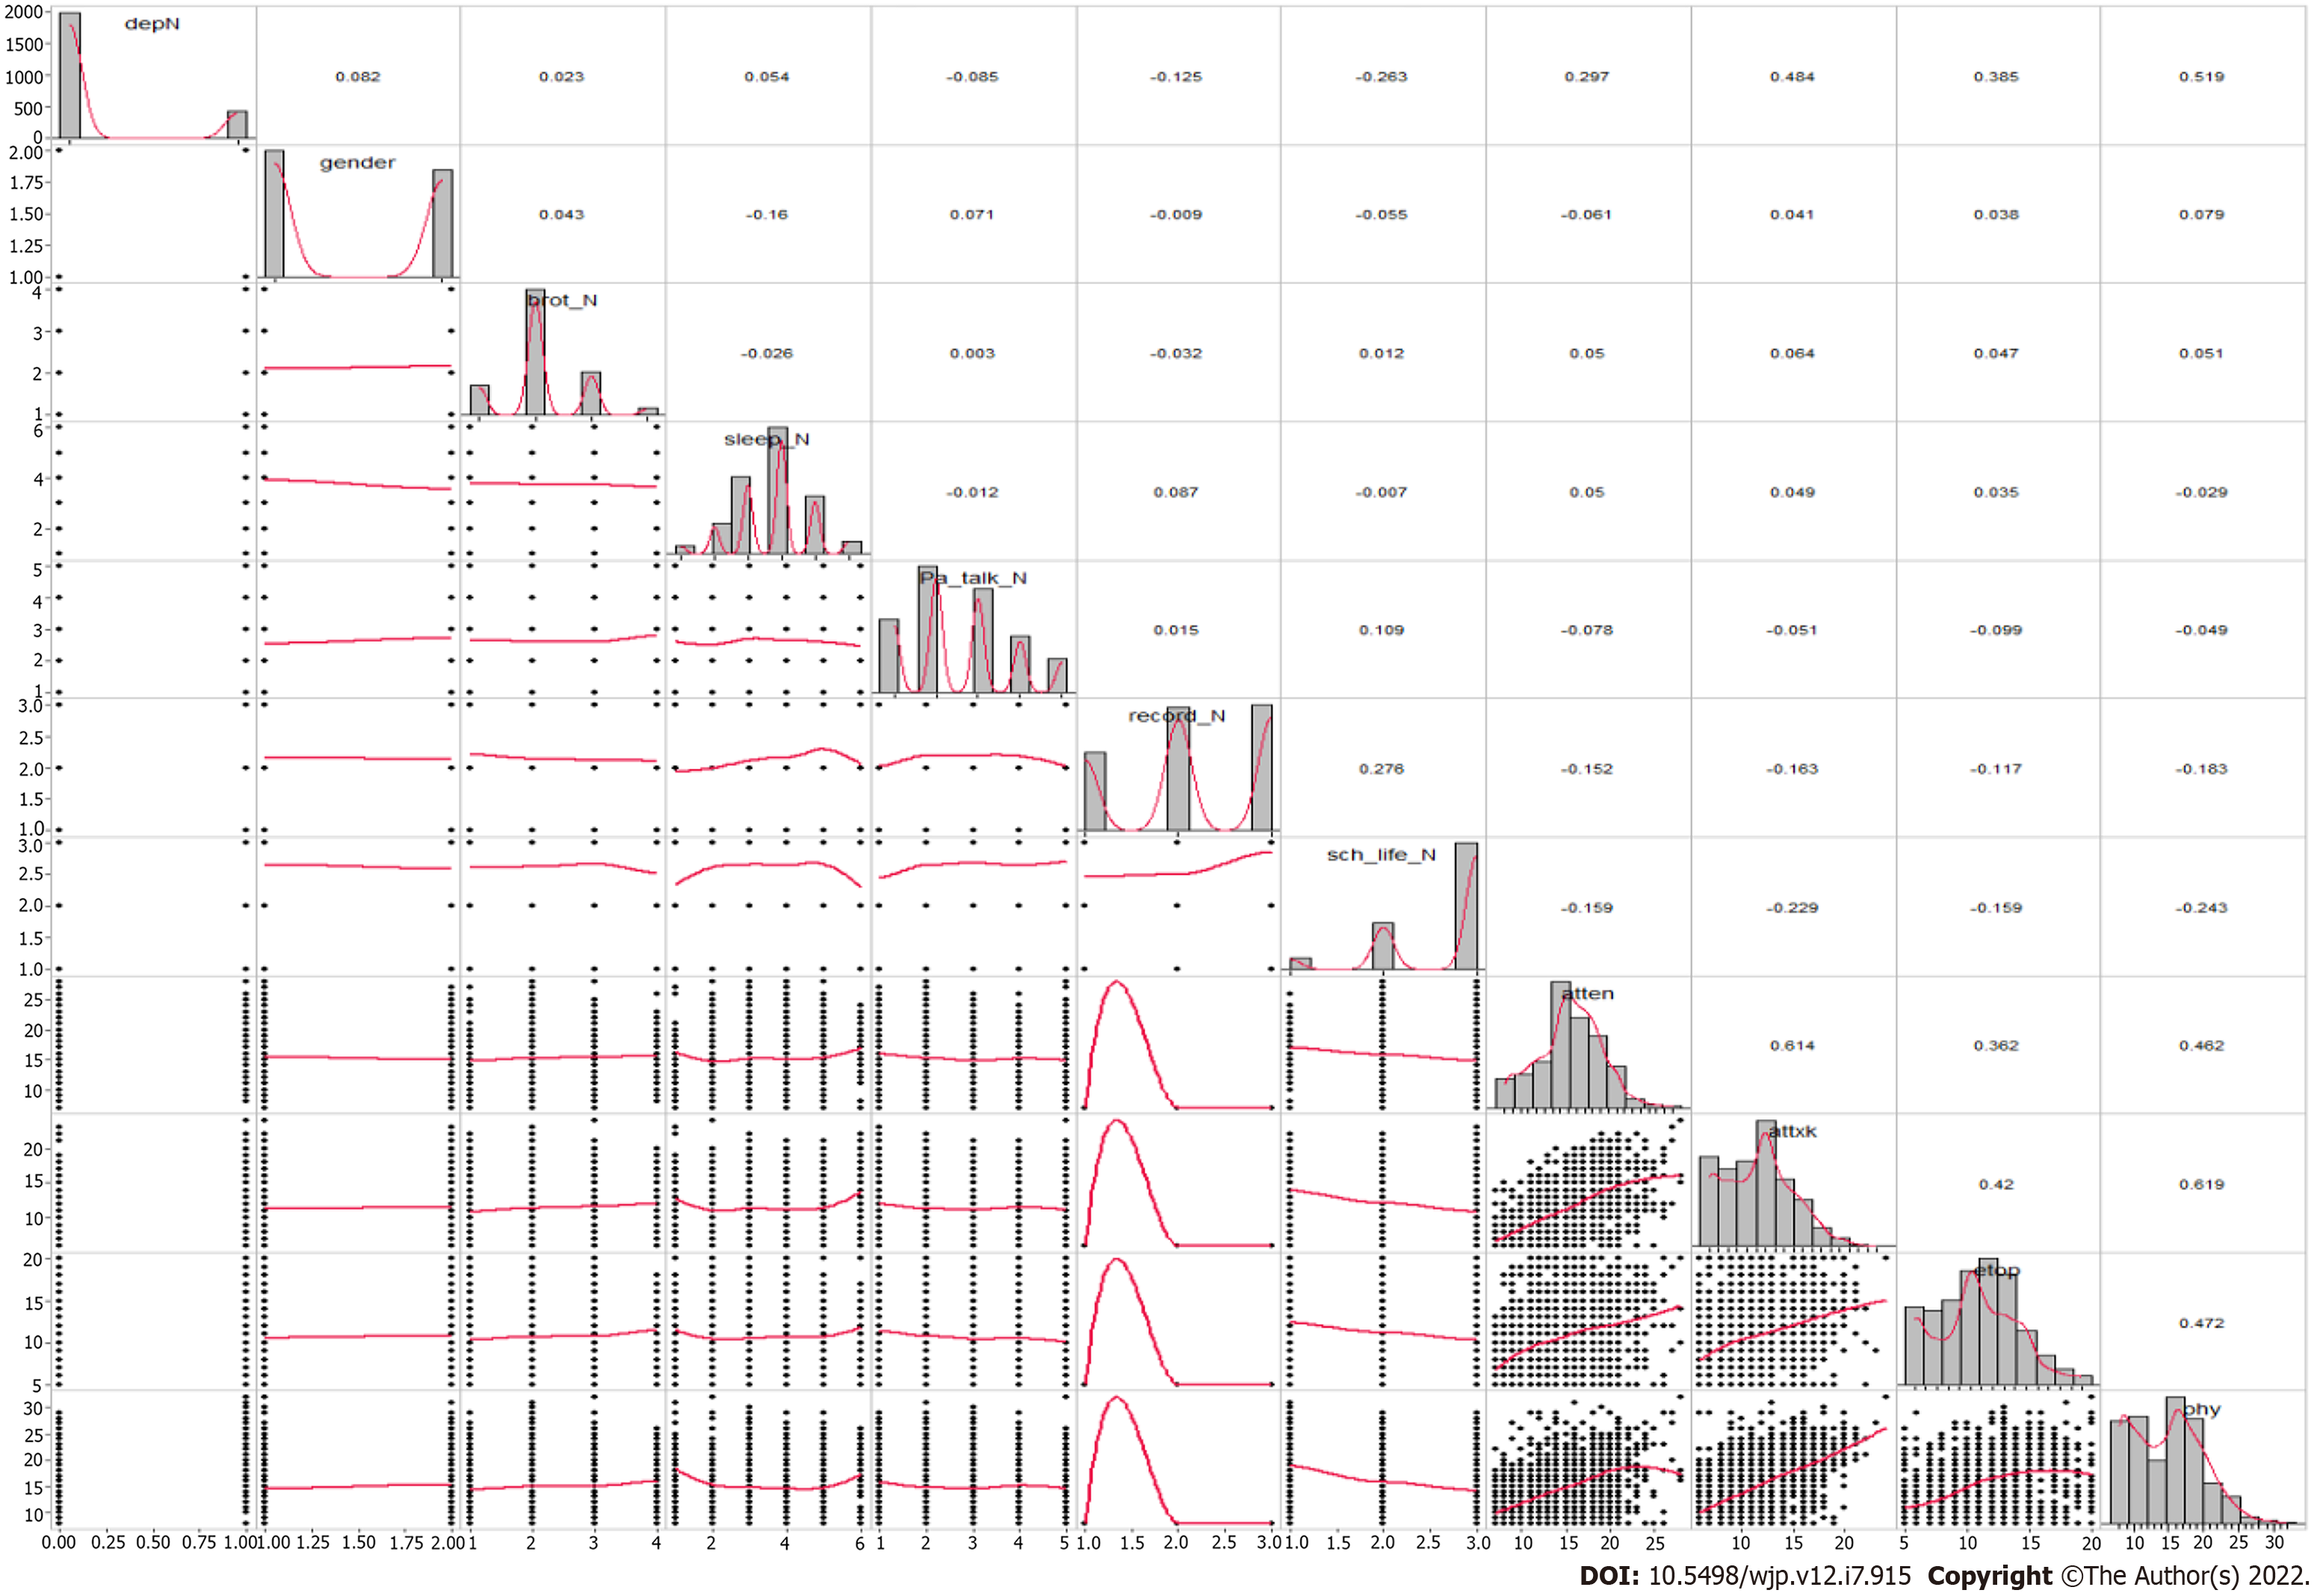
Figure 3 Correlation between variables: Scatter matrix.
depN: Depressive disorder; brot_n: Number of siblings; sleep_N: Mean sleeping hours per day; Pa_talk_N: Mean conversation time with parents per day; record_N: Satisfaction with academic achievement; sch_life_N: Satisfaction with school life; atten: Attention; attxk: Aggression; etop: Social withdrawal; phy: Physical symptoms.
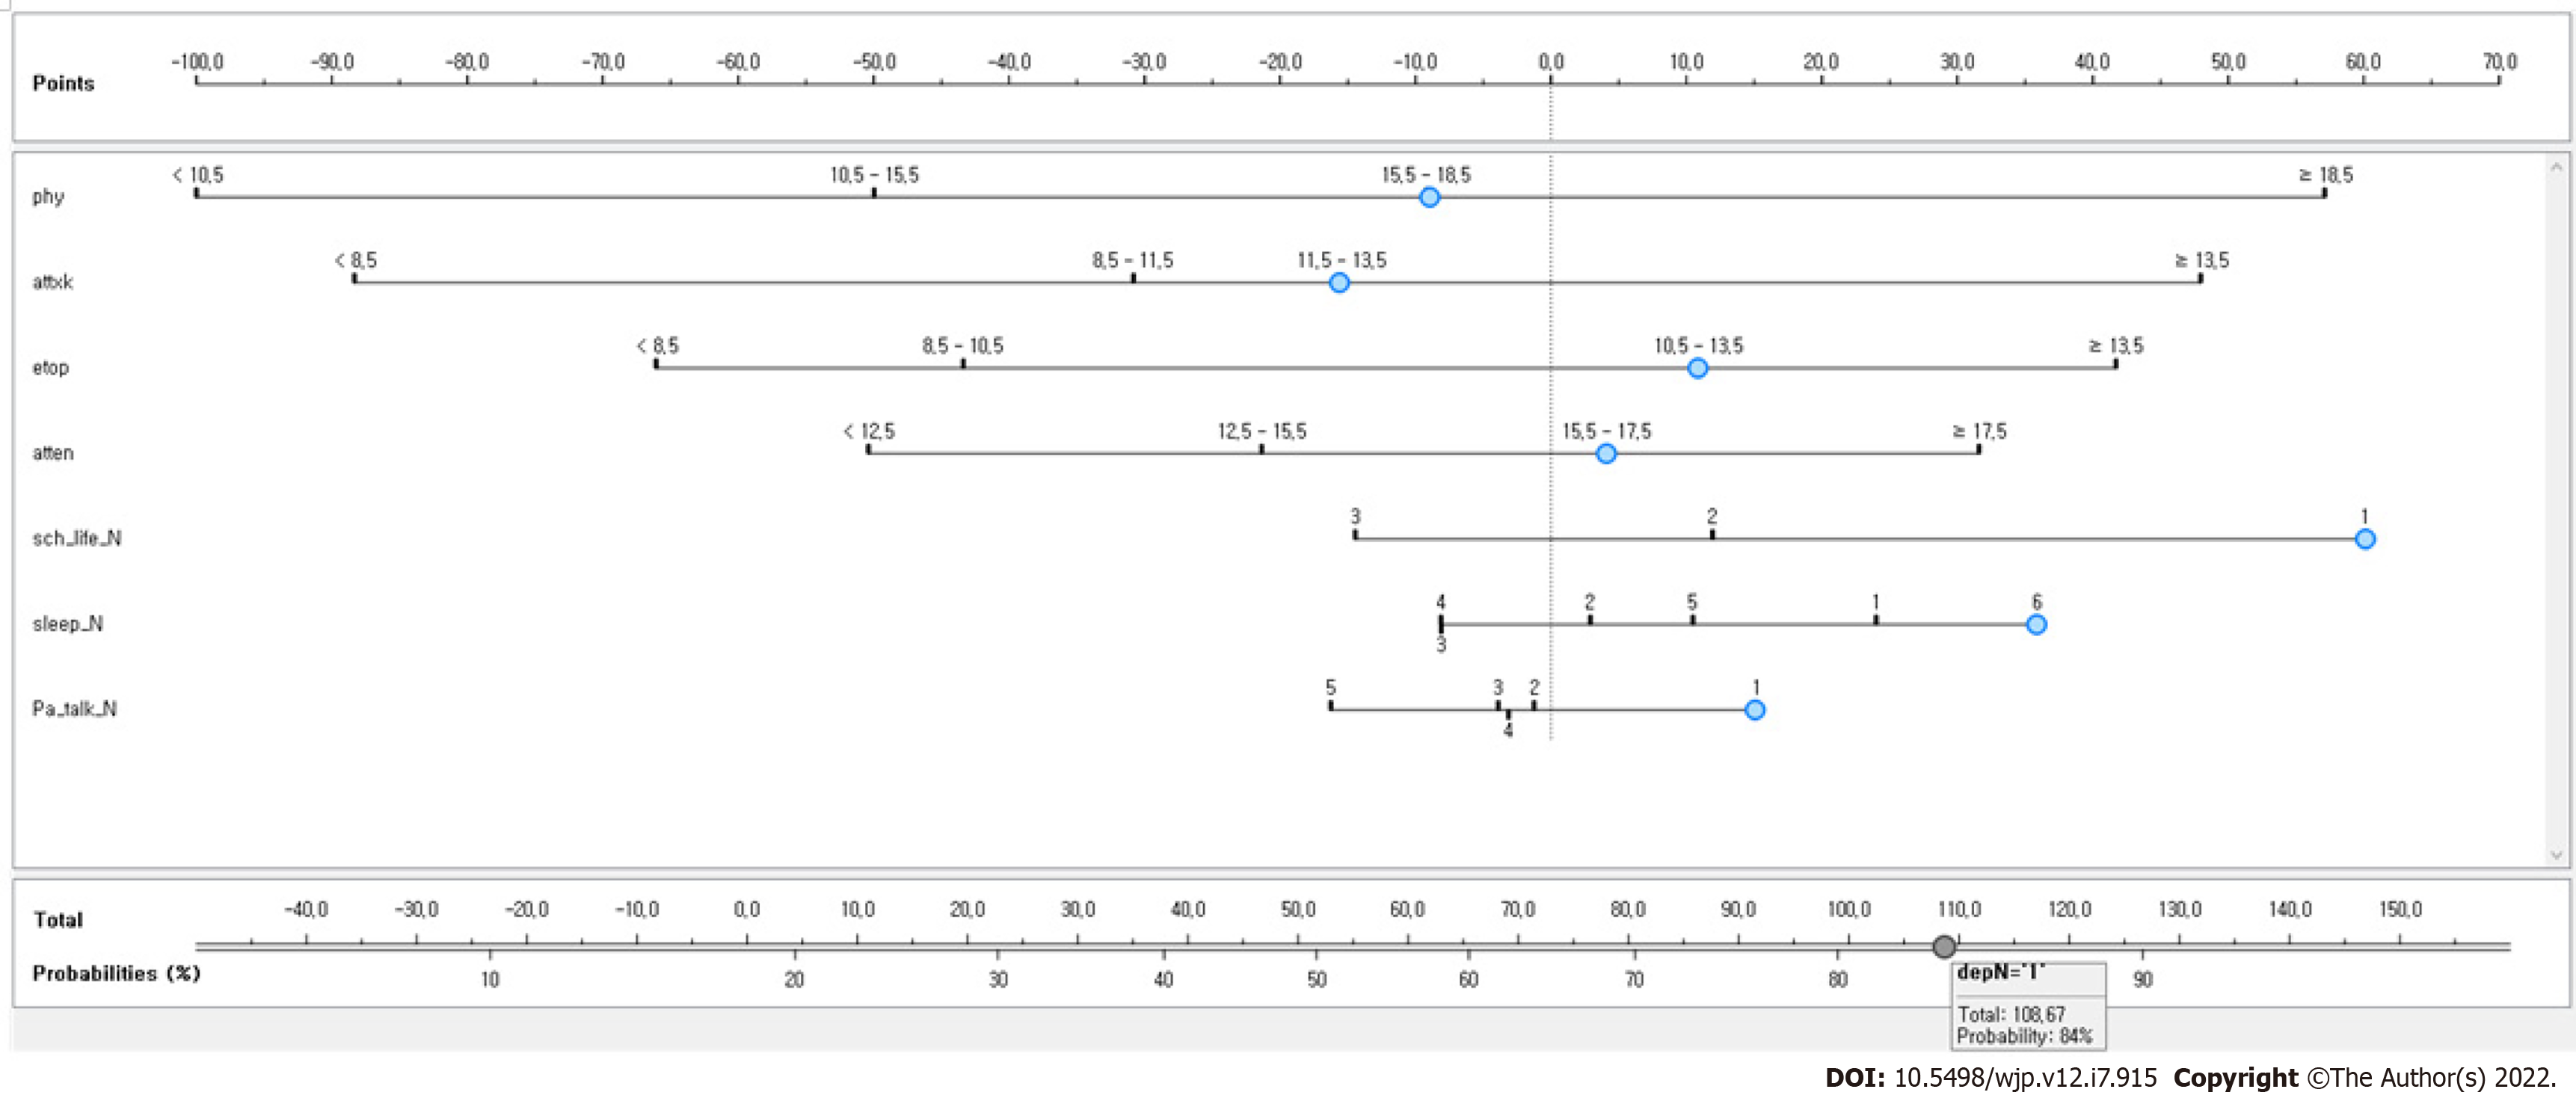
Figure 4 A model for predicting adolescent groups vulnerable to depressive disorder by using Bayesian nomograms.
phy: Physical symptoms; attxk: Aggression; etop: Social withdrawal; atten: Attention; sch_life_N: Satisfaction with school life (1 = dissatisfied, 2 = not dissatisfied or satisfied, 3 = satisfied); Pa_talk_N: Mean conversation time with parents per day (1: < 30 min, 2: ≥ 30 min and < 1 h, 3: ≥ 1 h and < 2 h, 4: ≥ 2 h and < 3 h; 5: ≥ 3 h).
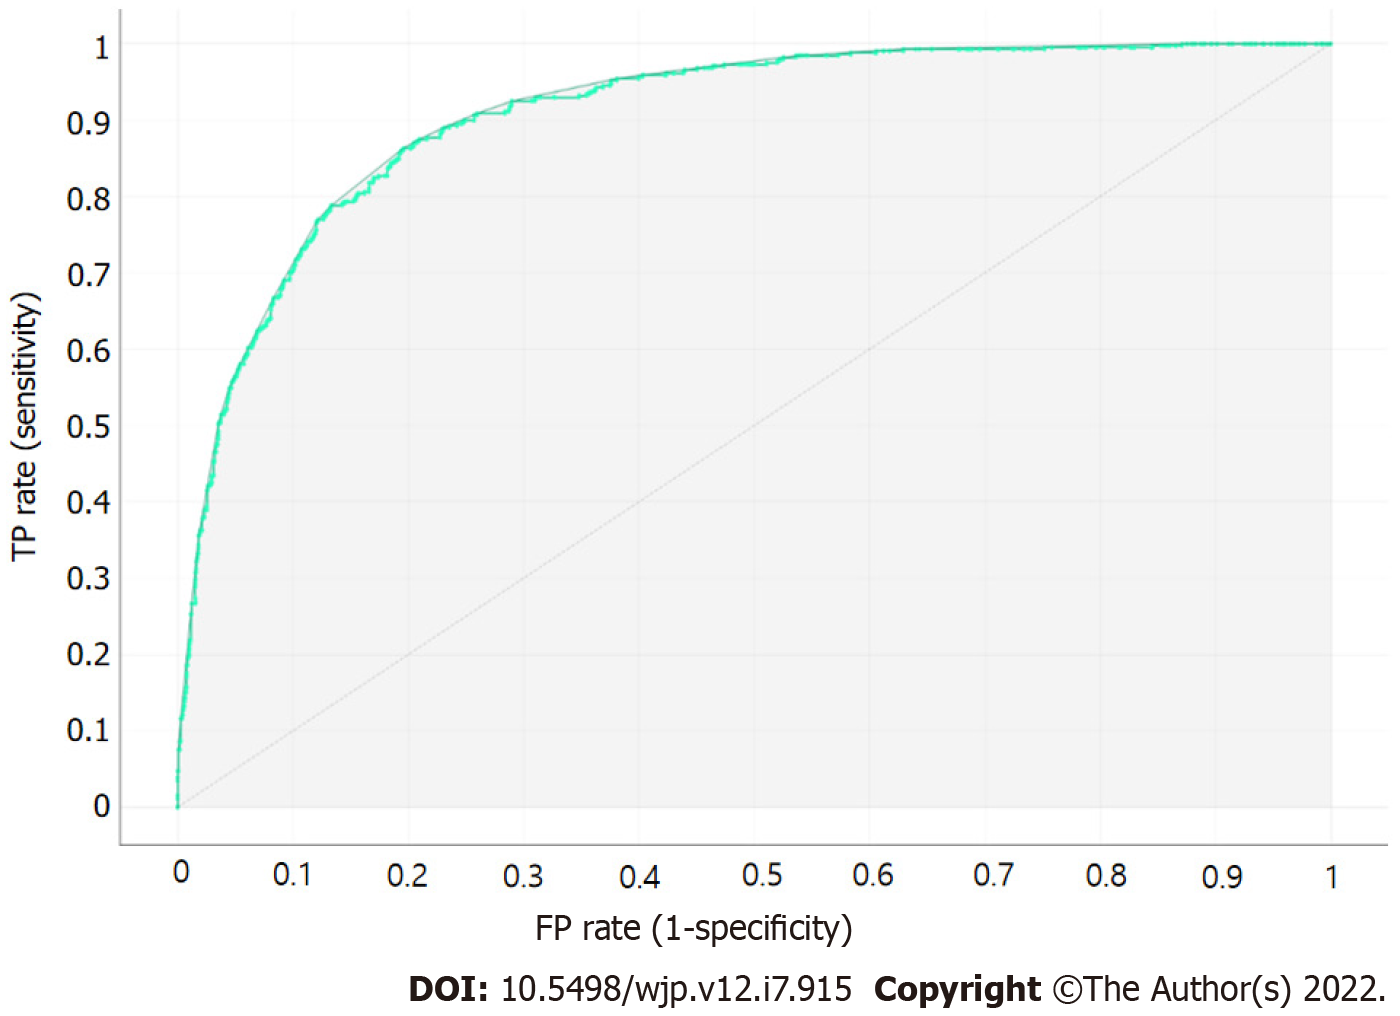
Figure 5
Receiver operating characteristic analysis result of the developed model.
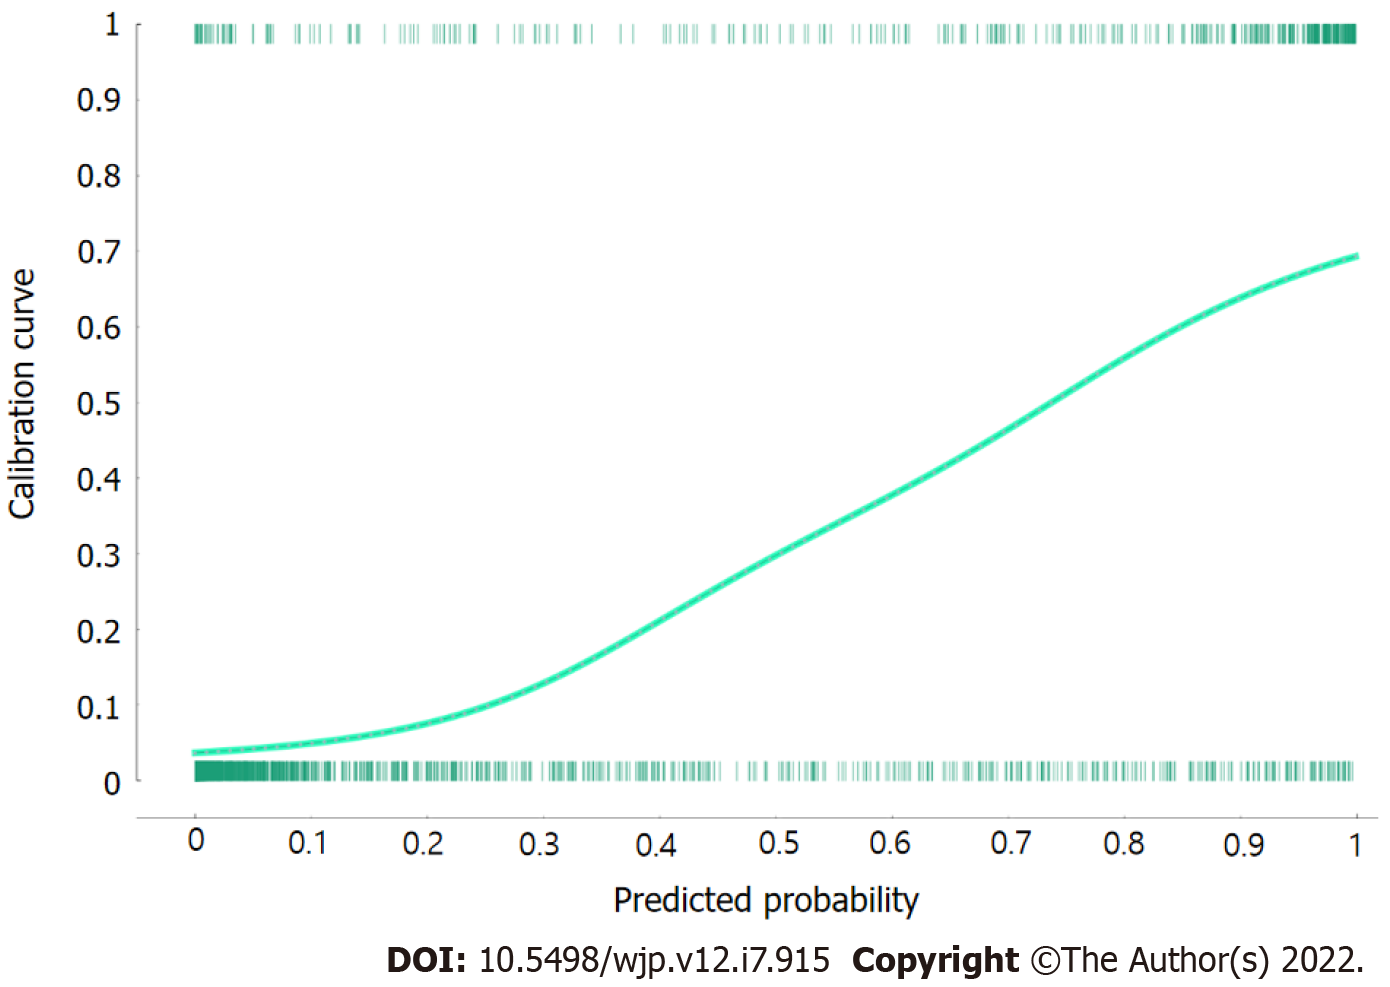
Figure 6
Calibration plot comparing predicted to actual probability of depressive disorder.
- Citation: Byeon H. Predicting South Korea adolescents vulnerable to depressive disorder using Bayesian nomogram: A community-based cross-sectional study. World J Psychiatry 2022; 12(7): 915-928
- URL: https://www.wjgnet.com/2220-3206/full/v12/i7/915.htm
- DOI: https://dx.doi.org/10.5498/wjp.v12.i7.915


