Copyright
©The Author(s) 2022.
World J Psychiatry. May 19, 2022; 12(5): 722-738
Published online May 19, 2022. doi: 10.5498/wjp.v12.i5.722
Published online May 19, 2022. doi: 10.5498/wjp.v12.i5.722
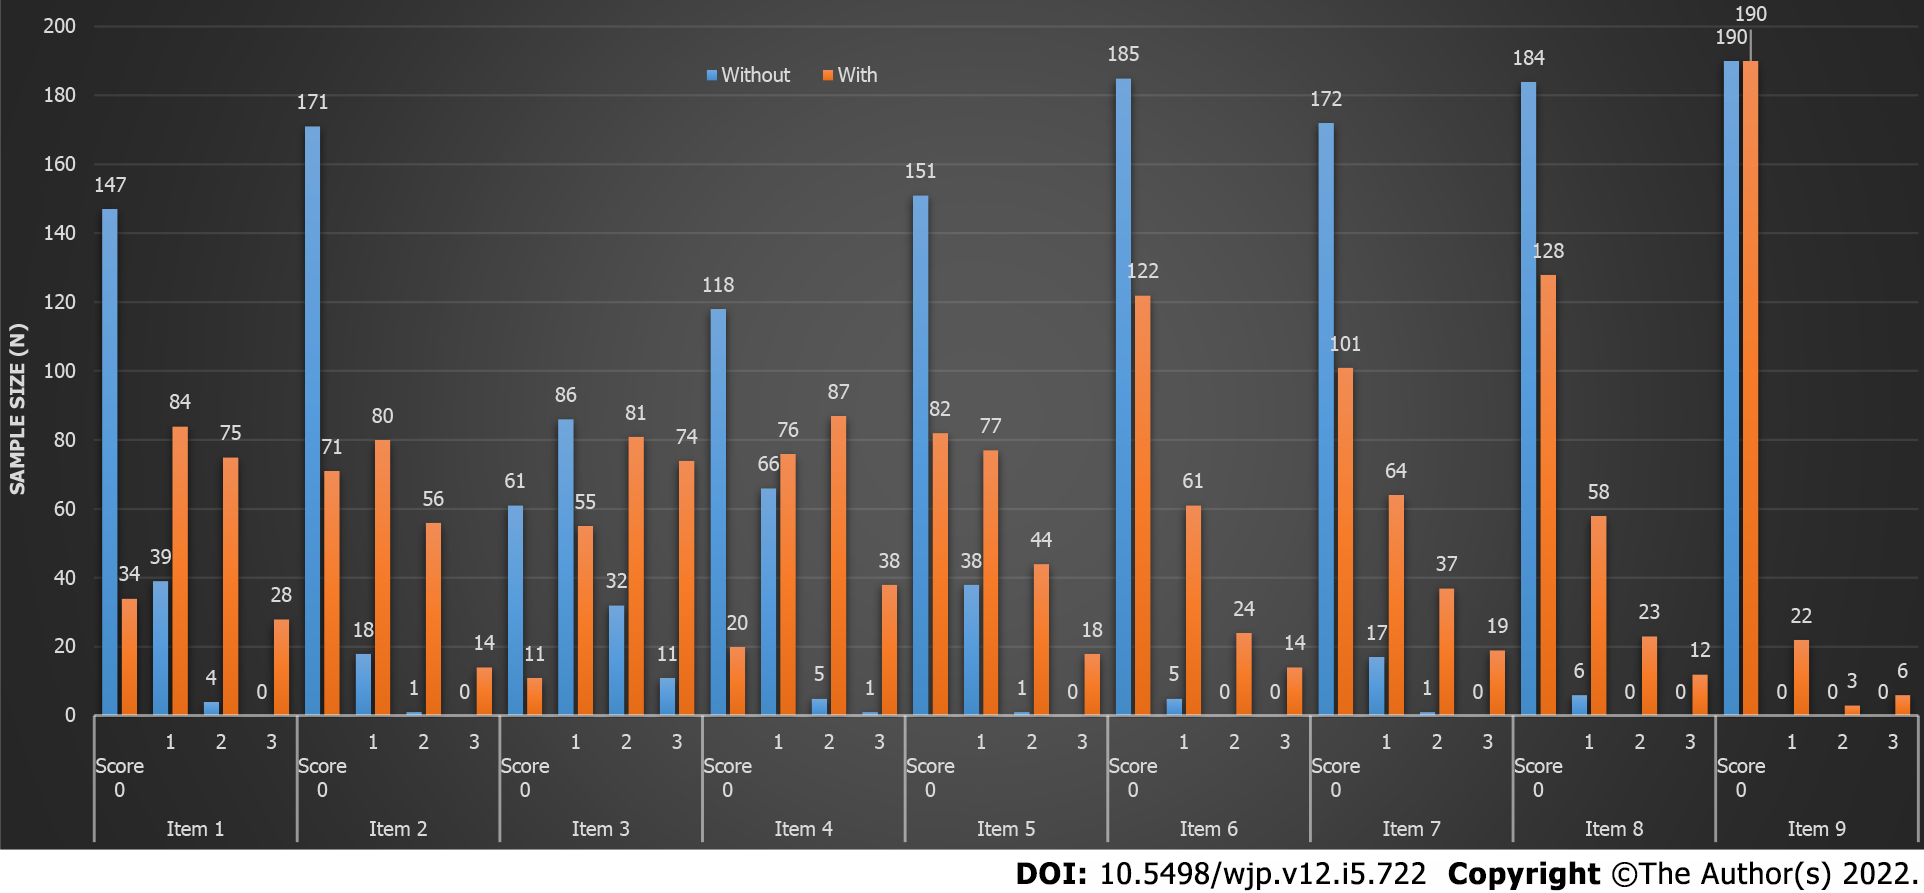
Figure 1 Comparison of the 9 items of Patient Health Questionnaire-9 in the without depression group and with depression group.
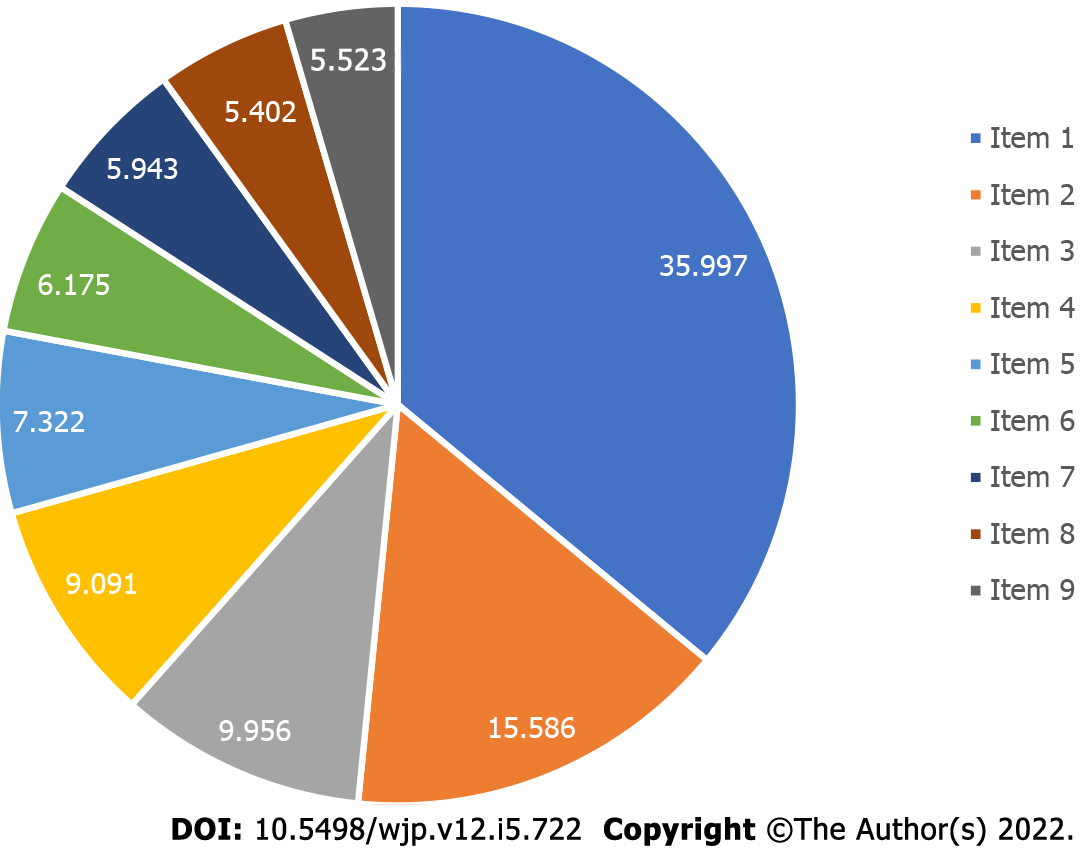
Figure 2 The contributing rate of 9 items of Patient Health Questionnaire-9 to depression (%).
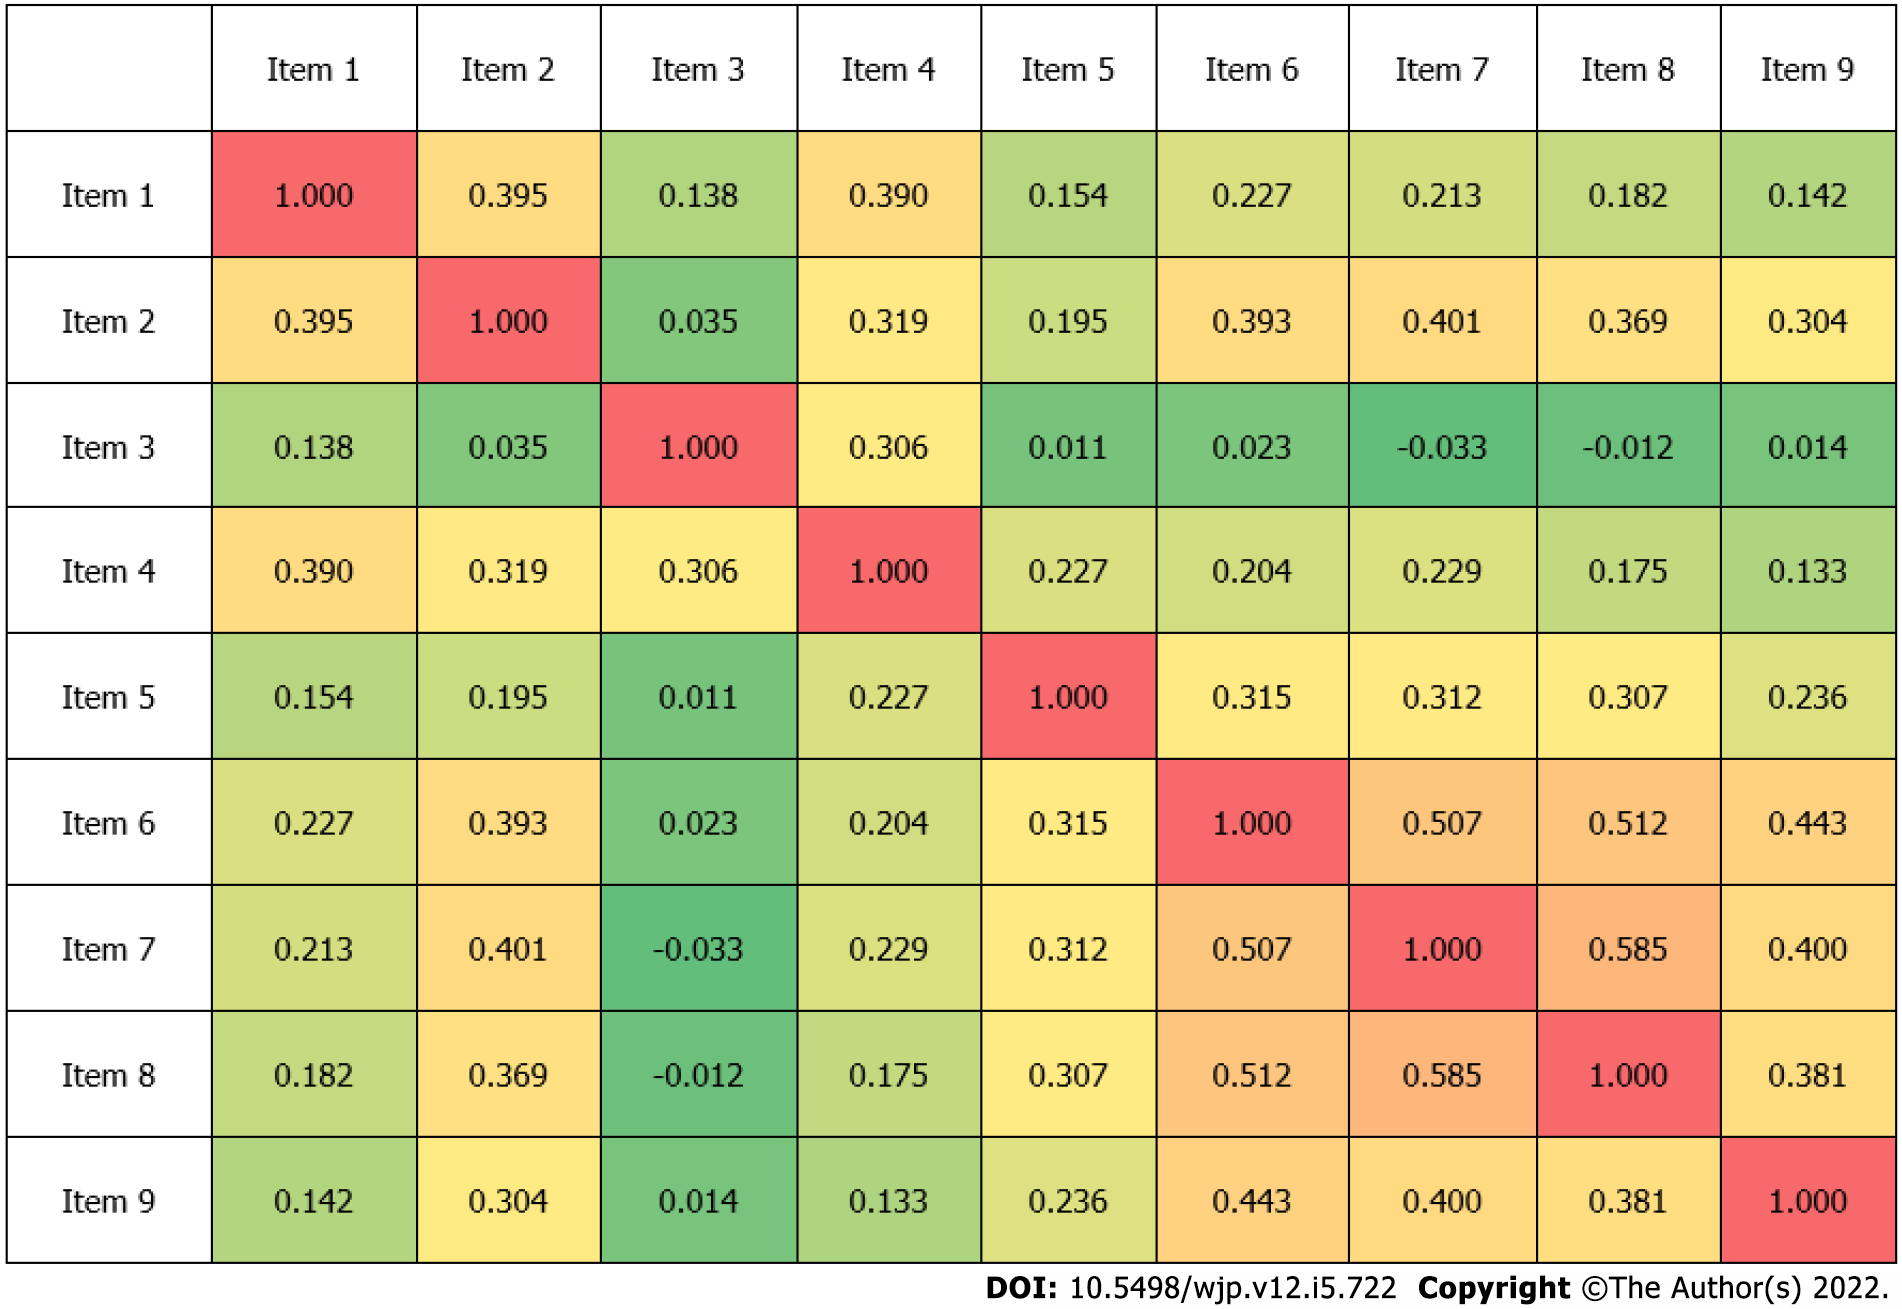
Figure 3 The correlation coefficient of the 9 items of Patient Health Questionnaire-9.
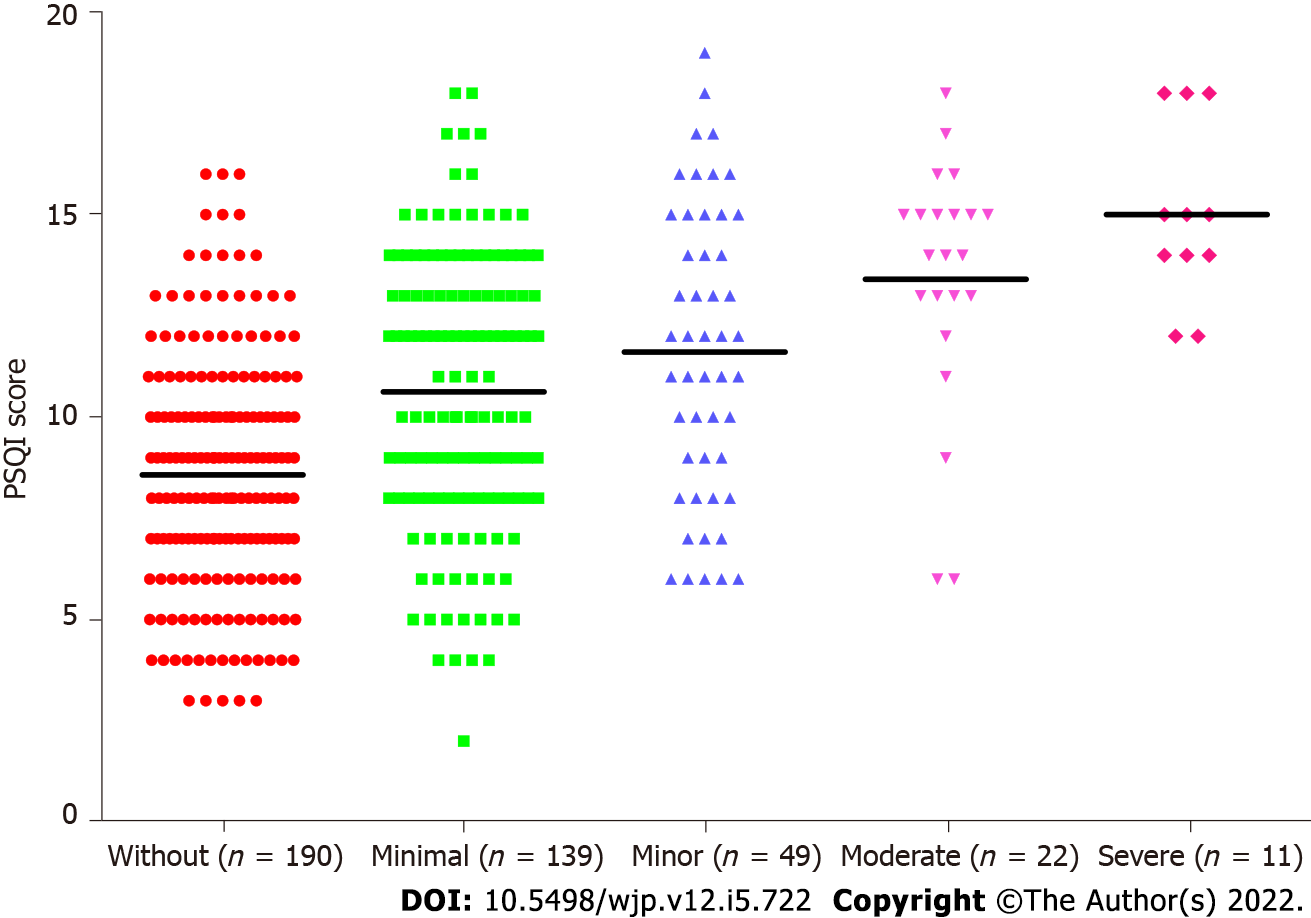
Figure 4 The mean Pittsburgh sleep quality index score.
The mean Pittsburgh sleep quality index score in the without depression group (n = 190), mild (n = 139), moderate (n = 49), moderately severe depression (n = 22), and severe depression (n = 11) was 8.58, 10.63, 11.61, 13.41 and 15.00. PSQI: Pittsburgh sleep quality index.
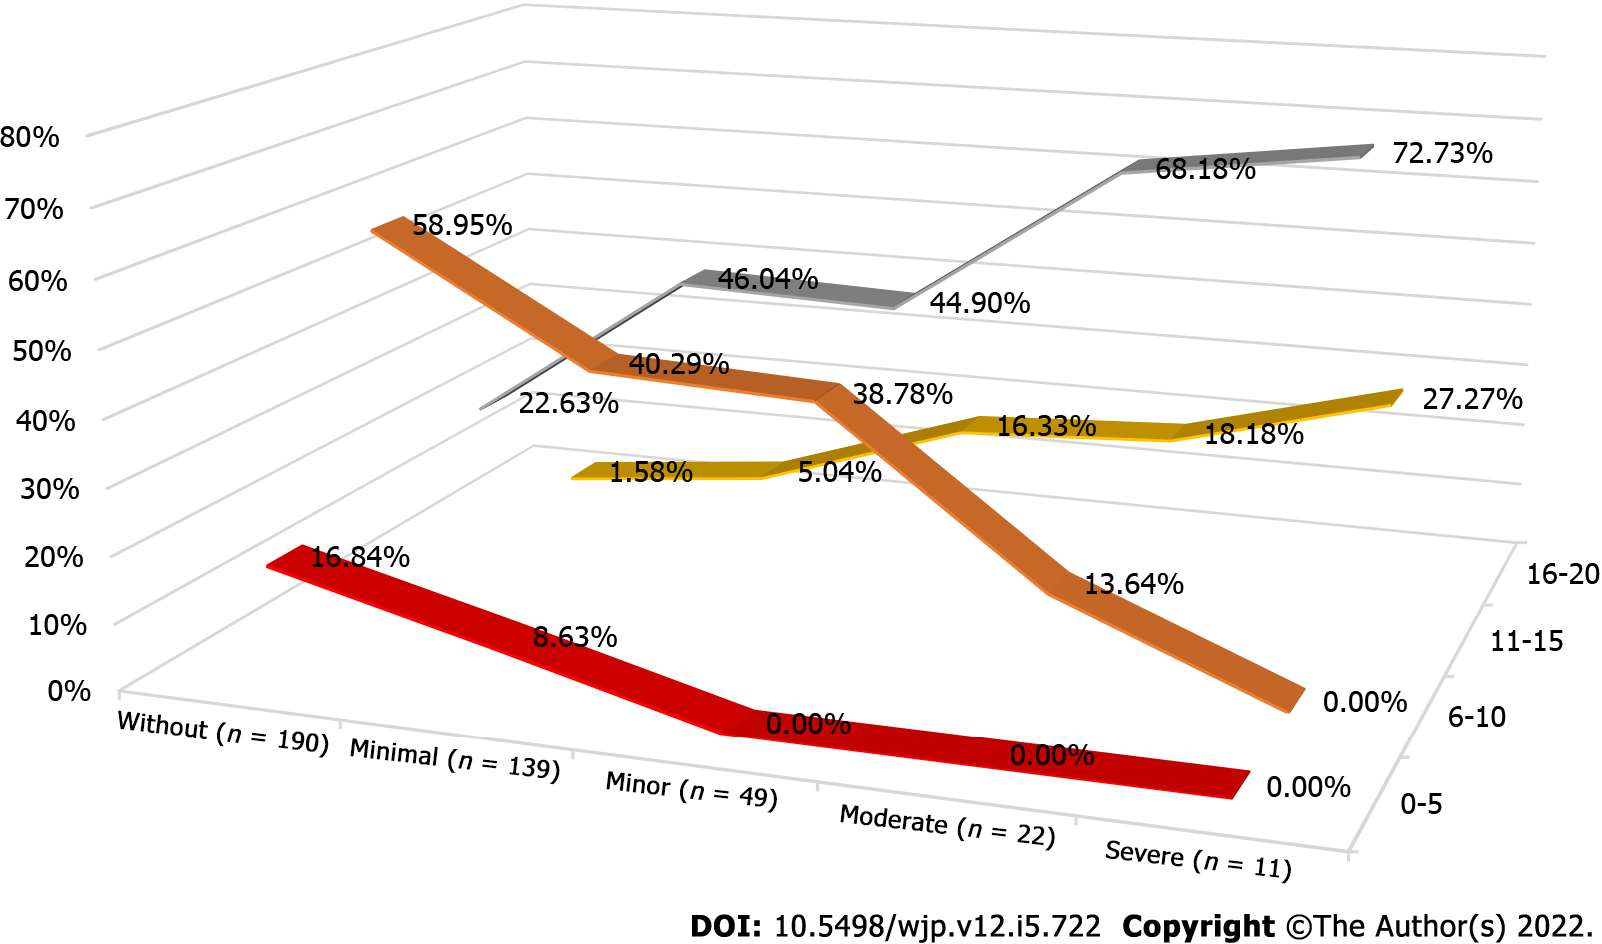
Figure 5 The percentage of Pittsburgh sleep quality index group.
The percentage of Pittsburgh sleep quality index group in without depression group (n = 190), mild (n = 139), moderate (n = 49), moderately severe depression (n = 22), and severe depression (n = 11).
- Citation: Jiang Y, Jiang T, Xu LT, Ding L. Relationship of depression and sleep quality, diseases and general characteristics. World J Psychiatry 2022; 12(5): 722-738
- URL: https://www.wjgnet.com/2220-3206/full/v12/i5/722.htm
- DOI: https://dx.doi.org/10.5498/wjp.v12.i5.722


