Copyright
©The Author(s) 2022.
World J Psychiatry. May 19, 2022; 12(5): 693-707
Published online May 19, 2022. doi: 10.5498/wjp.v12.i5.693
Published online May 19, 2022. doi: 10.5498/wjp.v12.i5.693
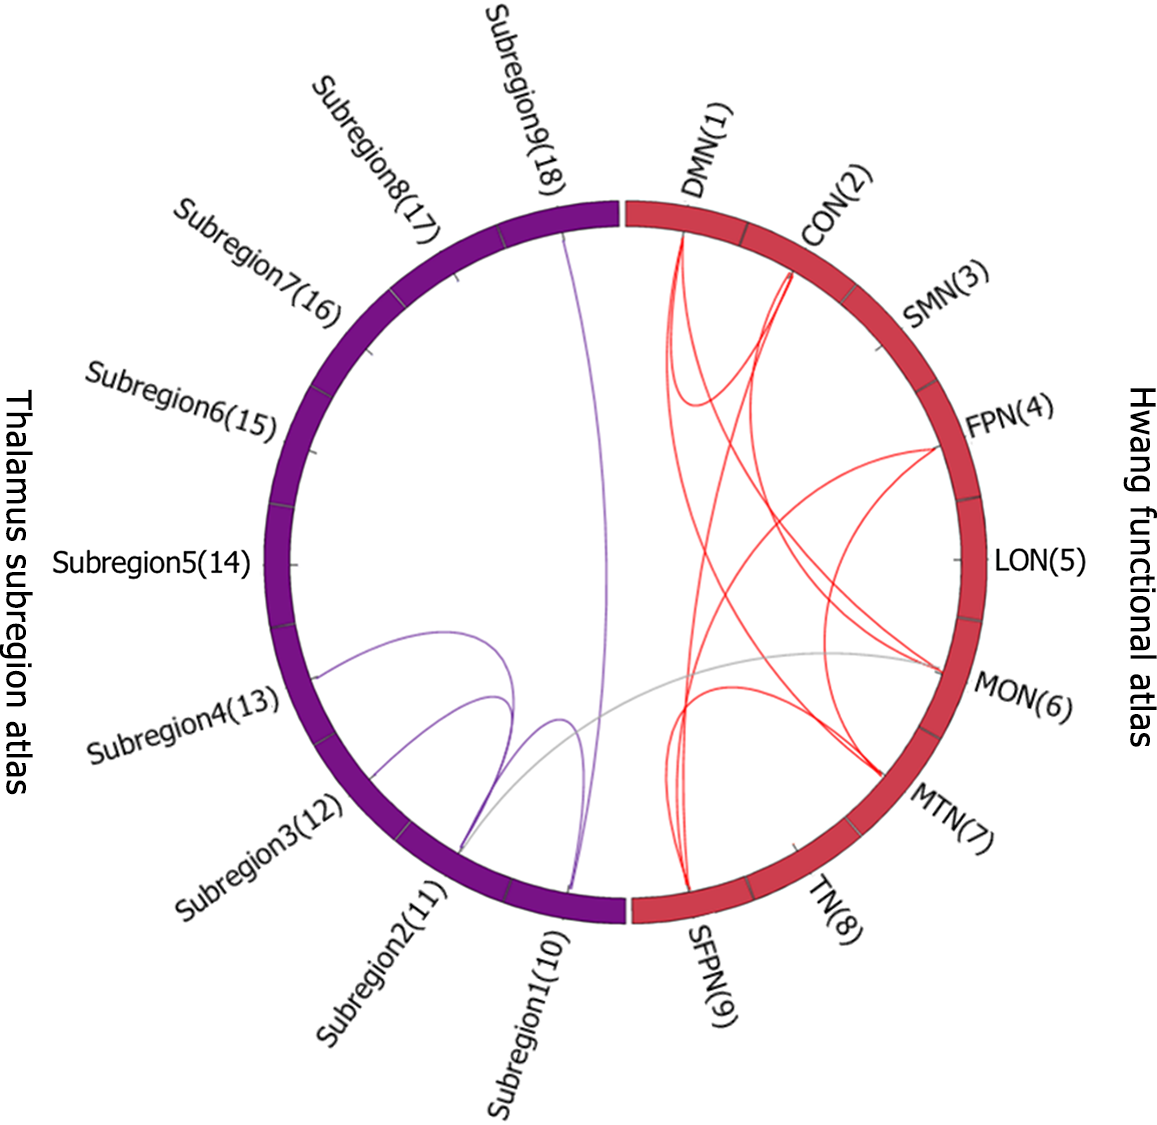
Figure 1 Altered functional connectivity of thalamus subregions and cortical functional networks between treatment resistant schizophrenia and healthy control groups.
Between- and within-connectivity were presented in grey color and in each network’s color respectively. CON: Cingulo-Opercular Network; DMN: Default Mode Network; FPN: Fronto-Parietal Network; LON: Lateral Occipital Network; MON: Medial Occipital Network; MTN: Medial Temporal Network; SFPN: Superior Fronto-Parietal Network; SMN: Somato-Motor Network; TN: Temporal Network.
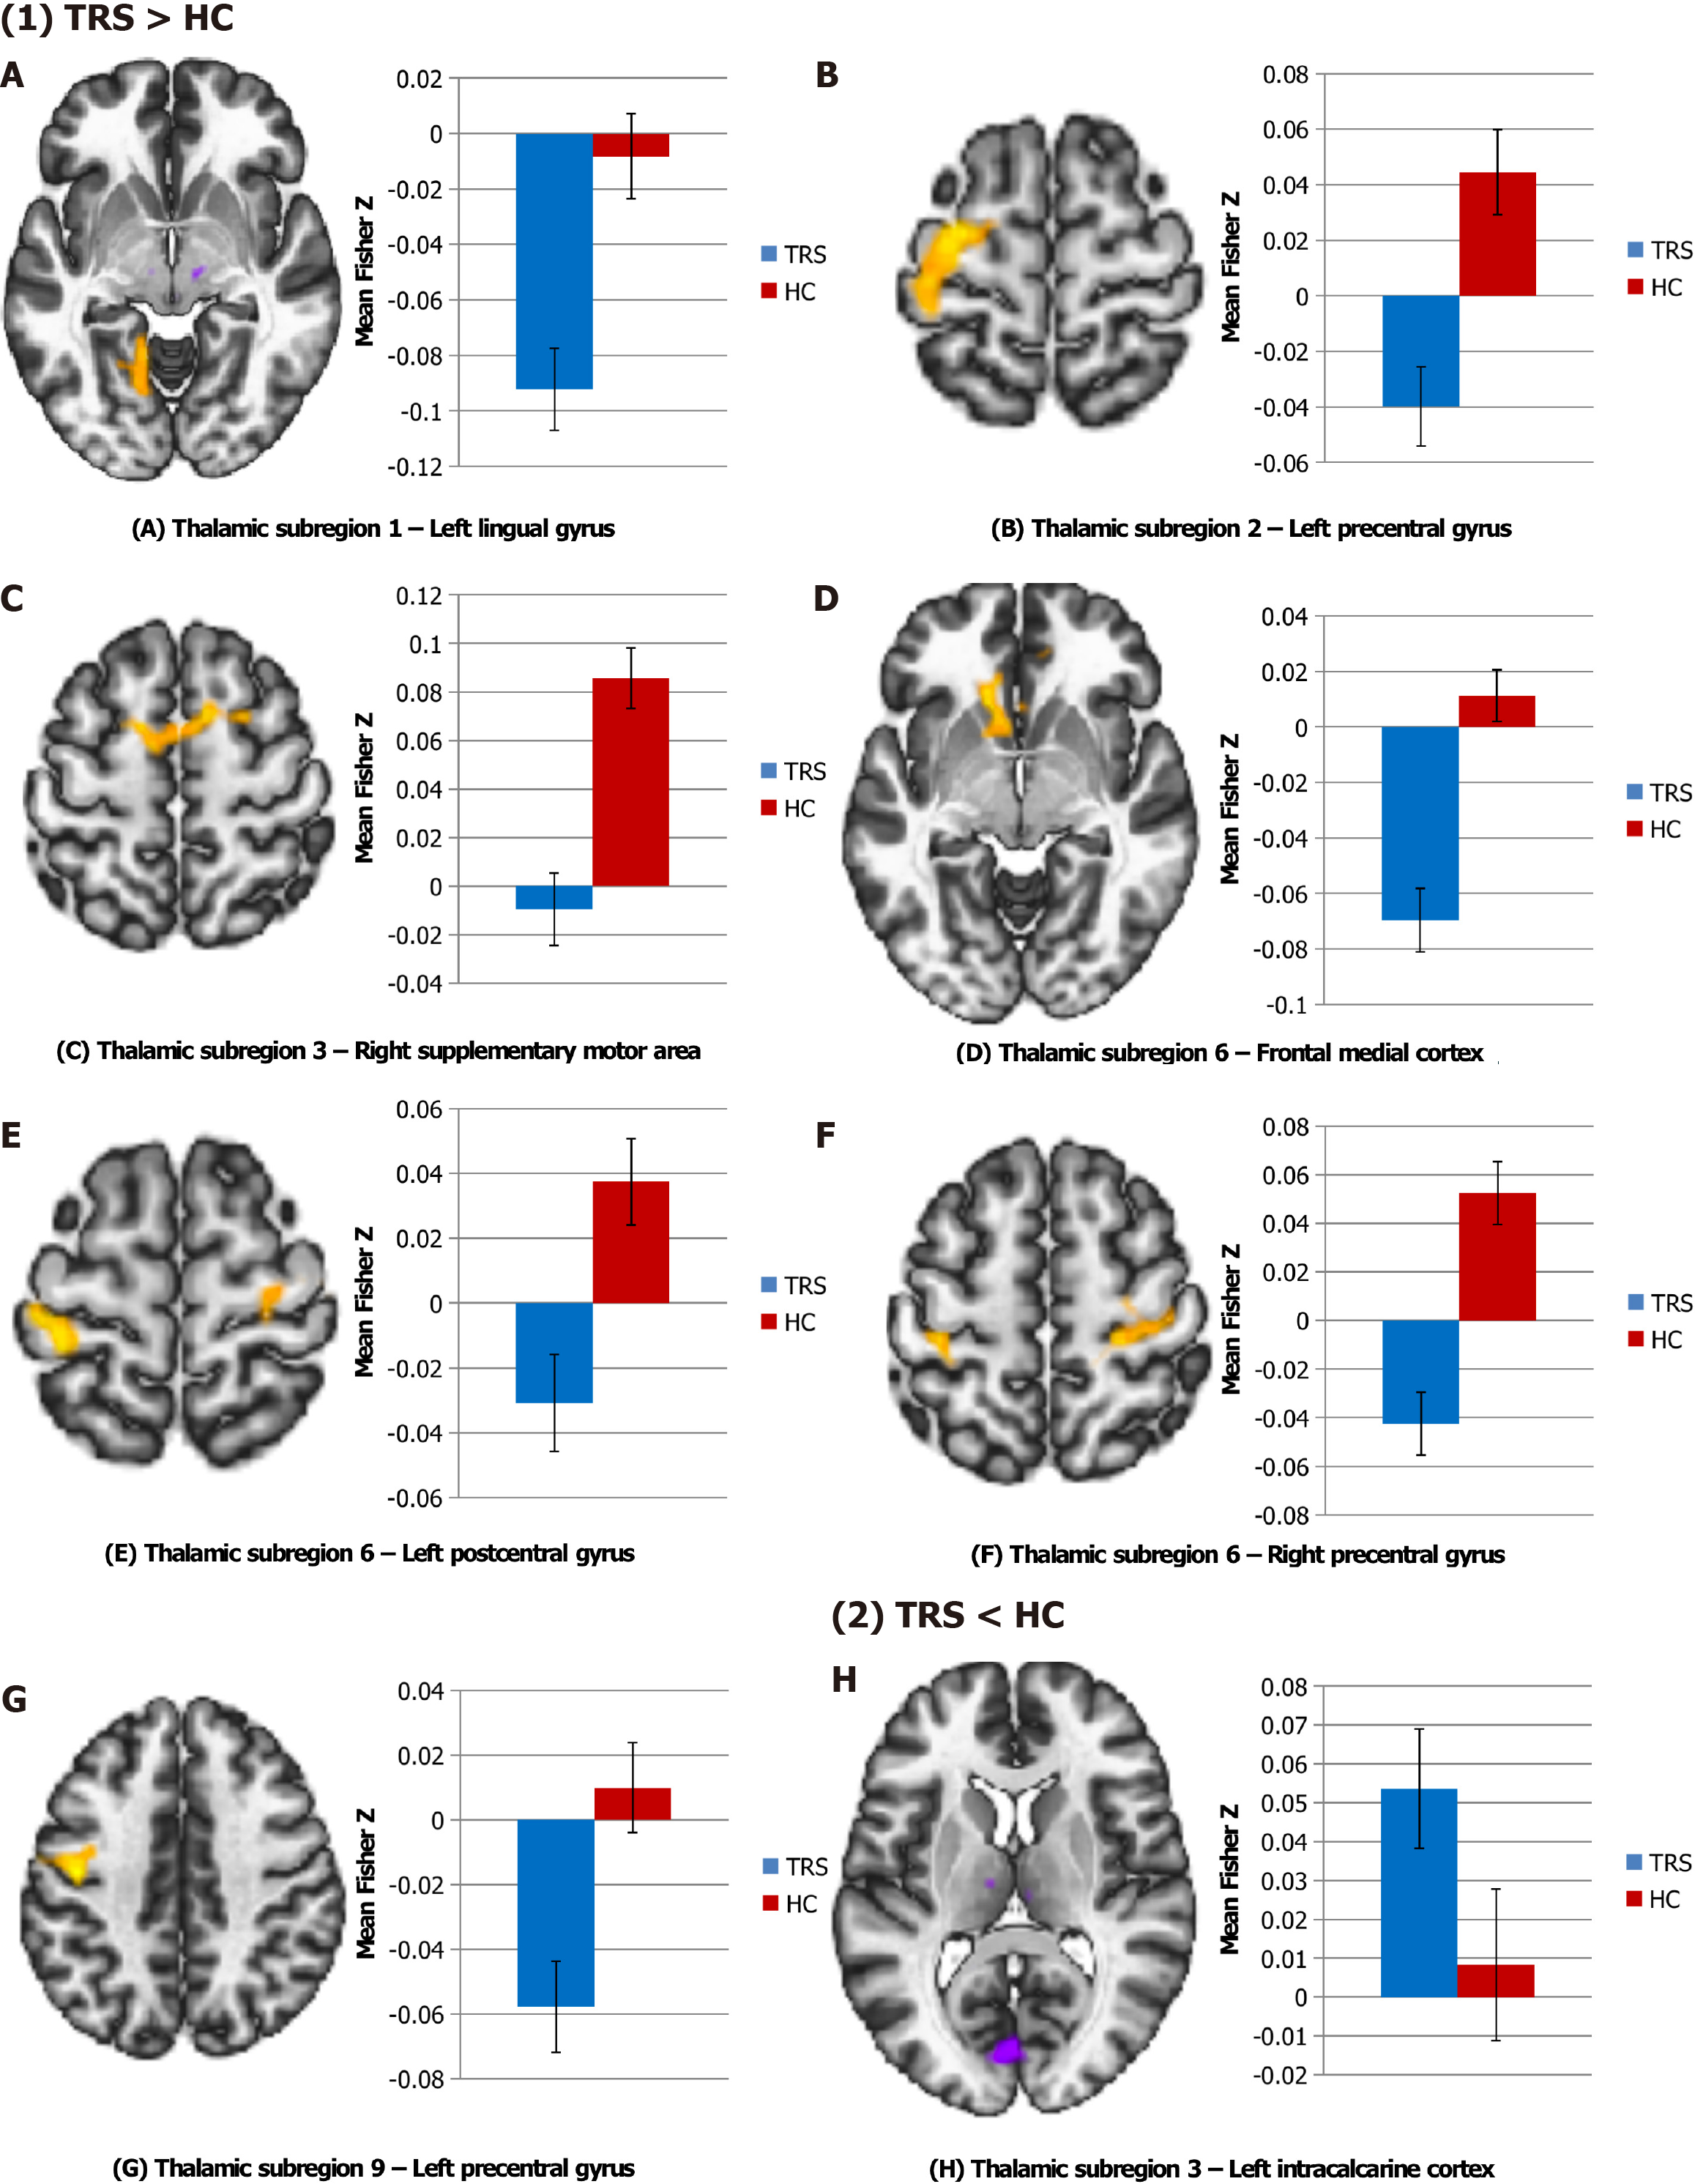
Figure 2 Altered thalamus subregion-based functional connectivity between treatment resistant schizophrenia and healthy control groups.
Significant differences were revealed between the (A) Thalamic subregion 1 and Left lingual gyrus; (B) Thalamic subregion 2 and Left precentral gyrus; (C) Thalamic subregion 3 and right supplementary motor area; (D) Thalamic subregion 6 and Frontal medial cortex; (E) Thalamic subregion 6 and Left postcentral gyrus; (F) Thalamic subregion 6 and Right precentral gyrus; (G) Thalamic subregion 9 and Left precentral gyrus; and (H) Thalamic subregion 3 and Left intracalcarine cortex. The functional connectivity Z values of regions showing significant differences are presented in bar graph.
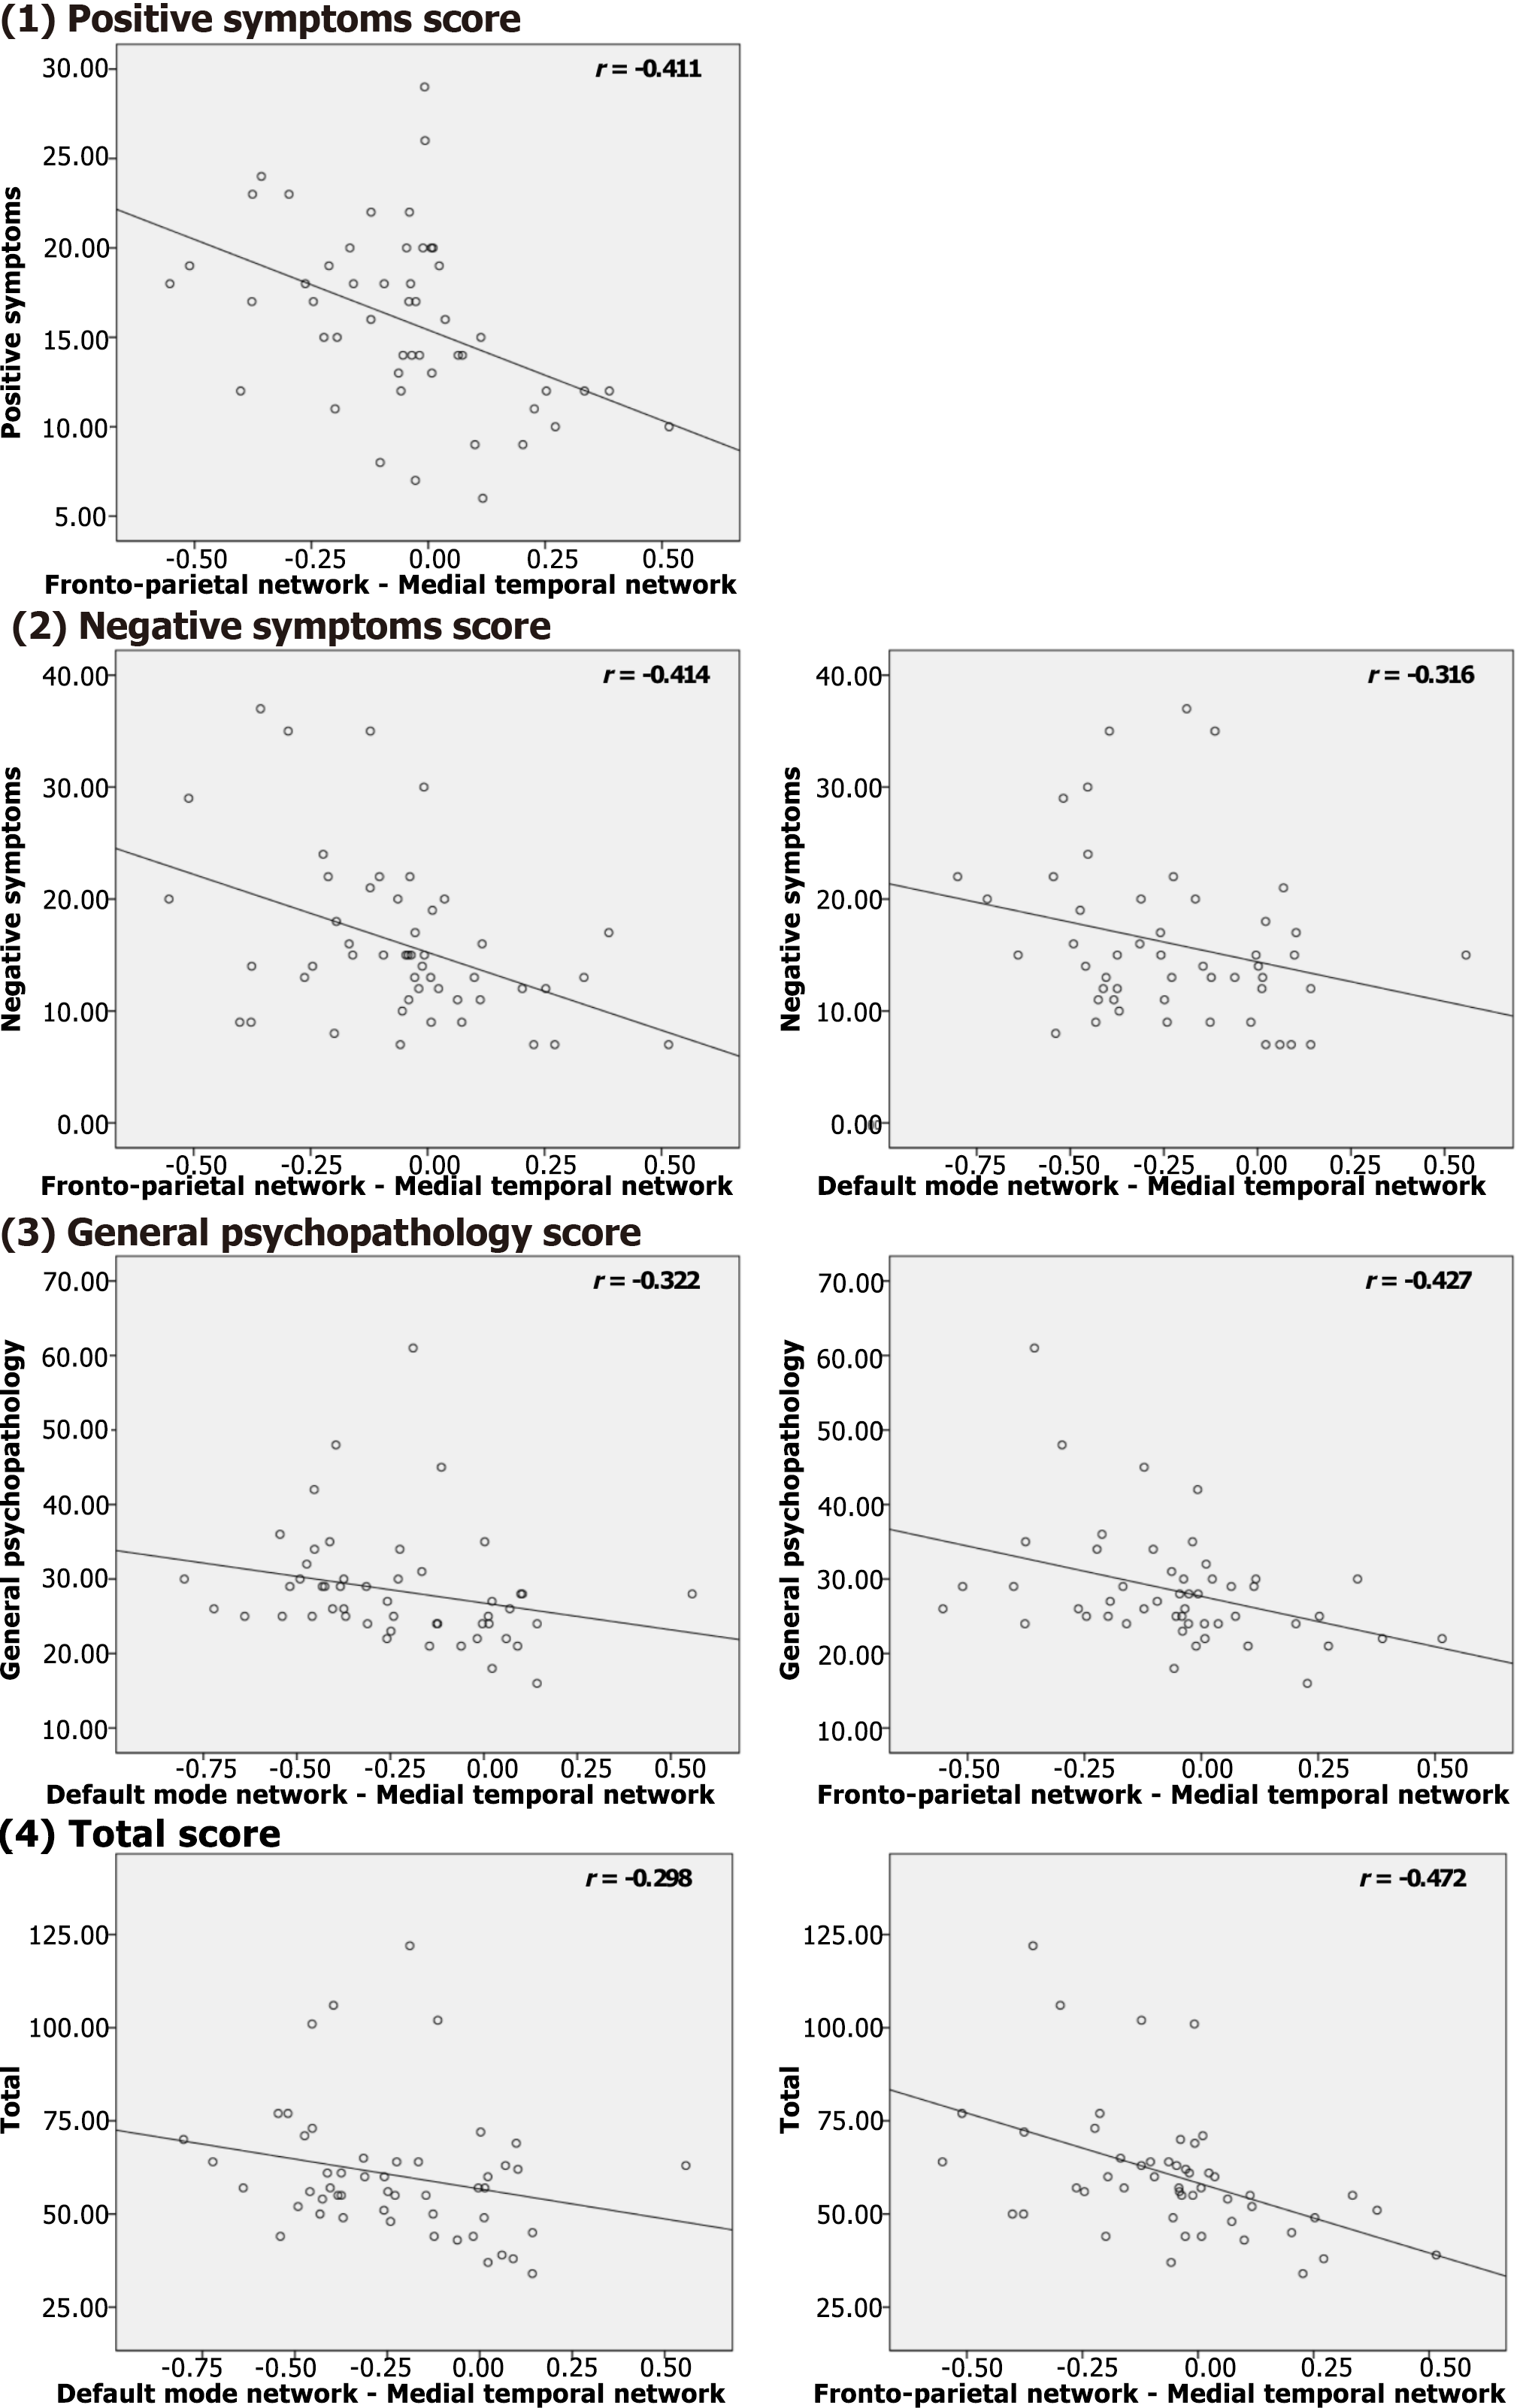
Figure 3 Associations between the significantly altered region of interest to region of interest functional connectivity and Positive and Negative Syndrome Scale scores in the treatment resistant schizophrenia group.
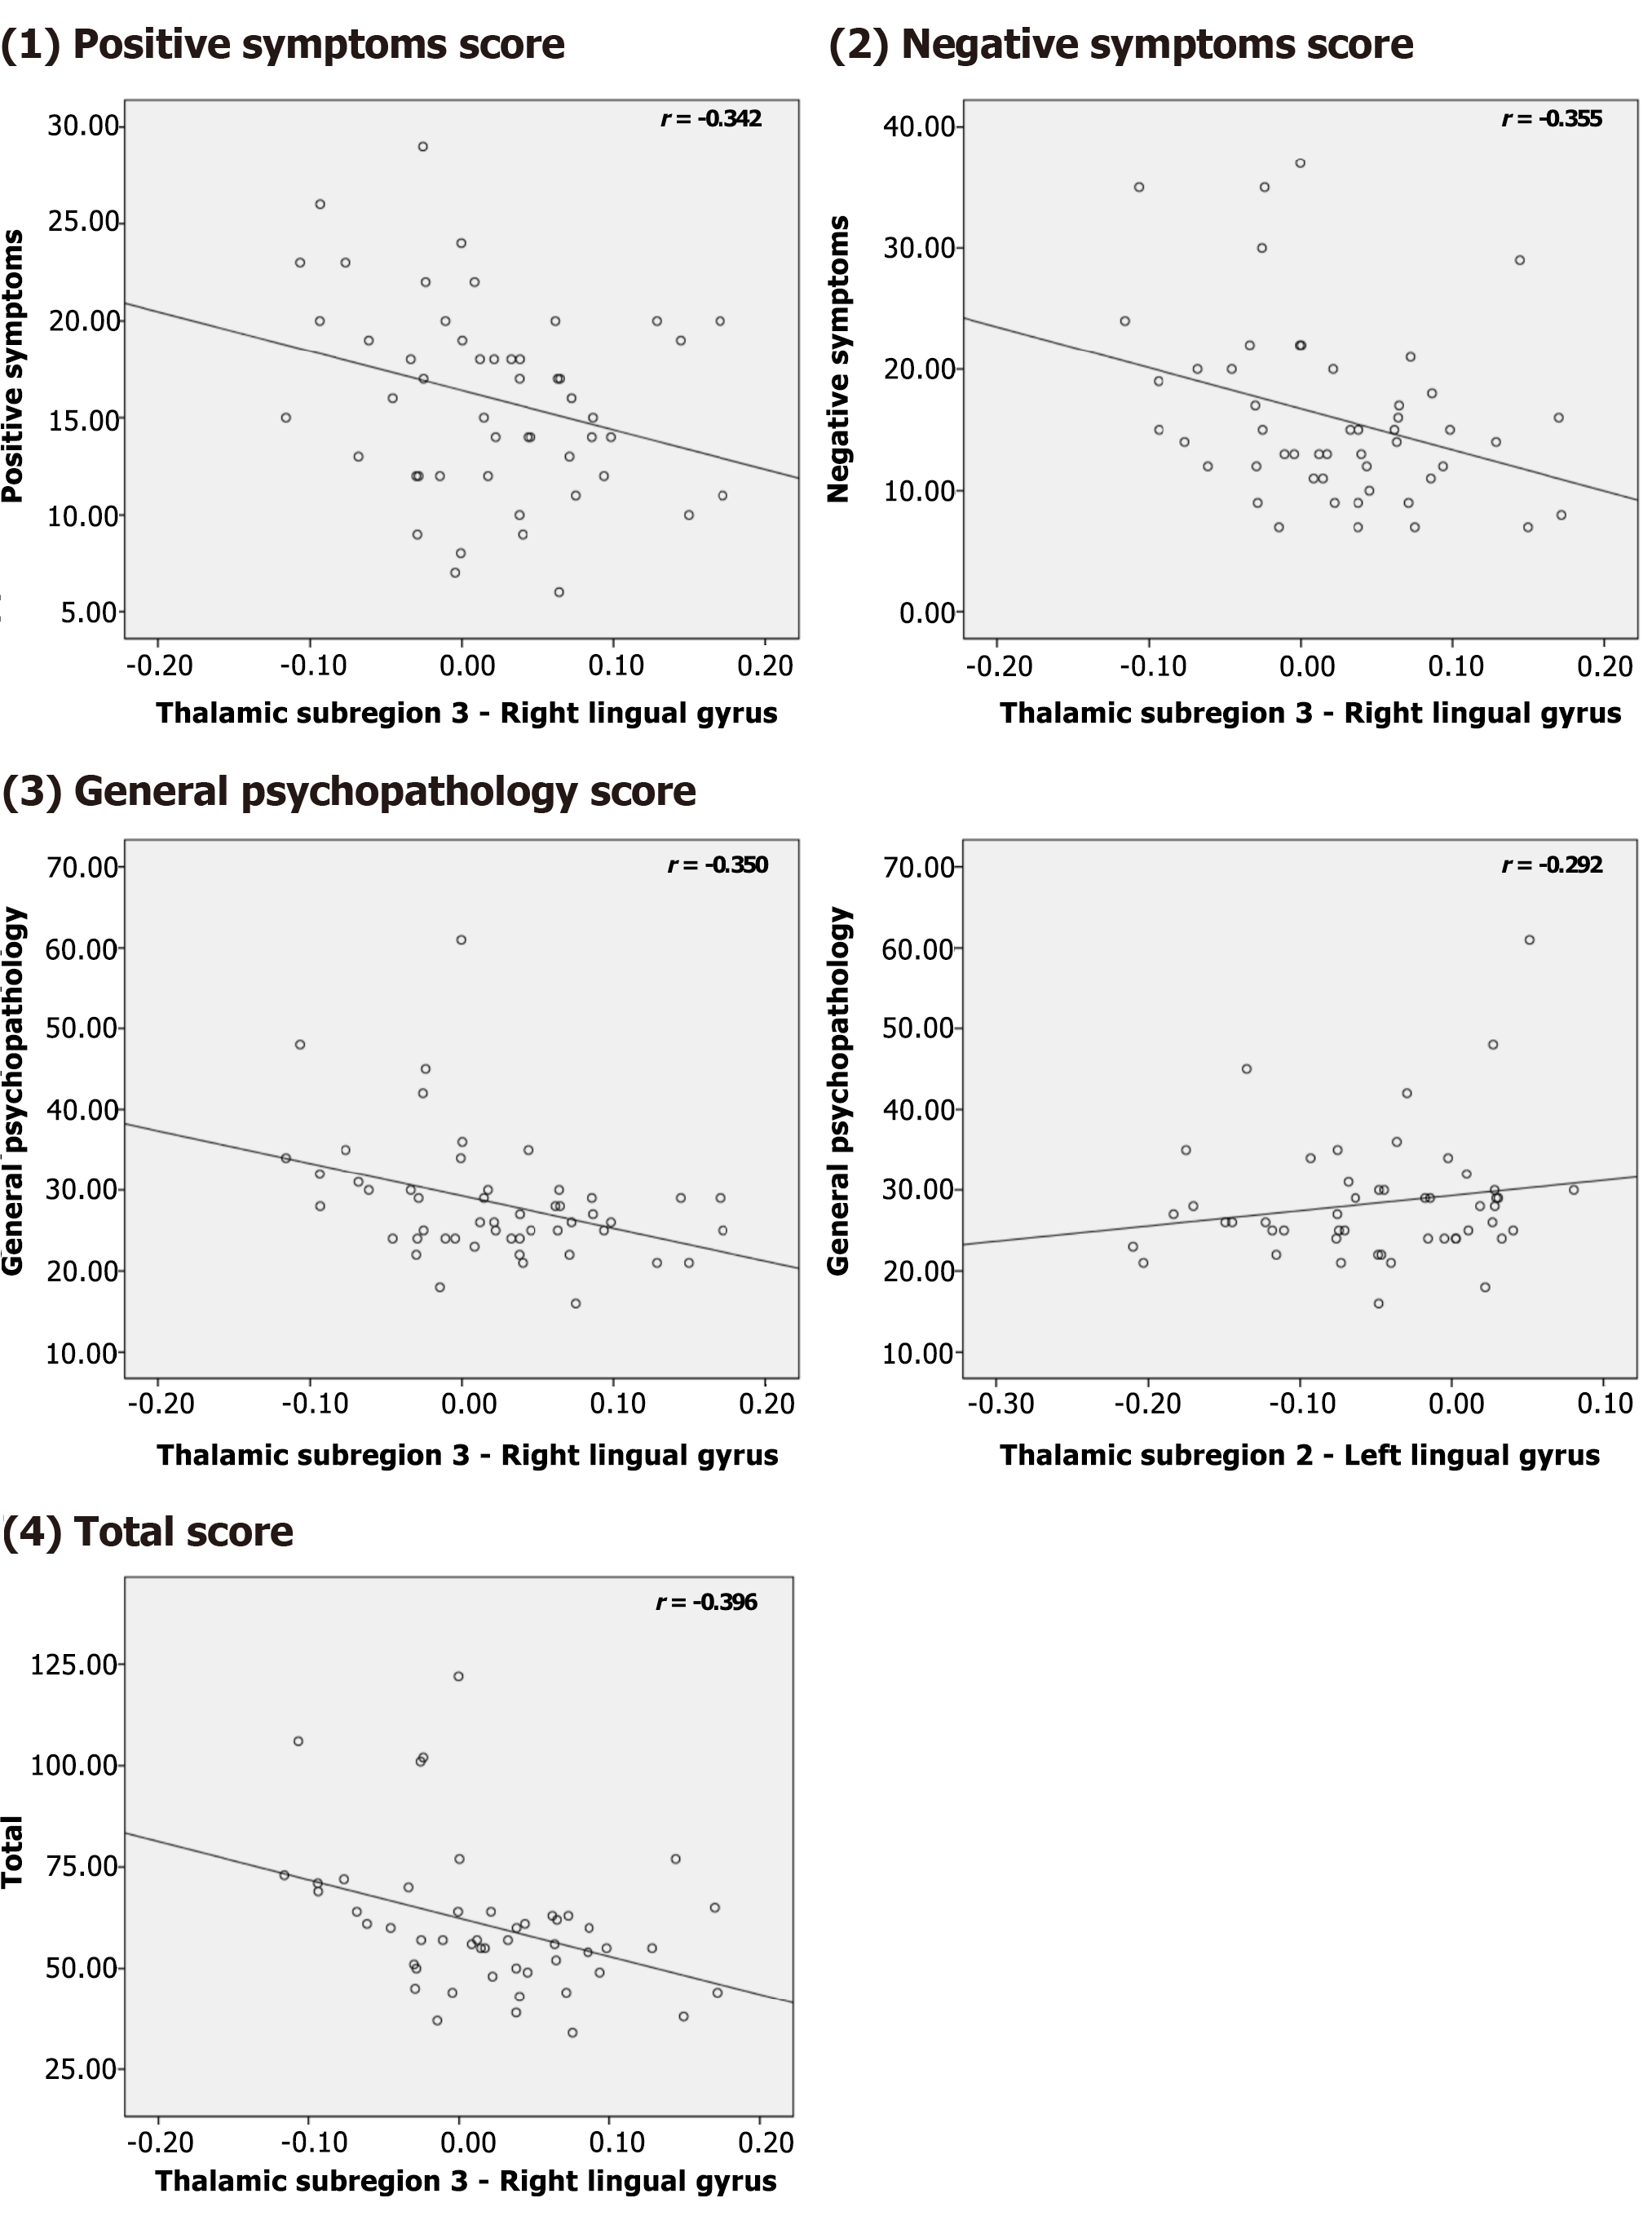
Figure 4 Associations between the significantly altered seed to voxel functional connectivity and Positive and Negative Syndrome Scale scores in the treatment resistant schizophrenia group.
- Citation: Kim WS, Shen J, Tsogt U, Odkhuu S, Chung YC. Altered thalamic subregion functional networks in patients with treatment-resistant schizophrenia. World J Psychiatry 2022; 12(5): 693-707
- URL: https://www.wjgnet.com/2220-3206/full/v12/i5/693.htm
- DOI: https://dx.doi.org/10.5498/wjp.v12.i5.693


