Copyright
©The Author(s) 2022.
World J Psychiatry. Mar 19, 2022; 12(3): 450-469
Published online Mar 19, 2022. doi: 10.5498/wjp.v12.i3.450
Published online Mar 19, 2022. doi: 10.5498/wjp.v12.i3.450
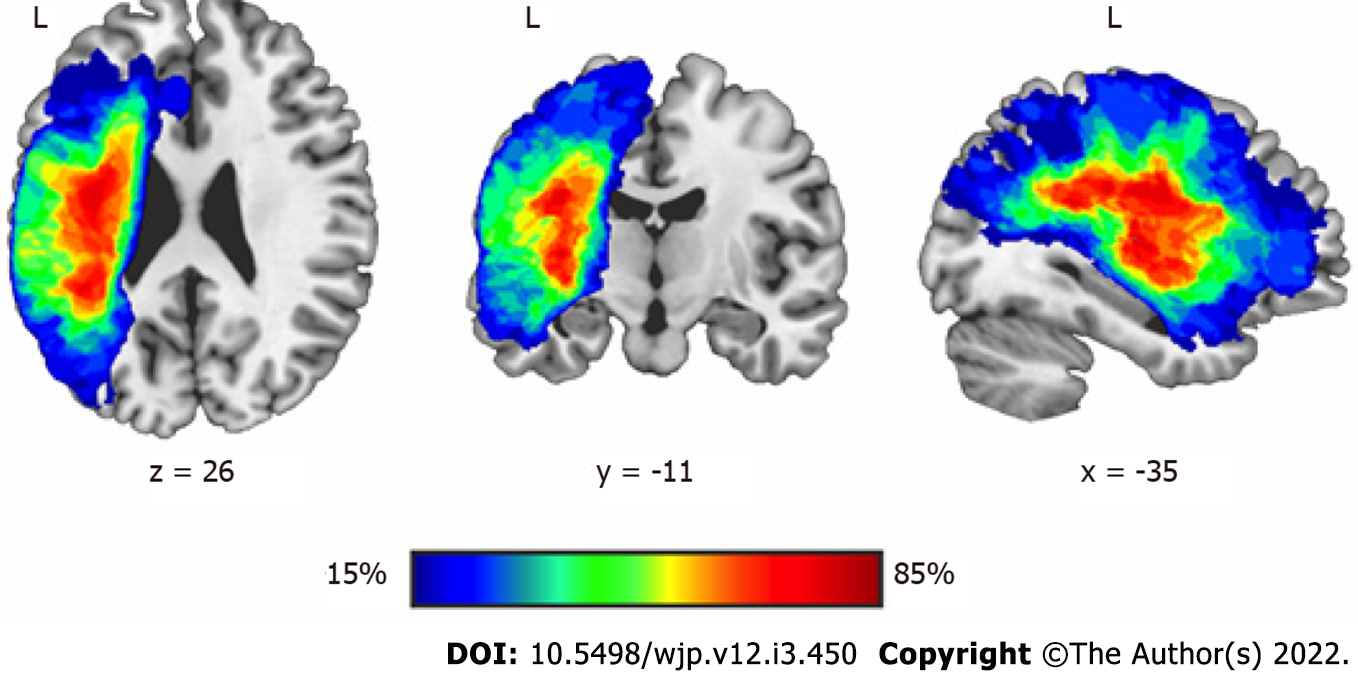
Figure 1 Lesion overlap map from the 20 participants overlaid on a brain template in Montreal Neurological Institute standard space.
The maximum lesion overlap (red color) (85%, n = 17) involved regions comprising the left arcuate fasciculus (long and the anterior segments), the insula and the putamen. Different sectors of the left anterior cingulate gyrus were involved in six participants. L: left.
- Citation: Edelkraut L, López-Barroso D, Torres-Prioris MJ, Starkstein SE, Jorge RE, Aloisi J, Berthier ML, Dávila G. Spectrum of neuropsychiatric symptoms in chronic post-stroke aphasia. World J Psychiatry 2022; 12(3): 450-469
- URL: https://www.wjgnet.com/2220-3206/full/v12/i3/450.htm
- DOI: https://dx.doi.org/10.5498/wjp.v12.i3.450


