Copyright
©The Author(s) 2022.
World J Psychiatry. Jan 19, 2022; 12(1): 169-186
Published online Jan 19, 2022. doi: 10.5498/wjp.v12.i1.169
Published online Jan 19, 2022. doi: 10.5498/wjp.v12.i1.169
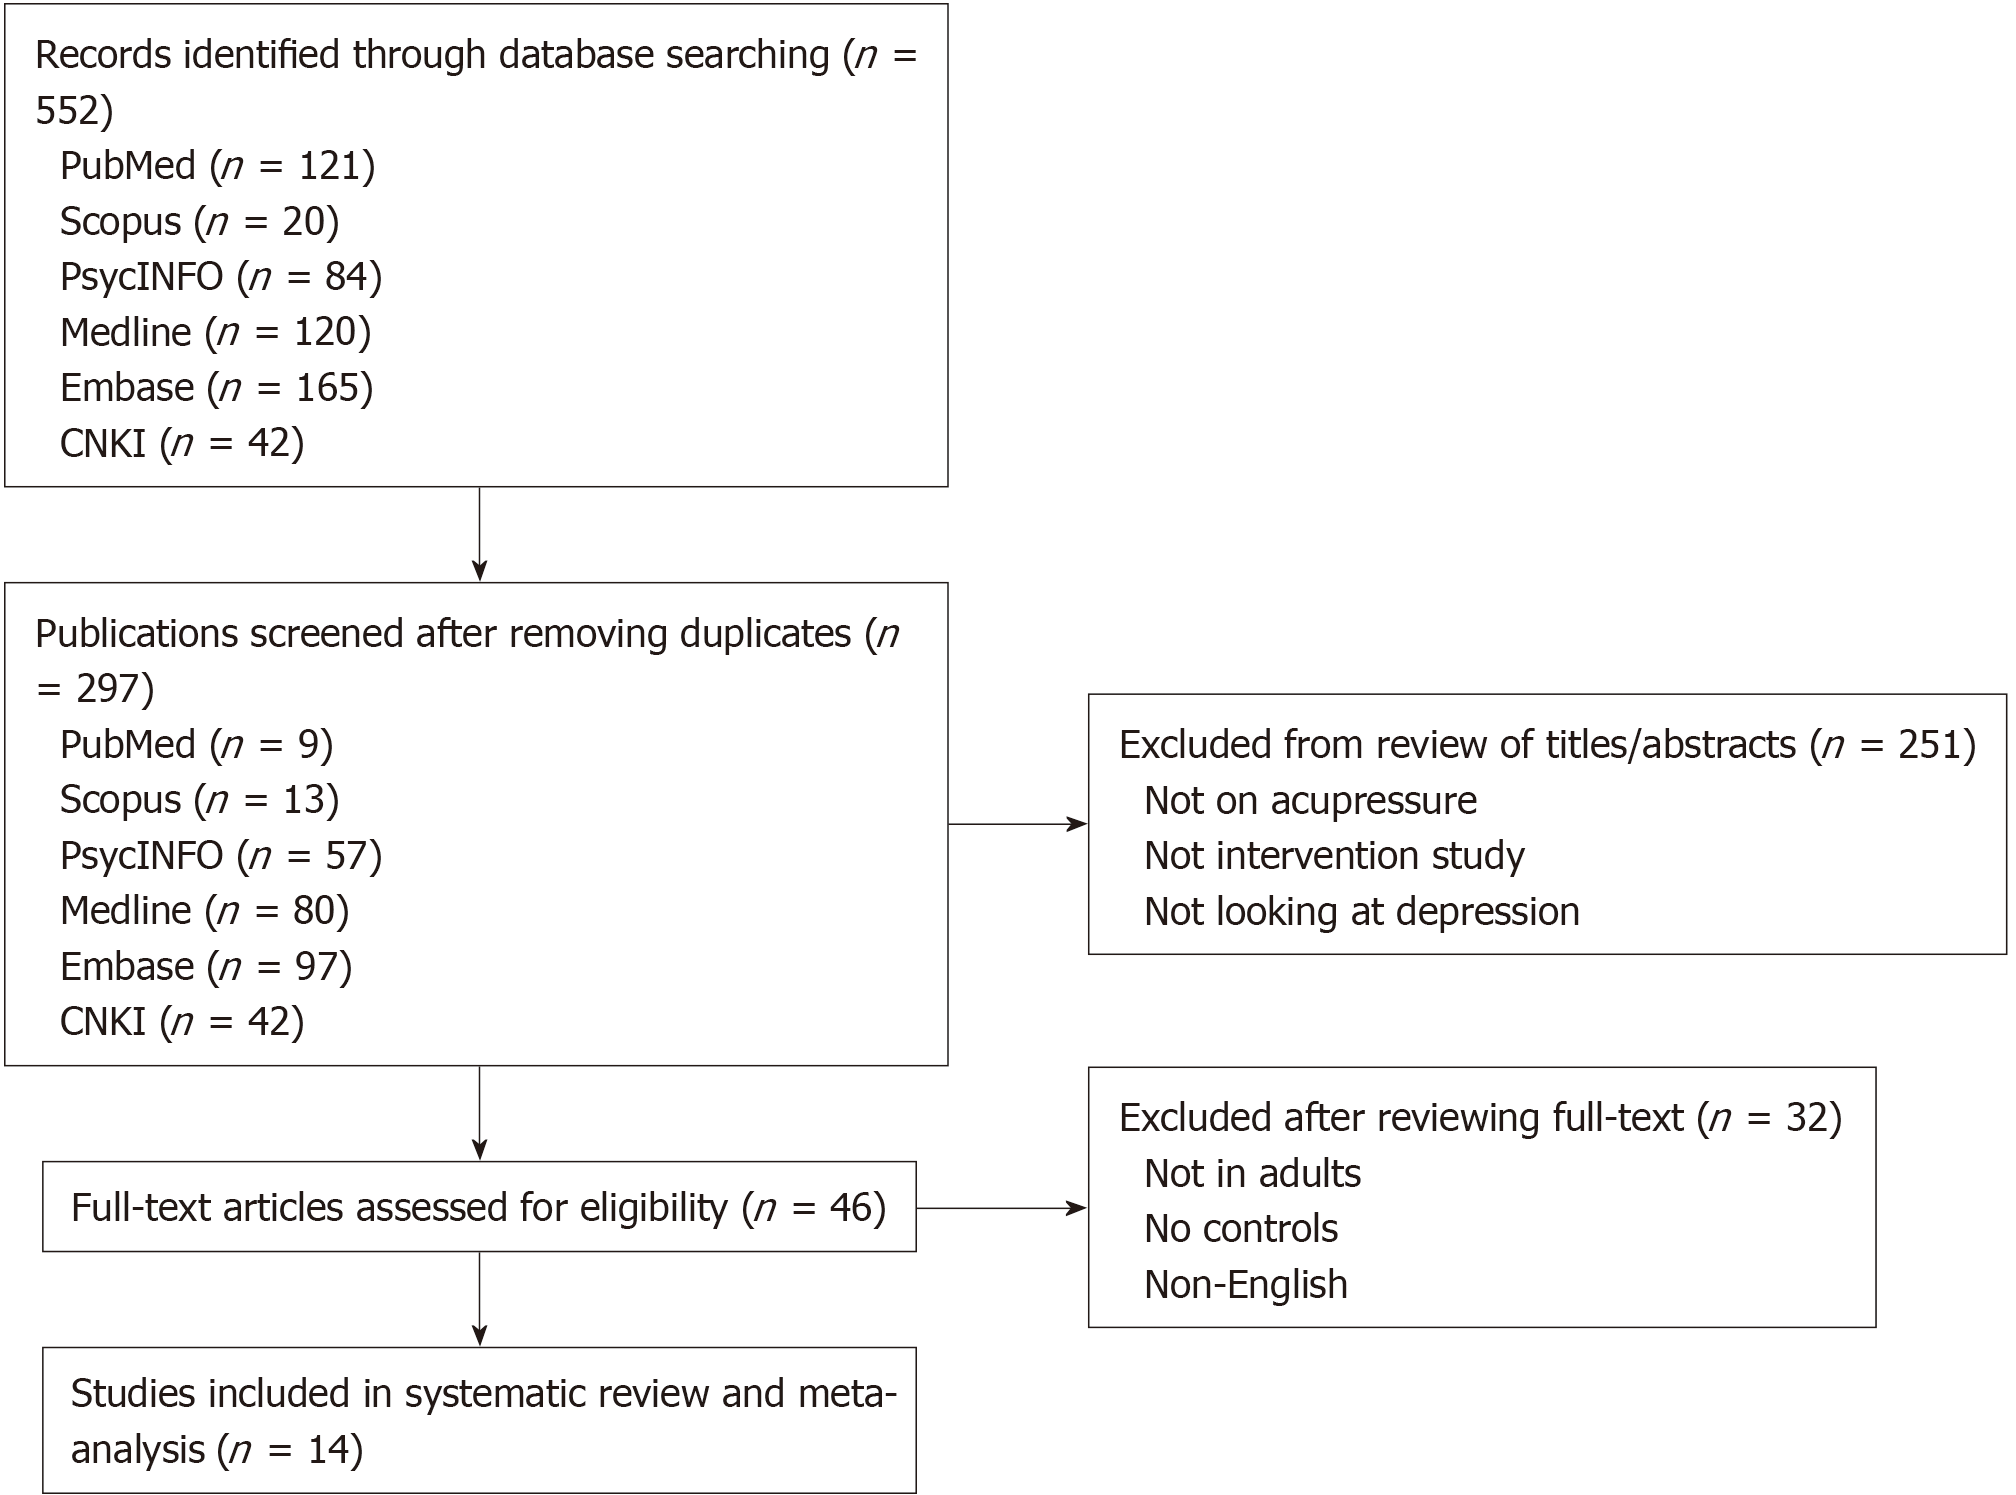
Figure 1 Flow diagram for data collection and analysis.
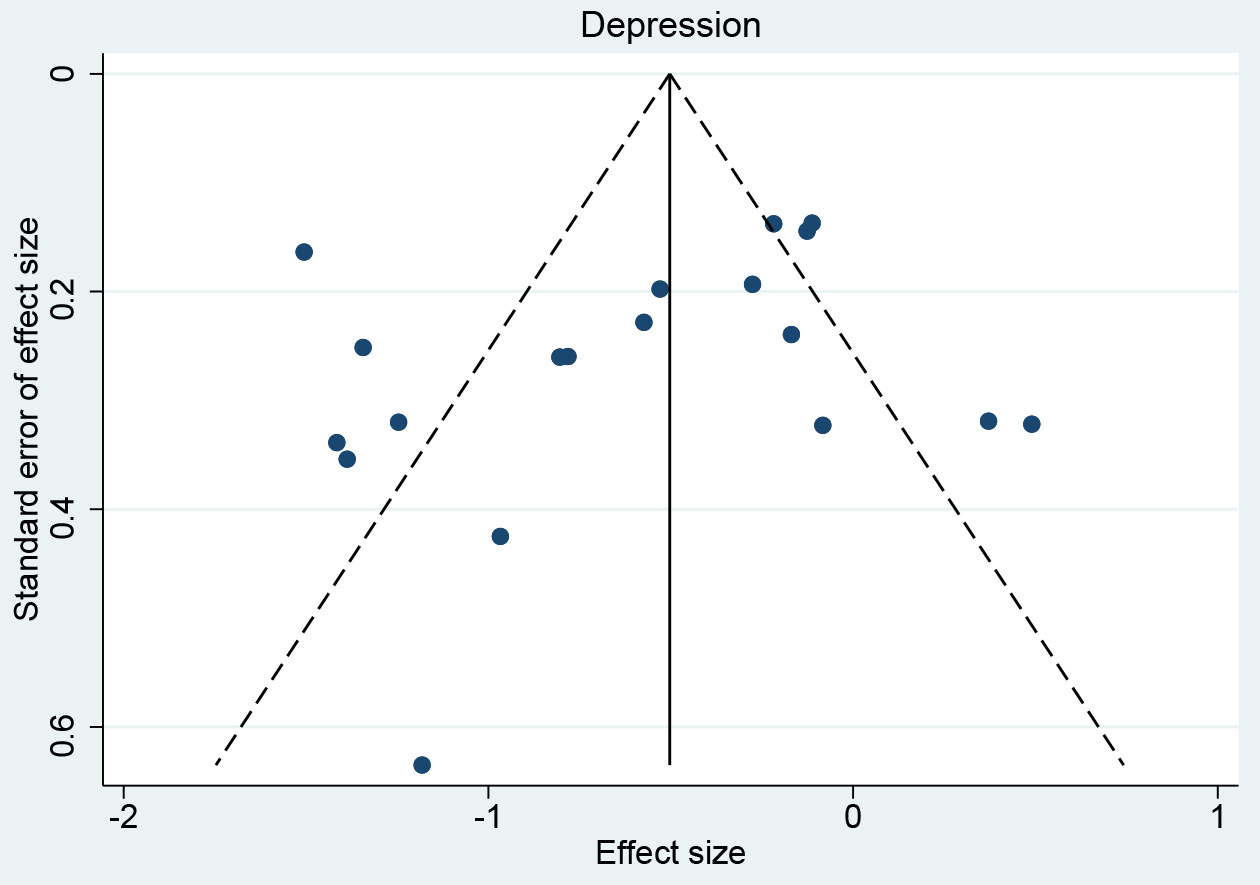
Figure 2 Funnel plots of studies with depression outcomes.
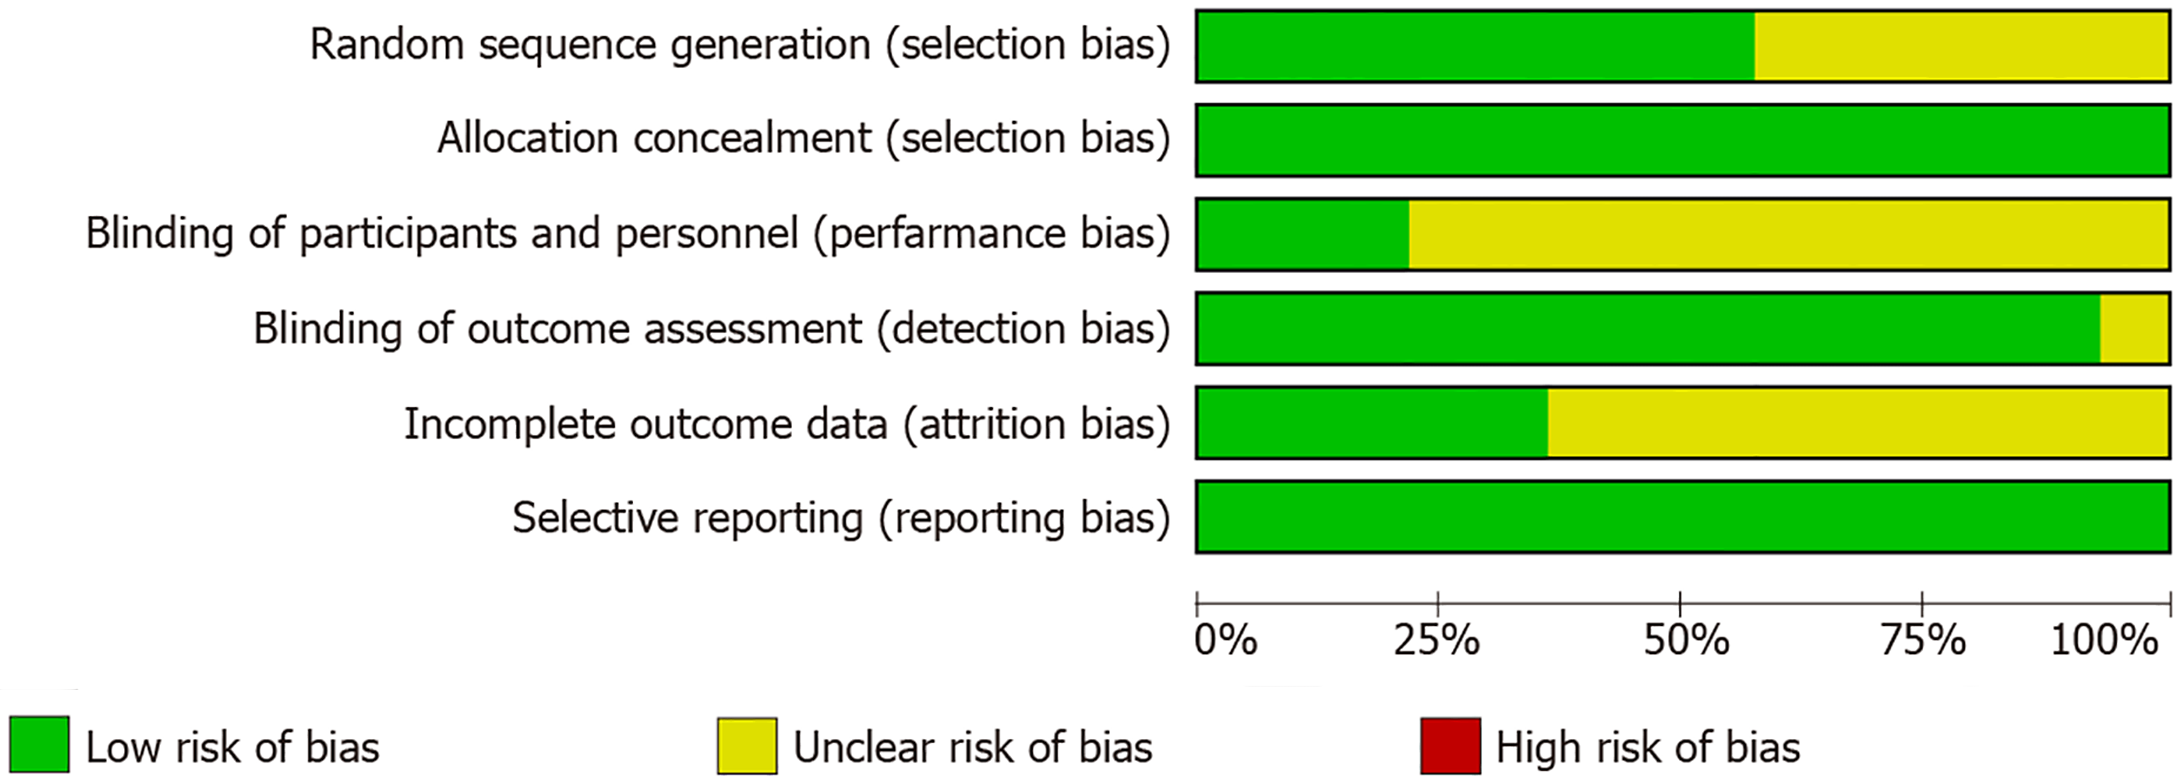
Figure 3 Risk of bias evaluation for the included studies.
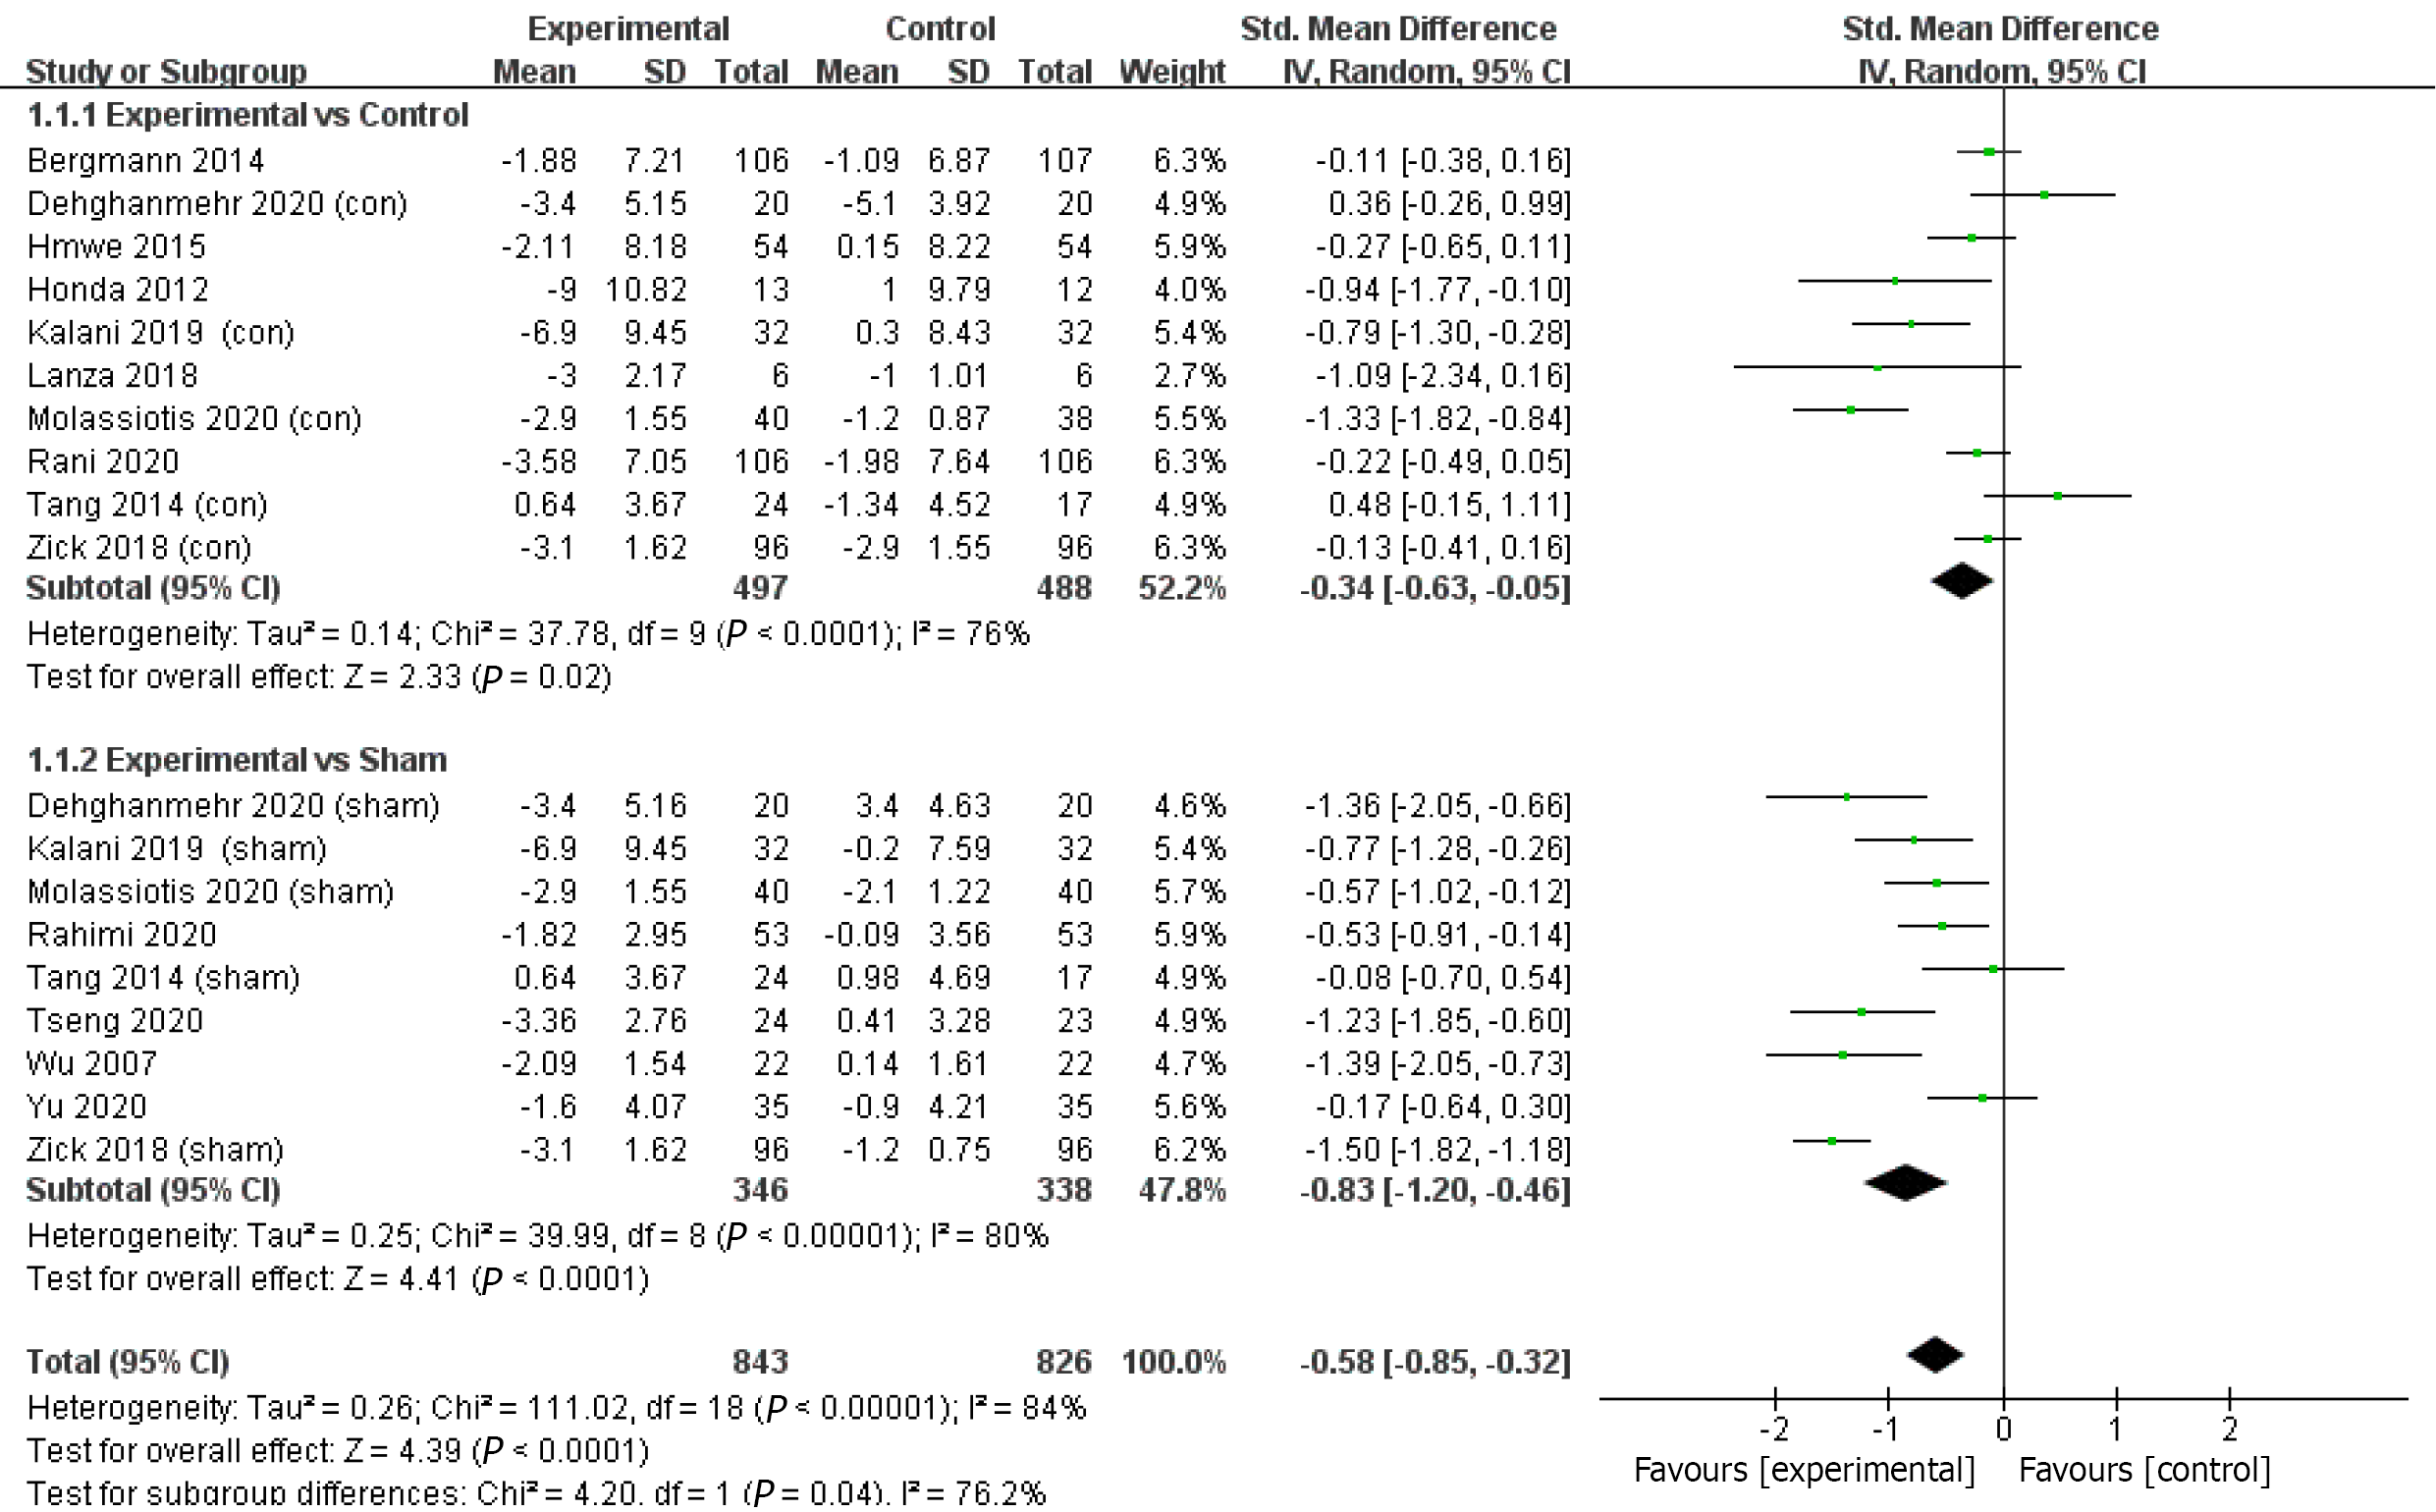
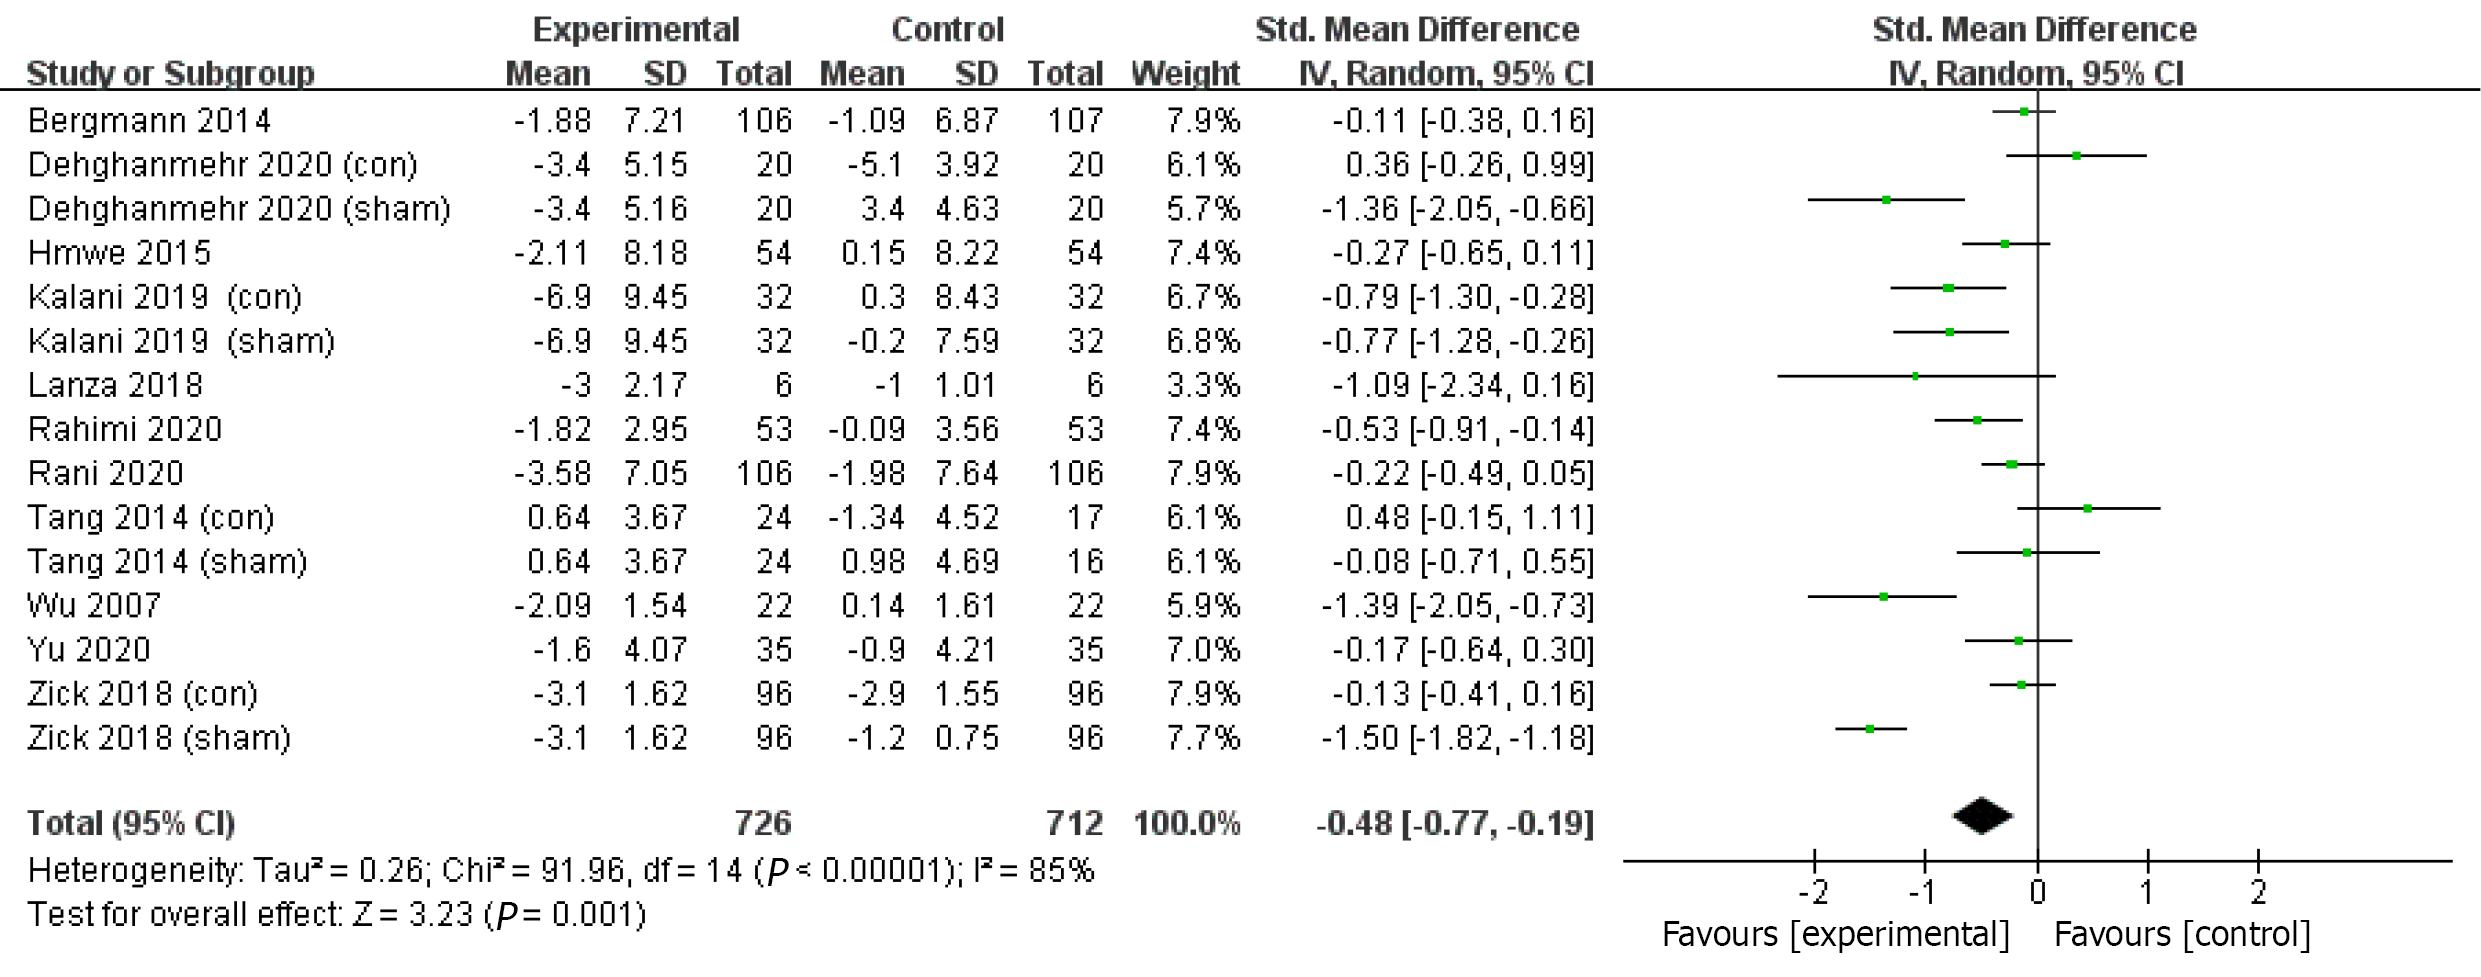
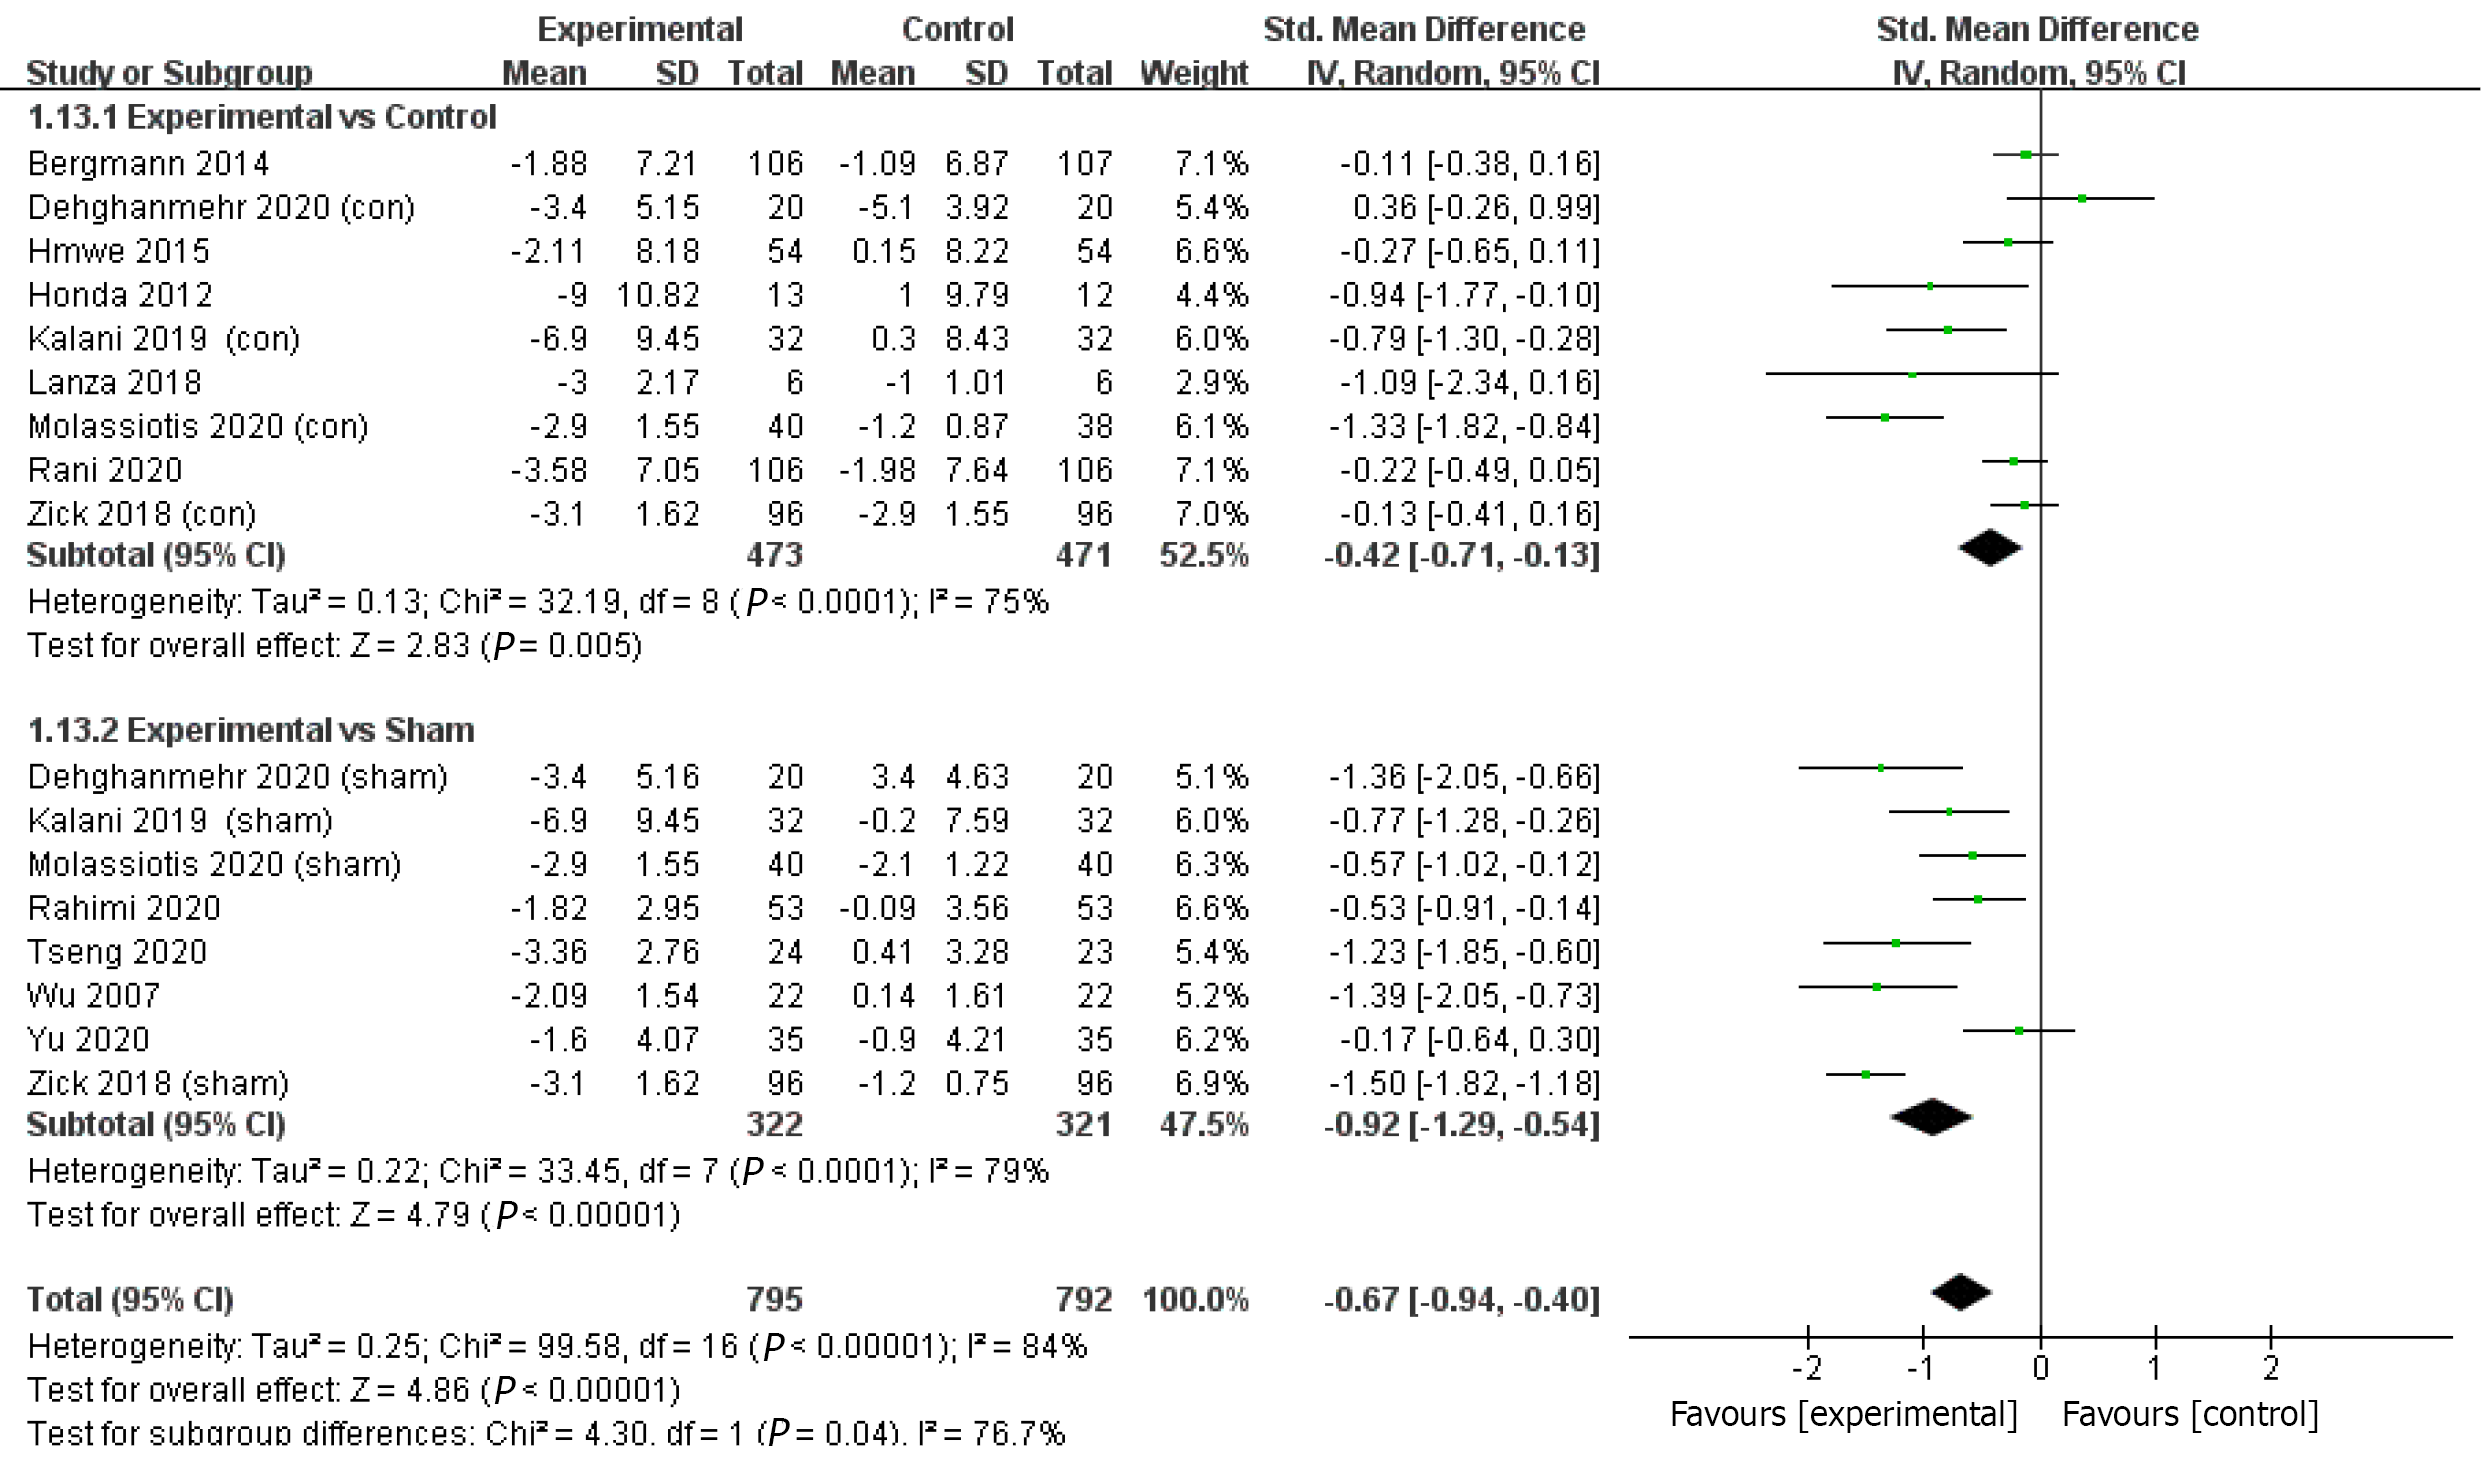
Figure 4 Effects of acupressure on depression.
1.1.1. Subgroup meta-analyses of studies using treat-as-usual (TAU) as controls; 1.1.2. Subgroup meta-analyses of studies using Sham controls.
Figure 5 Effects of acupressure on depression with treatment duration of 2 to 4 wk.
Figure 6 Effects of acupressure on depression with treatment duration of more than 4 wk.
Figure 7 Effects of acupressure on depressive symptoms in participants with chronic diseases.
Figure 8 Effects of acupressure on depressive symptoms in participants with primary depression.
Figure 9 Effects of acupressure on depression in participants aged 18-64 years old.
Figure 10 Effects of acupressure on depression in participants aged 65 years old or above.
Figure 11 Effects of acupressure using no more than 3 (3 included) acupoints on depression.
Figure 12 Effects of acupressure using more than 3 acupoints on depression.
Figure 13 Effects of acupressure on anxiety.
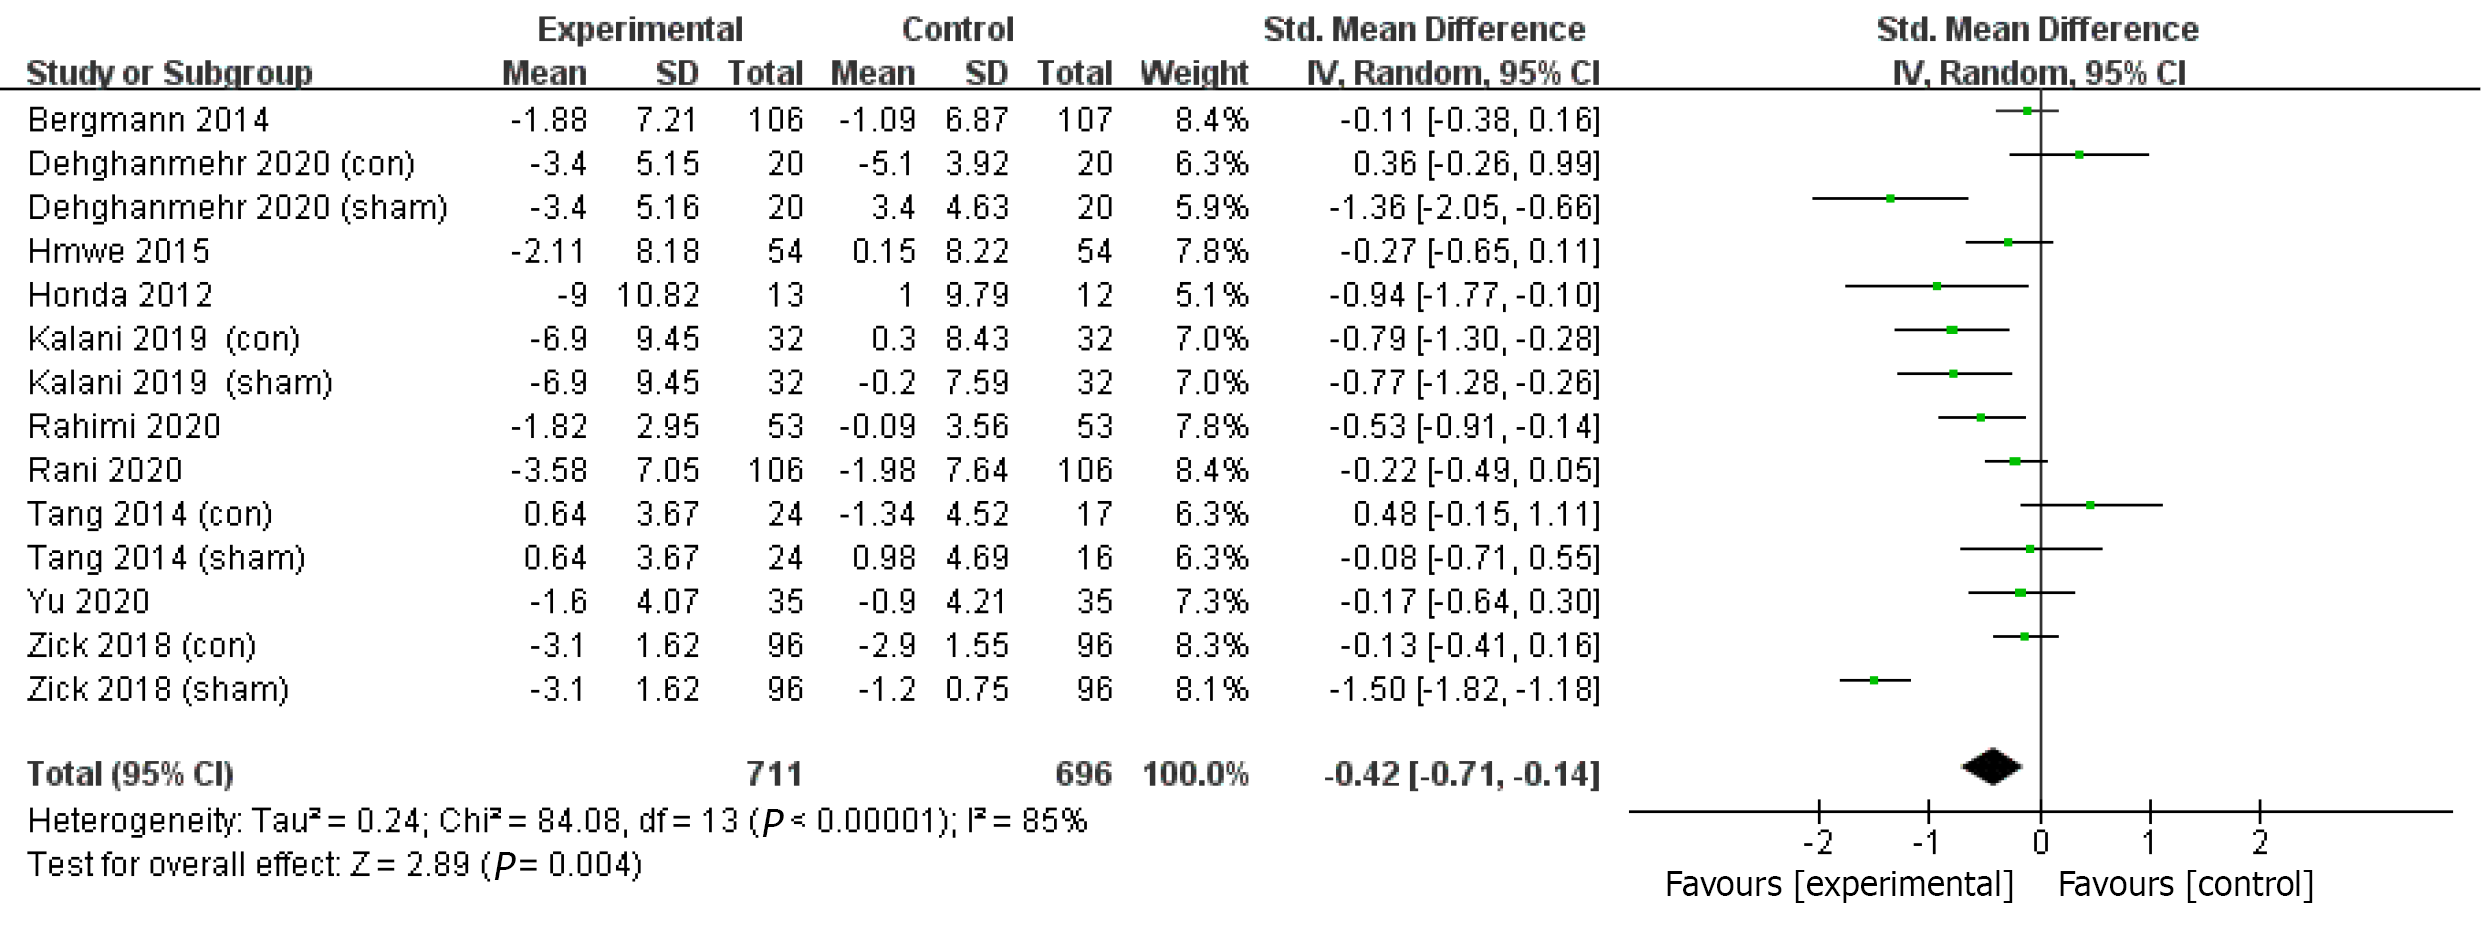
Figure 14 Sensitivity analyses of acupressure on depression.
- Citation: Lin J, Chen T, He J, Chung RC, Ma H, Tsang H. Impacts of acupressure treatment on depression: A systematic review and meta-analysis. World J Psychiatry 2022; 12(1): 169-186
- URL: https://www.wjgnet.com/2220-3206/full/v12/i1/169.htm
- DOI: https://dx.doi.org/10.5498/wjp.v12.i1.169


