Copyright
©The Author(s) 2021.
World J Psychiatr. Aug 19, 2021; 11(8): 477-490
Published online Aug 19, 2021. doi: 10.5498/wjp.v11.i8.477
Published online Aug 19, 2021. doi: 10.5498/wjp.v11.i8.477
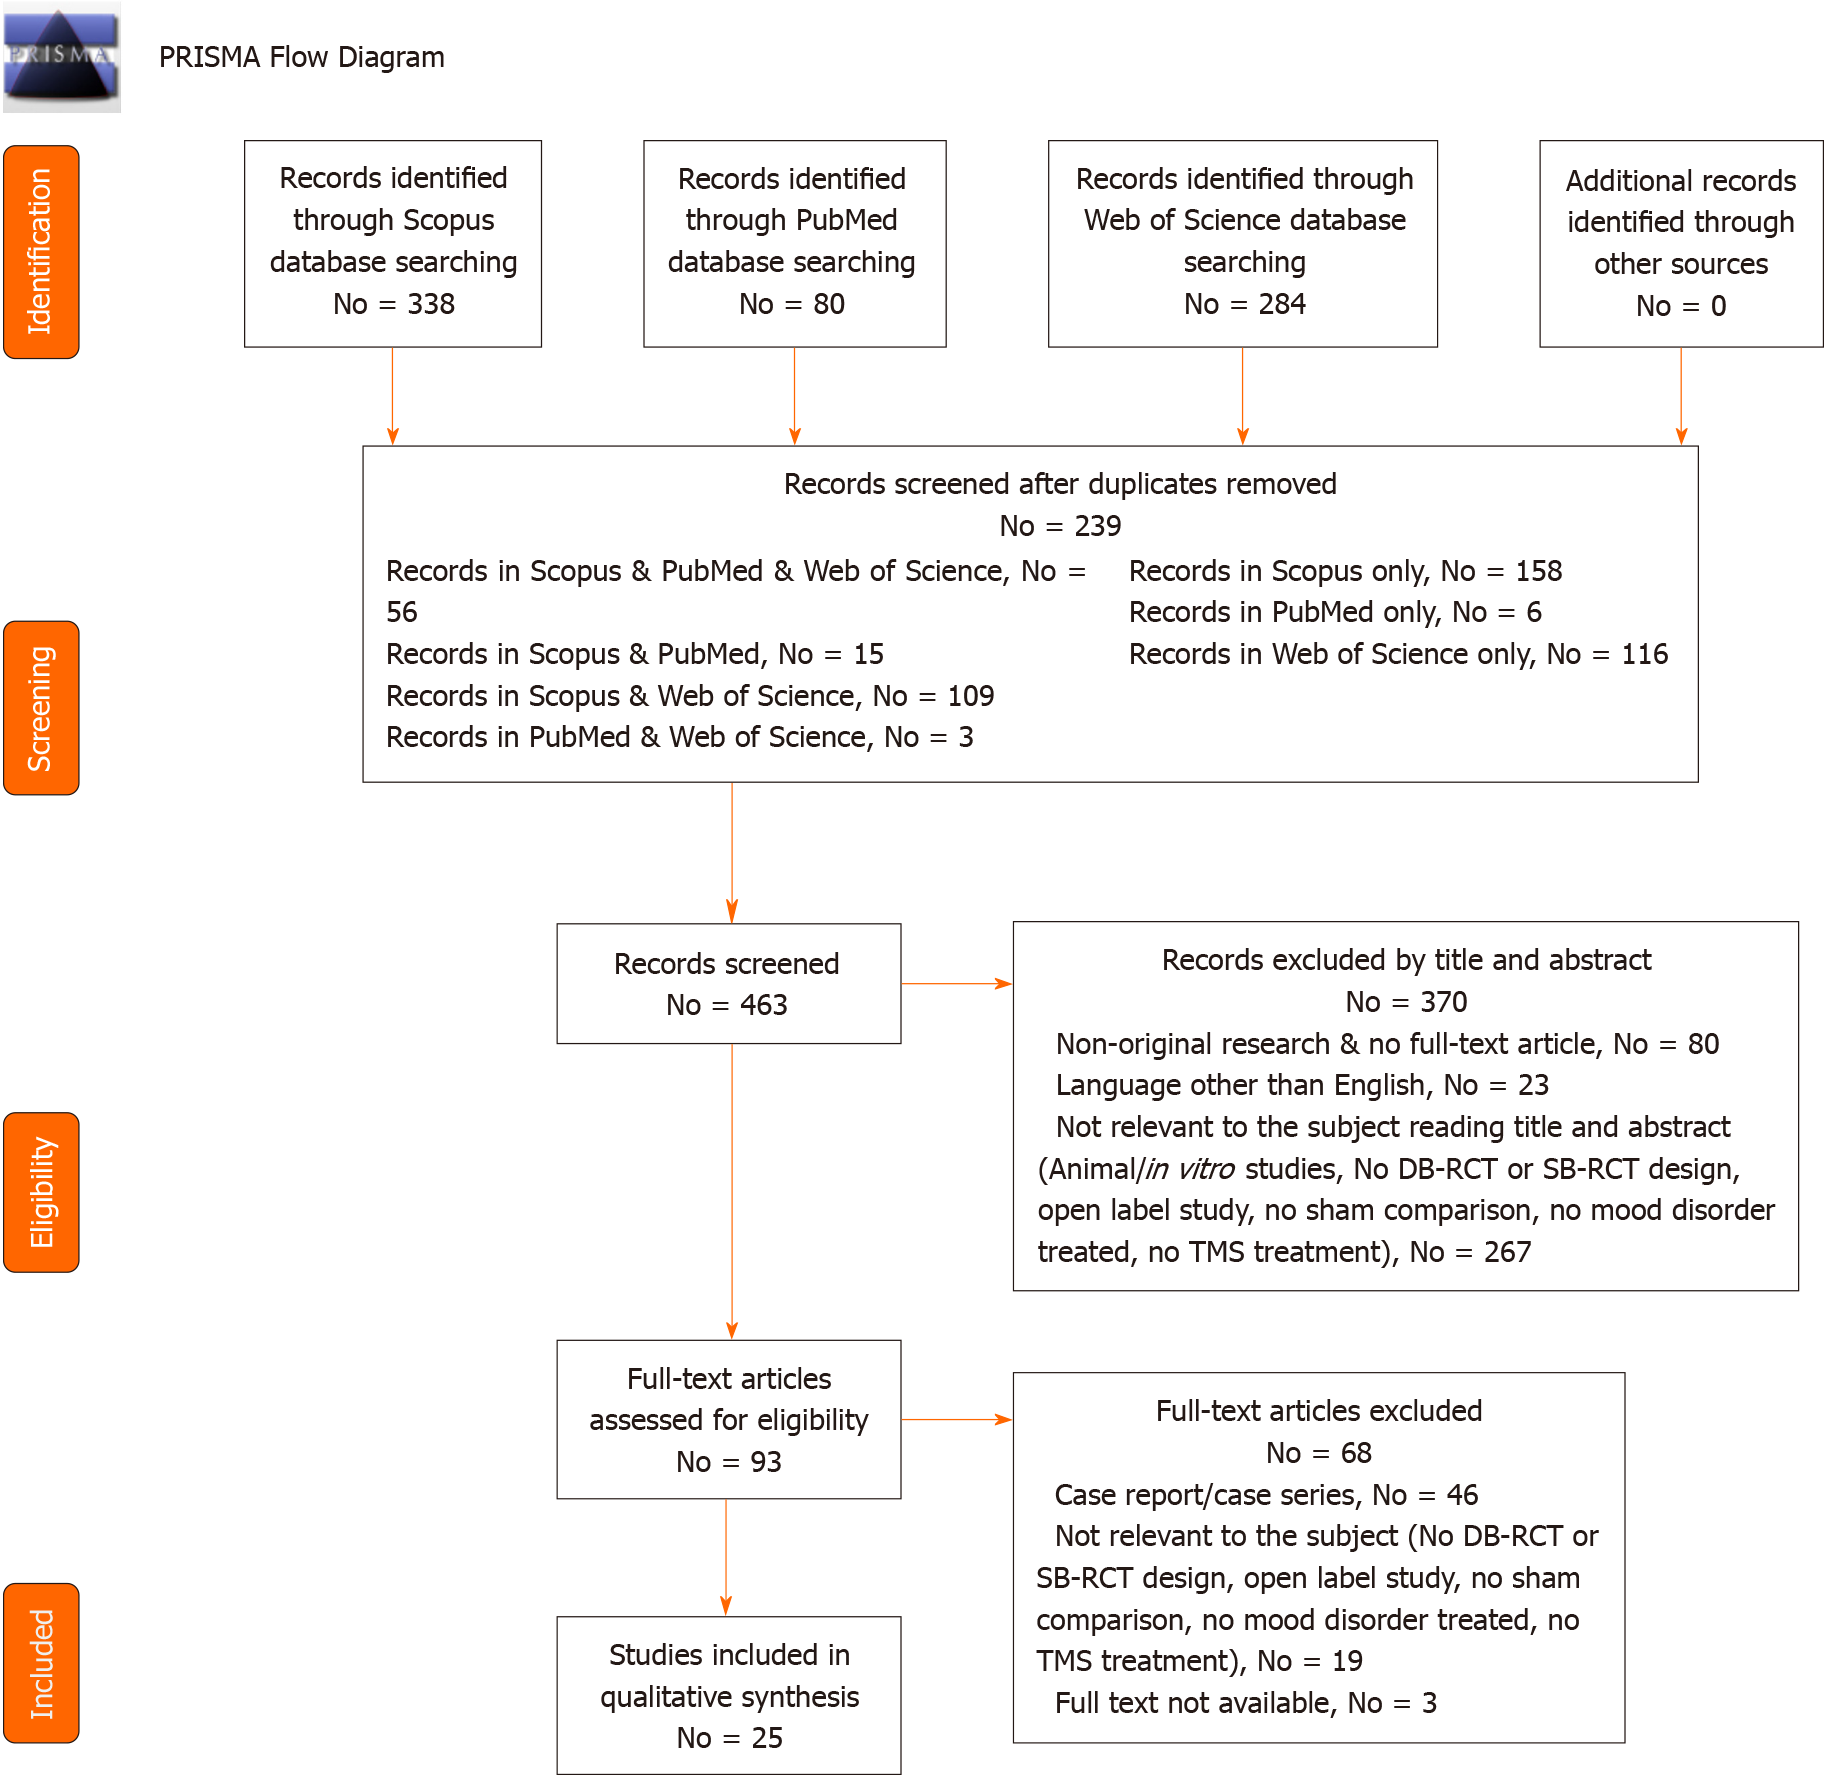
Figure 1 PRISMA flow diagram: Studies included in qualitative and quantitative synthesis.
DB-RCT: Double blind randomized controlled trials; SB-RCT: Single blind randomized controlled trials.
Figure 2
Risk of bias assessment.
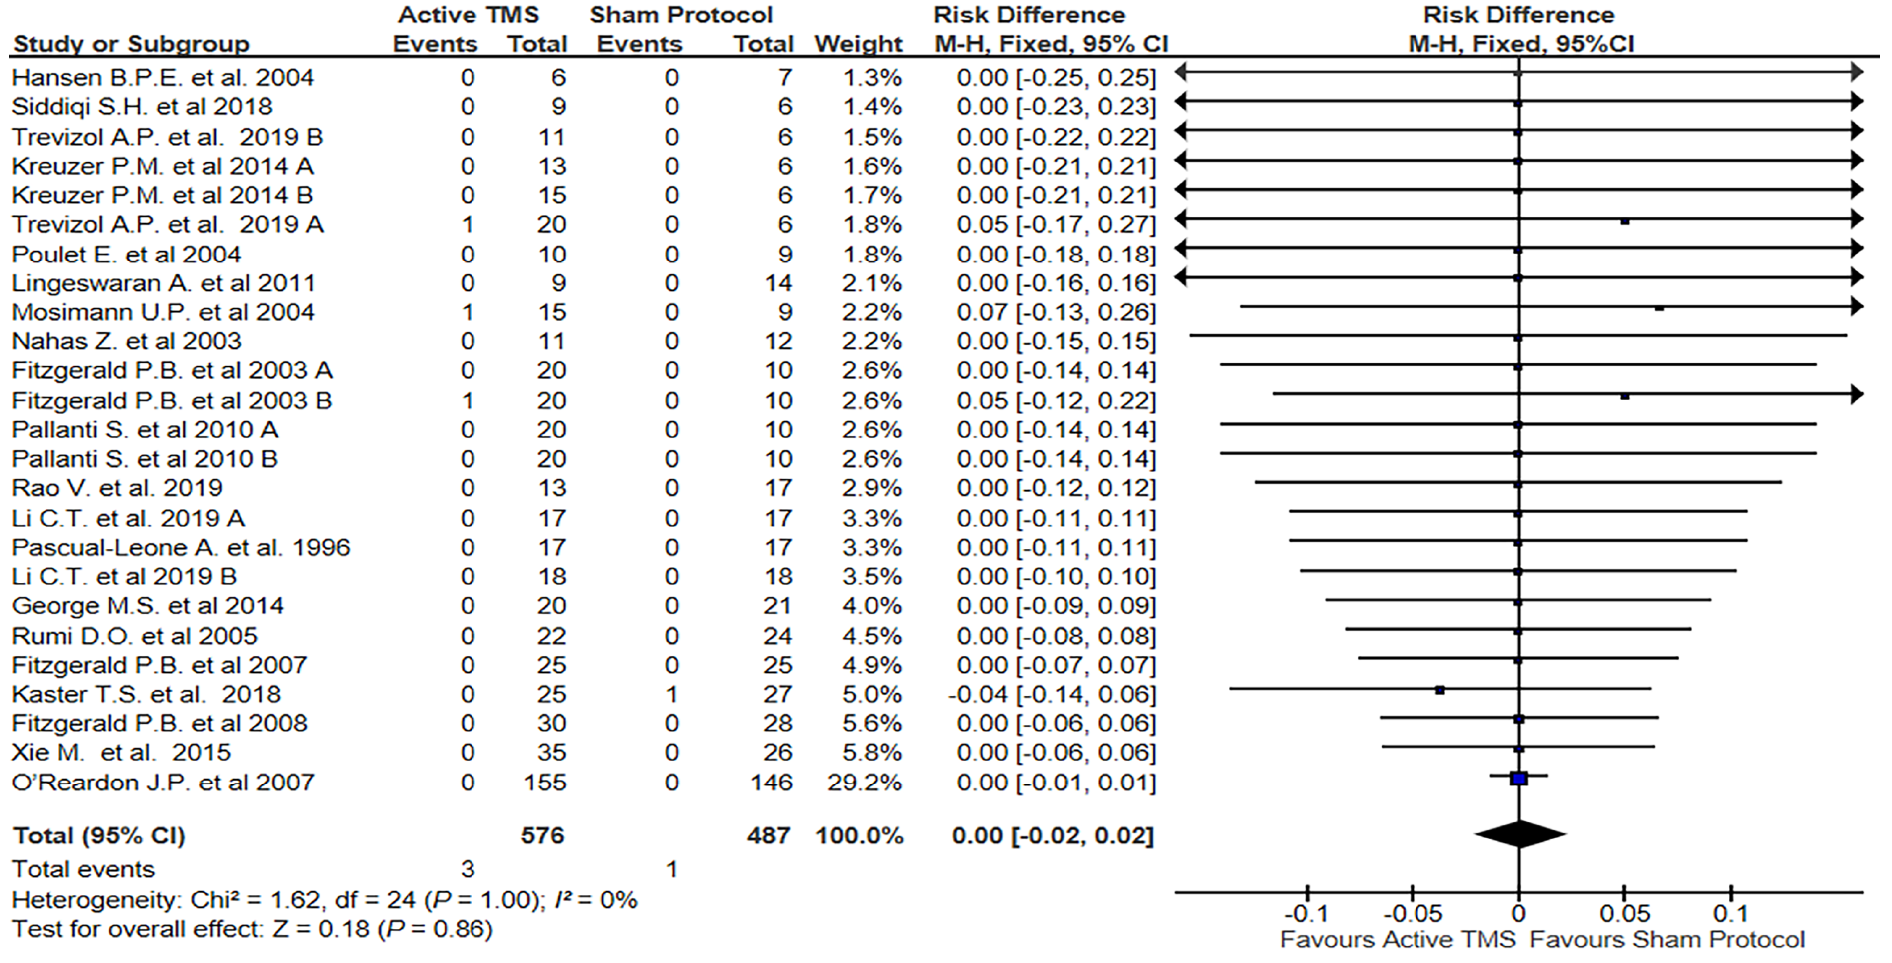
Figure 3 Forest plot: Risk to develop a hypomanic/manic switch after a transcranial magnetic stimulation protocol.
TMS: Transcranial magnetic stimulation.
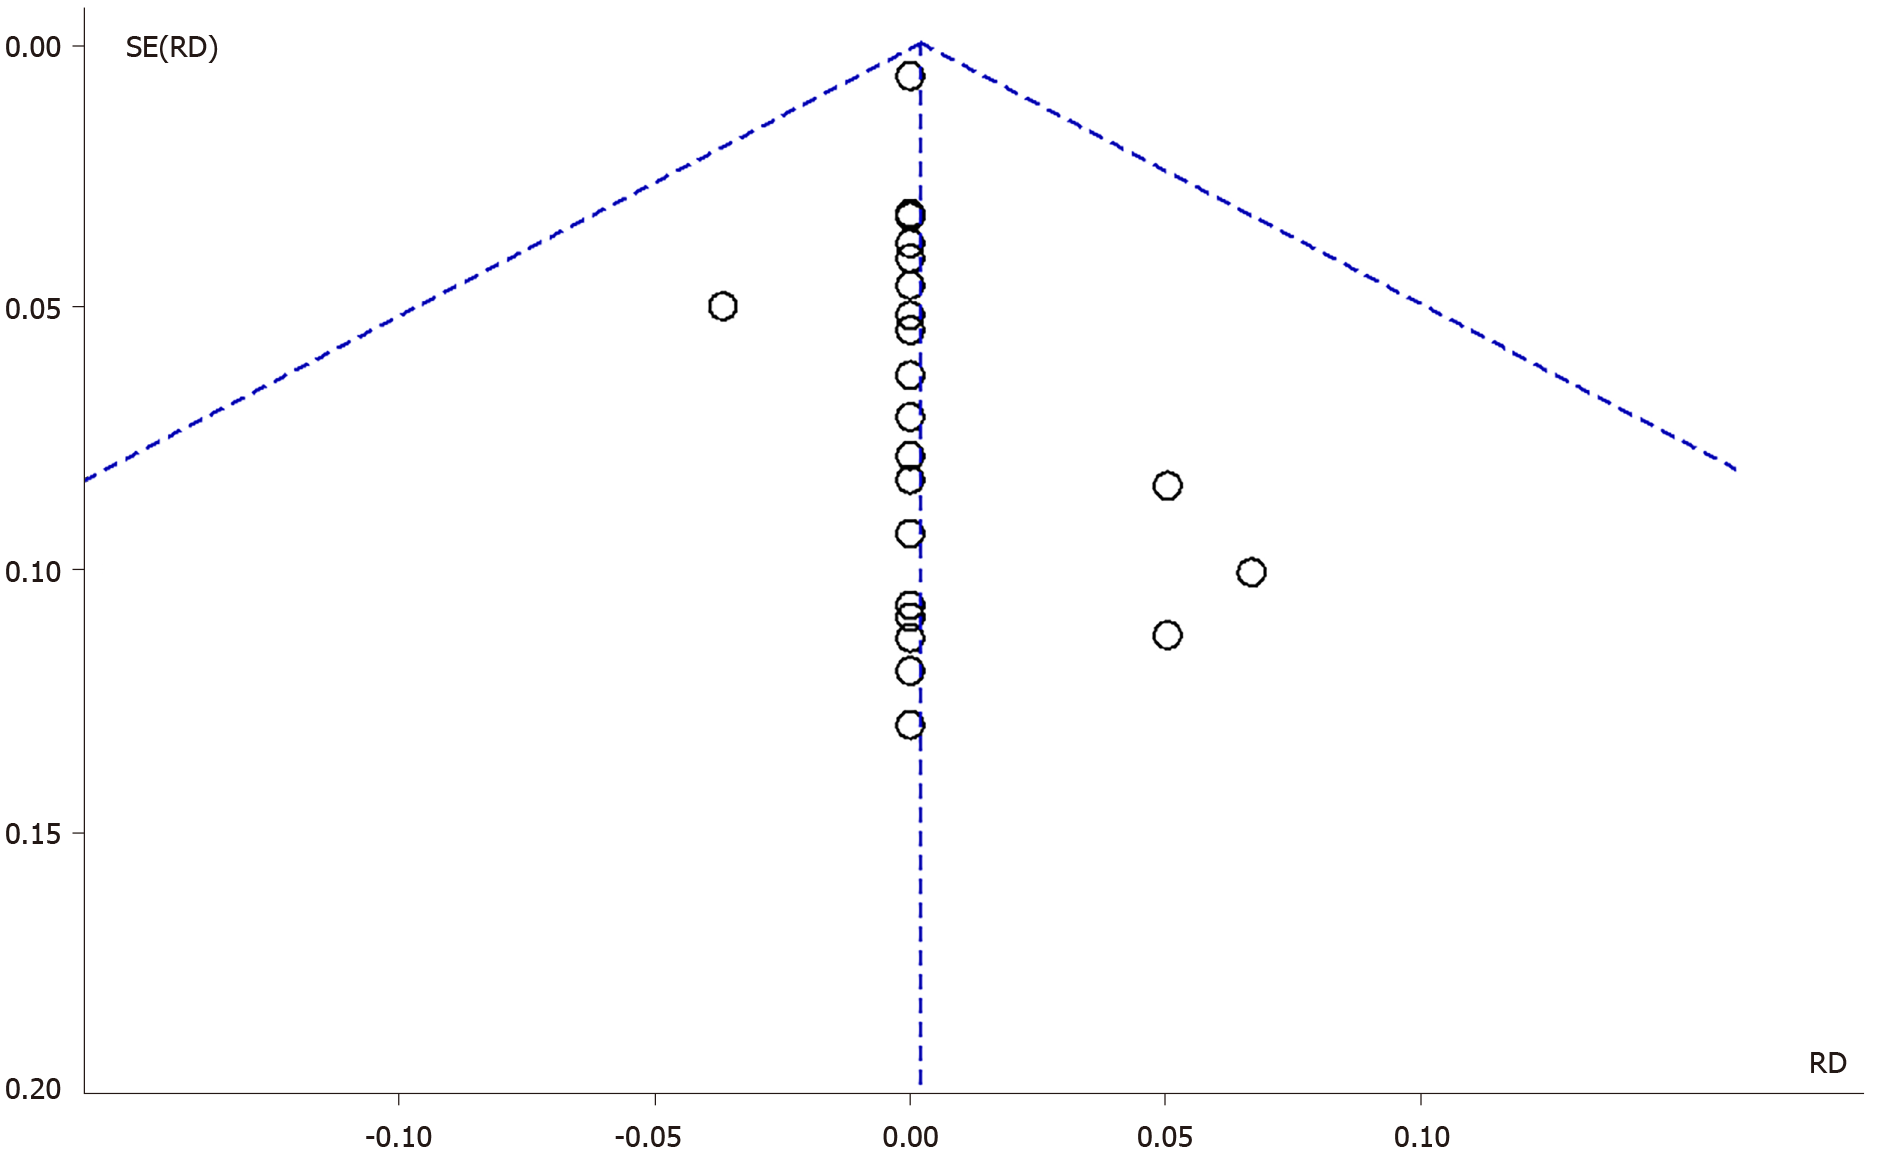
Figure 4 Funnel plot for publication bias.
RD: Risk difference.
- Citation: Miuli A, Sepede G, Stigliano G, Mosca A, Di Carlo F, d’Andrea G, Lalli A, Spano MC, Pettorruso M, Martinotti G, di Giannantonio M. Hypomanic/manic switch after transcranial magnetic stimulation in mood disorders: A systematic review and meta-analysis. World J Psychiatr 2021; 11(8): 477-490
- URL: https://www.wjgnet.com/2220-3206/full/v11/i8/477.htm
- DOI: https://dx.doi.org/10.5498/wjp.v11.i8.477


