Copyright
©The Author(s) 2021.
World J Psychiatr. Jul 19, 2021; 11(7): 375-387
Published online Jul 19, 2021. doi: 10.5498/wjp.v11.i7.375
Published online Jul 19, 2021. doi: 10.5498/wjp.v11.i7.375
Figure 1 Graphical displays of the two factors/components derived from the multiple correspondence analysis.
Active variables (sociodemographic variables). Age (≤ 25, 26-35, > 35); Marital status (single, spouse/partner, divorced/widow(er); Educational level (primary education, secondary education, higher education); Employment status (employed, unemployed, student, disabled, non-paid work/housewife); Living situation (alone, partner/children, friends, parents/siblings). Active variables (questionnaires). Metacognitions questionnaire, (0: ≤ 57, 1: 58-75, 2: > 75). Clinical impairment assessment, (0: ≤ 16, 1: ≥ 16); Eating attitudes test, (0: ≤ 8, 1: ≥ 8). Health-related quality of life in eating disorder-short form, [social maladjustment domain, (0: ≤ 50, 1: > 50); Mental health and functionality domain, (0: ≤ 50, 1: > 50); Penn state worry questionnaire (0: ≤ 28, 1: > 28). Red triangles represent the categories of the active variables. White triangles represent the categories of the illustrative or outcome variables. TP1: B EDNOS: Type of patient 1: Binge-eating disorder not-otherwise specified; TP1: P EDNOS: Type of patient 1: Purgative- eating disorder not-otherwise specified; TP1: R EDNOS: Type of patient 1: Restrictive- eating disorder not-otherwise specified; TP1: P BN: Type of patient 1: Purging-bulimia nervosa; TP1: P AN: Type of patient 1: Purging-anorexia nervosa, TP1: R AN: Type of patient 1: restrictive-anorexia nervosa; TP2: R: Type of patient 2: restrictive; TP2: P: Type of patient 2: Purgative; TP2: B: Type of patient 2: binge; G: Gender; F: Female; M: Male; MS: Marital status; EL: Educational level; ES: Employment status; LS: Living situation; MCQ: Metacognitions questionnaire; CIA: Clinical impairment assessment; EAT: Eating attitudes test; HeRQoLED-s: Health-related quality of life in eating disorder-short form; SocM: Social maladjustment domain; MHF: Mental health and functionality domain; PSWQ: Penn State Worry Questionnaire.
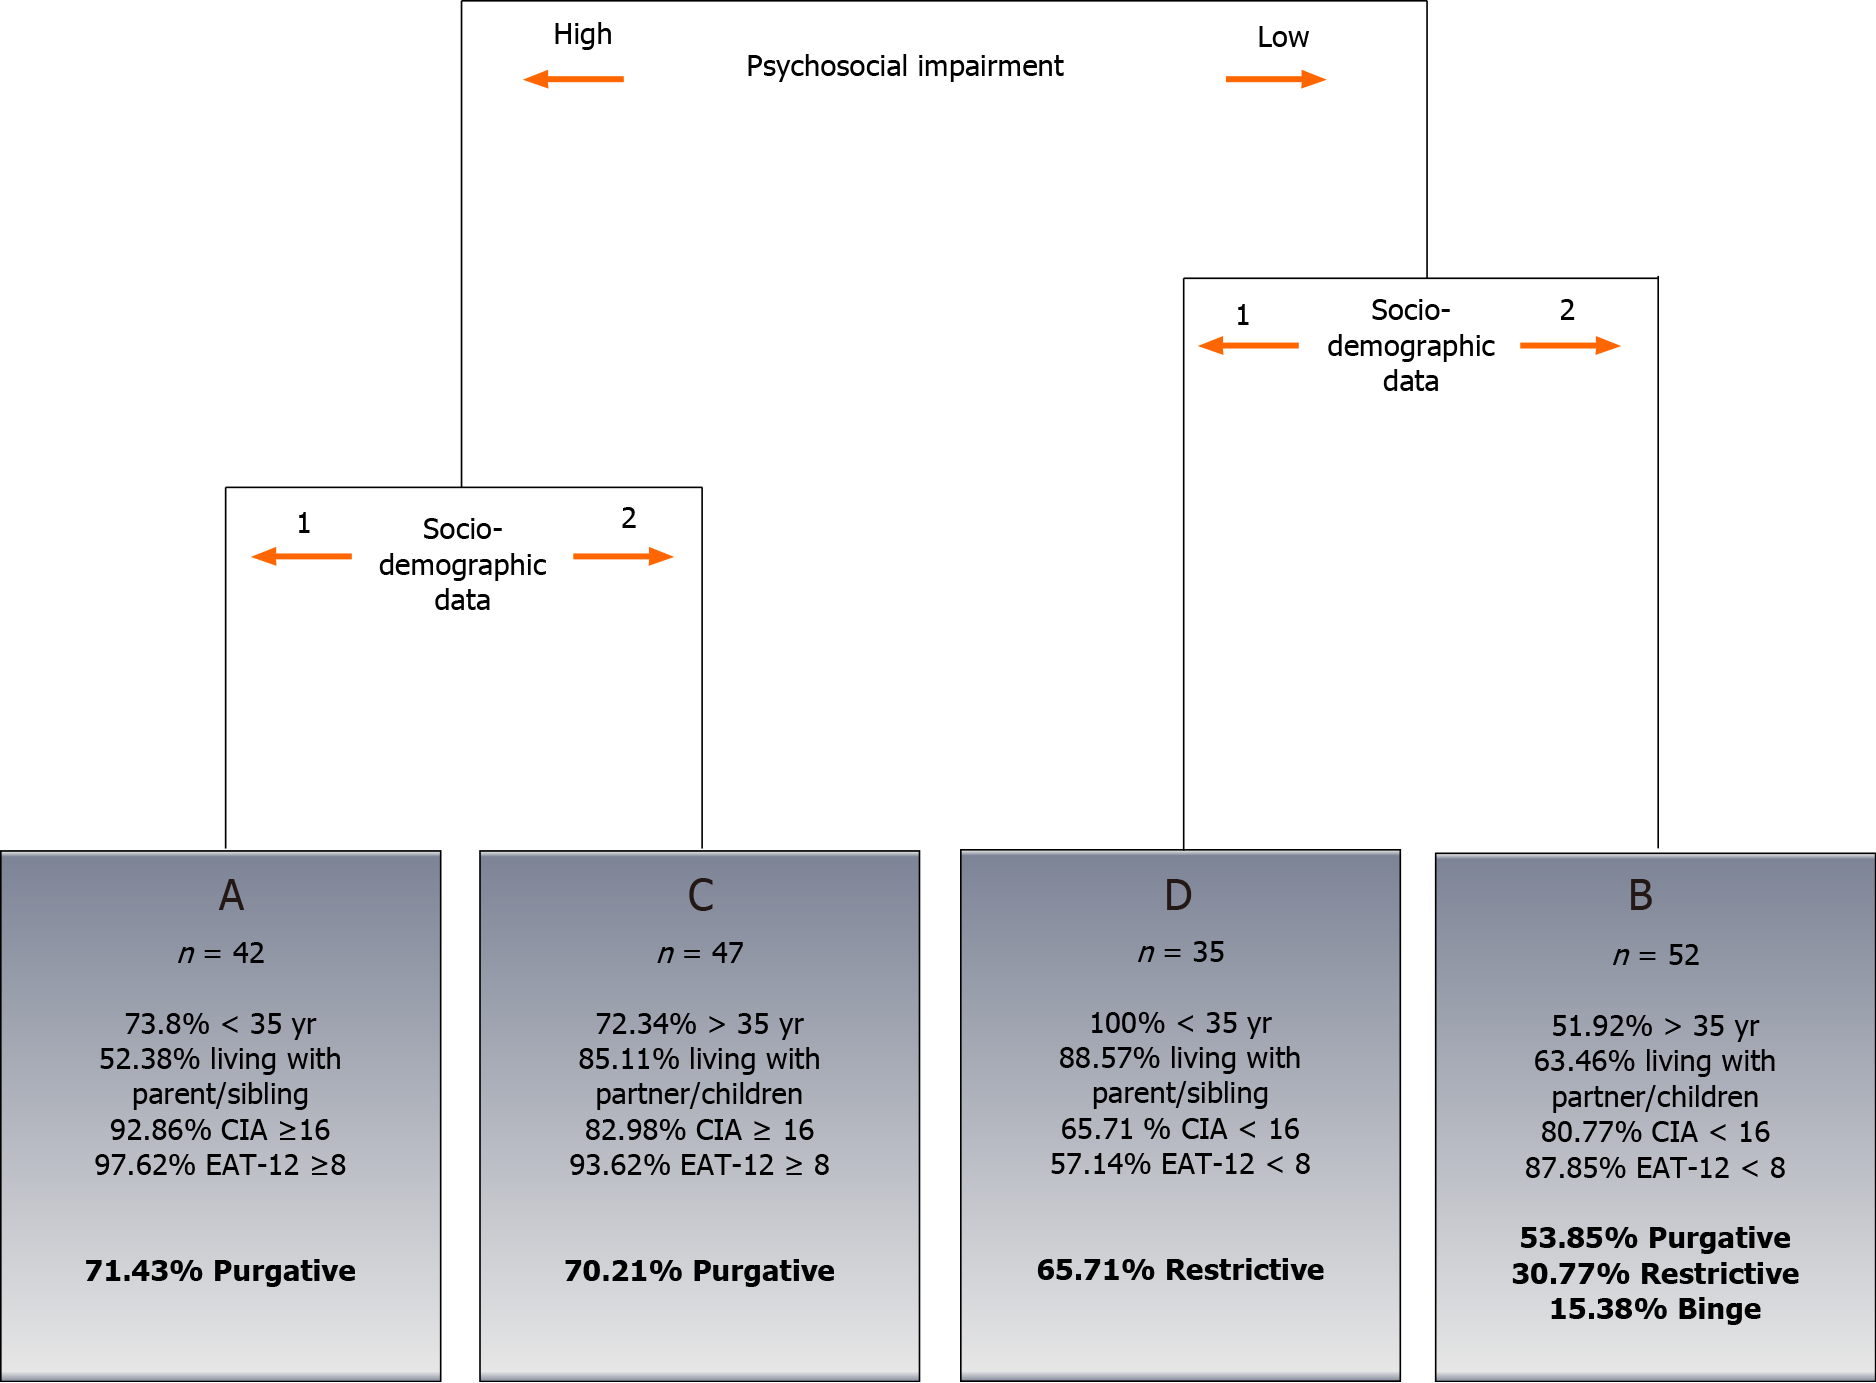
Figure 2 Dendogram obtained from the cluster analysis.
The dendogram represents the results from the cluster analysis performed with the two components obtained from the multiple correspondence analyses. The graphical display includes an easy interpretation of the clustering and a brief description of the identified groups. 1Having < 35 years, being single, having higher studies, being a student and living with friends or parents or/and a sibling; 2Having > 35 years, being male, having a spouse, having secondary studies, being a housewife and living with partner/children.CIA: Clinical impairment assessment; EAT: Eating attitudes test.
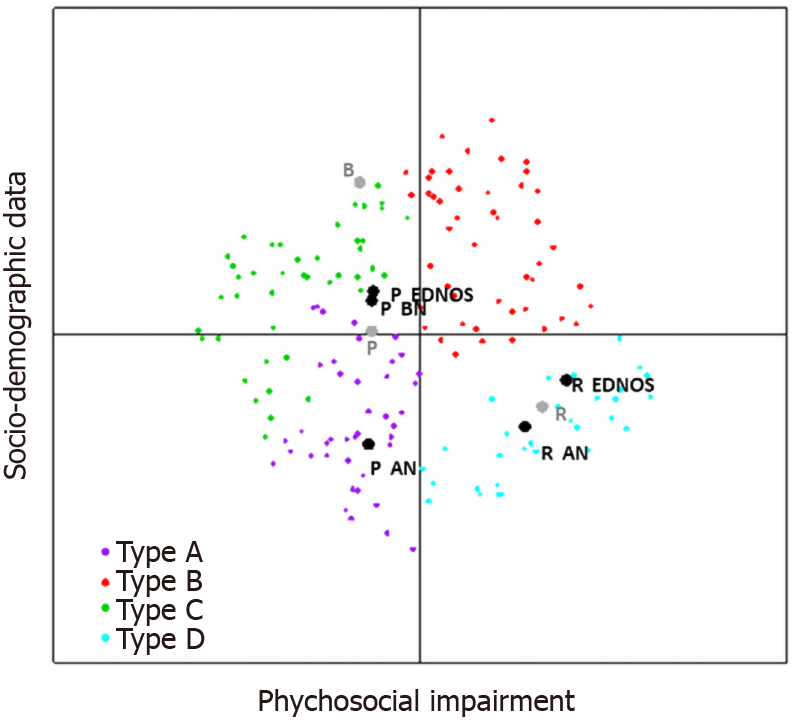
Figure 3 Map created by the first and second factors derived from the multiple correspondence analysis.
Black dots in the plane represent the categories of the illustrative variable “subtypes of diagnosis according to compensatory behaviour and Diagnostic and Statistical Manual of Mental Disorders-IV classification”. Grey dots represent the categories of the illustrative variable “subtype of diagnosis according to compensatory behaviour”. The relative positions of the patients in this plane are represented by different colours, depending on the type derived from the cluster. B EDNOS: Eating disorder not otherwise specified, subtype binge; P EDNOS: Eating disorder not otherwise specified, subtype purgative; P BN: Bulimia nervosa, subtype purgative; P: Purgative; P AN: Anorexia nervosa, subtype purgative; R EDNOS: Eating disorder not otherwise specified, subtype restrictive; R: Restrictive; R AN: Anorexia nervosa, subtype restrictive.
- Citation: Martín J, Anton-Ladislao A, Padierna Á, Berjano B, Quintana JM. Classification of subtypes of patients with eating disorders by correspondence analysis. World J Psychiatr 2021; 11(7): 375-387
- URL: https://www.wjgnet.com/2220-3206/full/v11/i7/375.htm
- DOI: https://dx.doi.org/10.5498/wjp.v11.i7.375


