Copyright
©The Author(s) 2021.
World J Psychiatr. Dec 19, 2021; 11(12): 1301-1313
Published online Dec 19, 2021. doi: 10.5498/wjp.v11.i12.1301
Published online Dec 19, 2021. doi: 10.5498/wjp.v11.i12.1301
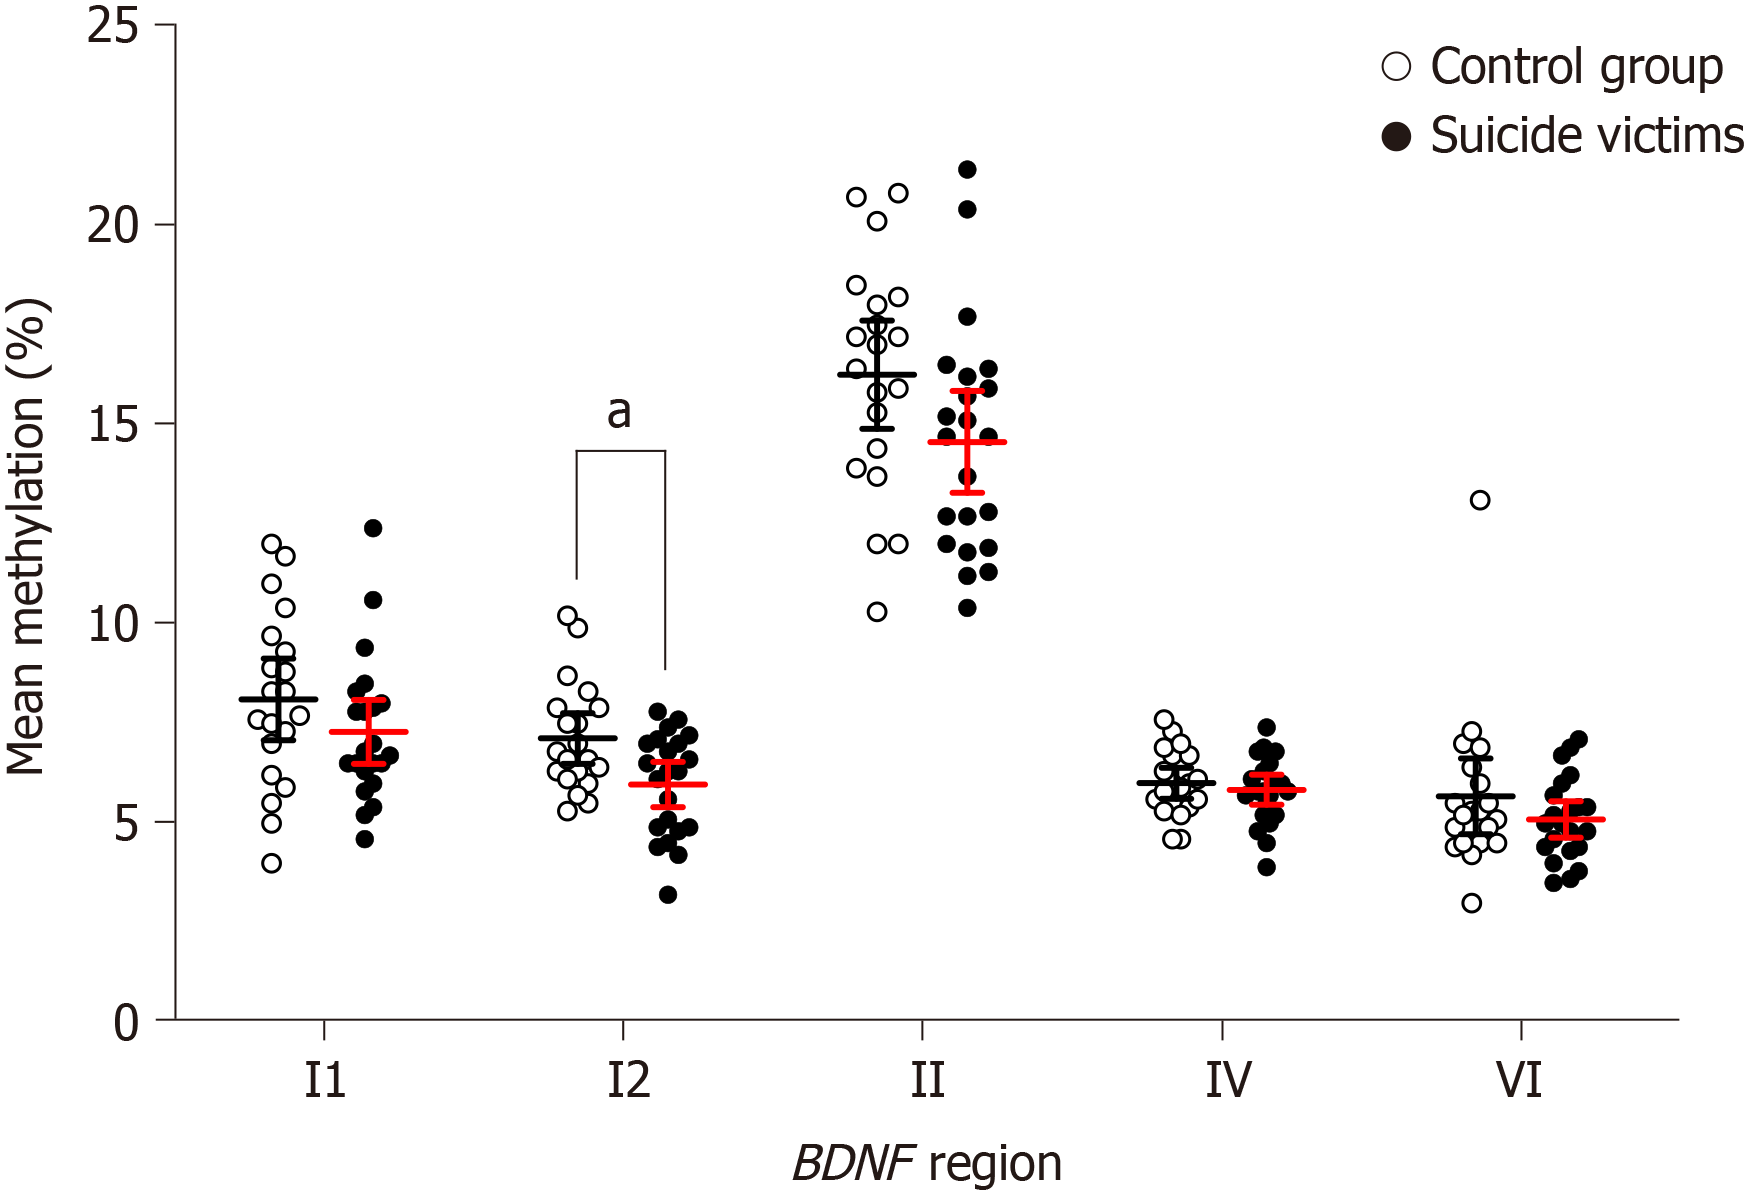
Figure 1 Methylation levels across the five studied BDNF regions in the blood from the control subjects and suicide victims.
The studied regions are labelled with Roman numerals (I, II, IV, and VI) according to the vicinity of the exons 1, 2, 4, or 6. The region preceding the first exon (I) is divided into two parts, I1 and I2 due to technical reason of maximum amplicon length recommendation for 454 GS Junior sequencing system (400 bp/region, including 454 GS Junior sequencing primers). Each circle symbol represents an individual study subject. Data are medians (horizontal bars) of the mean methylation levels for the BDNF regions ± 95% confidence interval (red, suicide victims). aP < 0.05 (two-tailed Student’s t test for two independent samples) between groups.
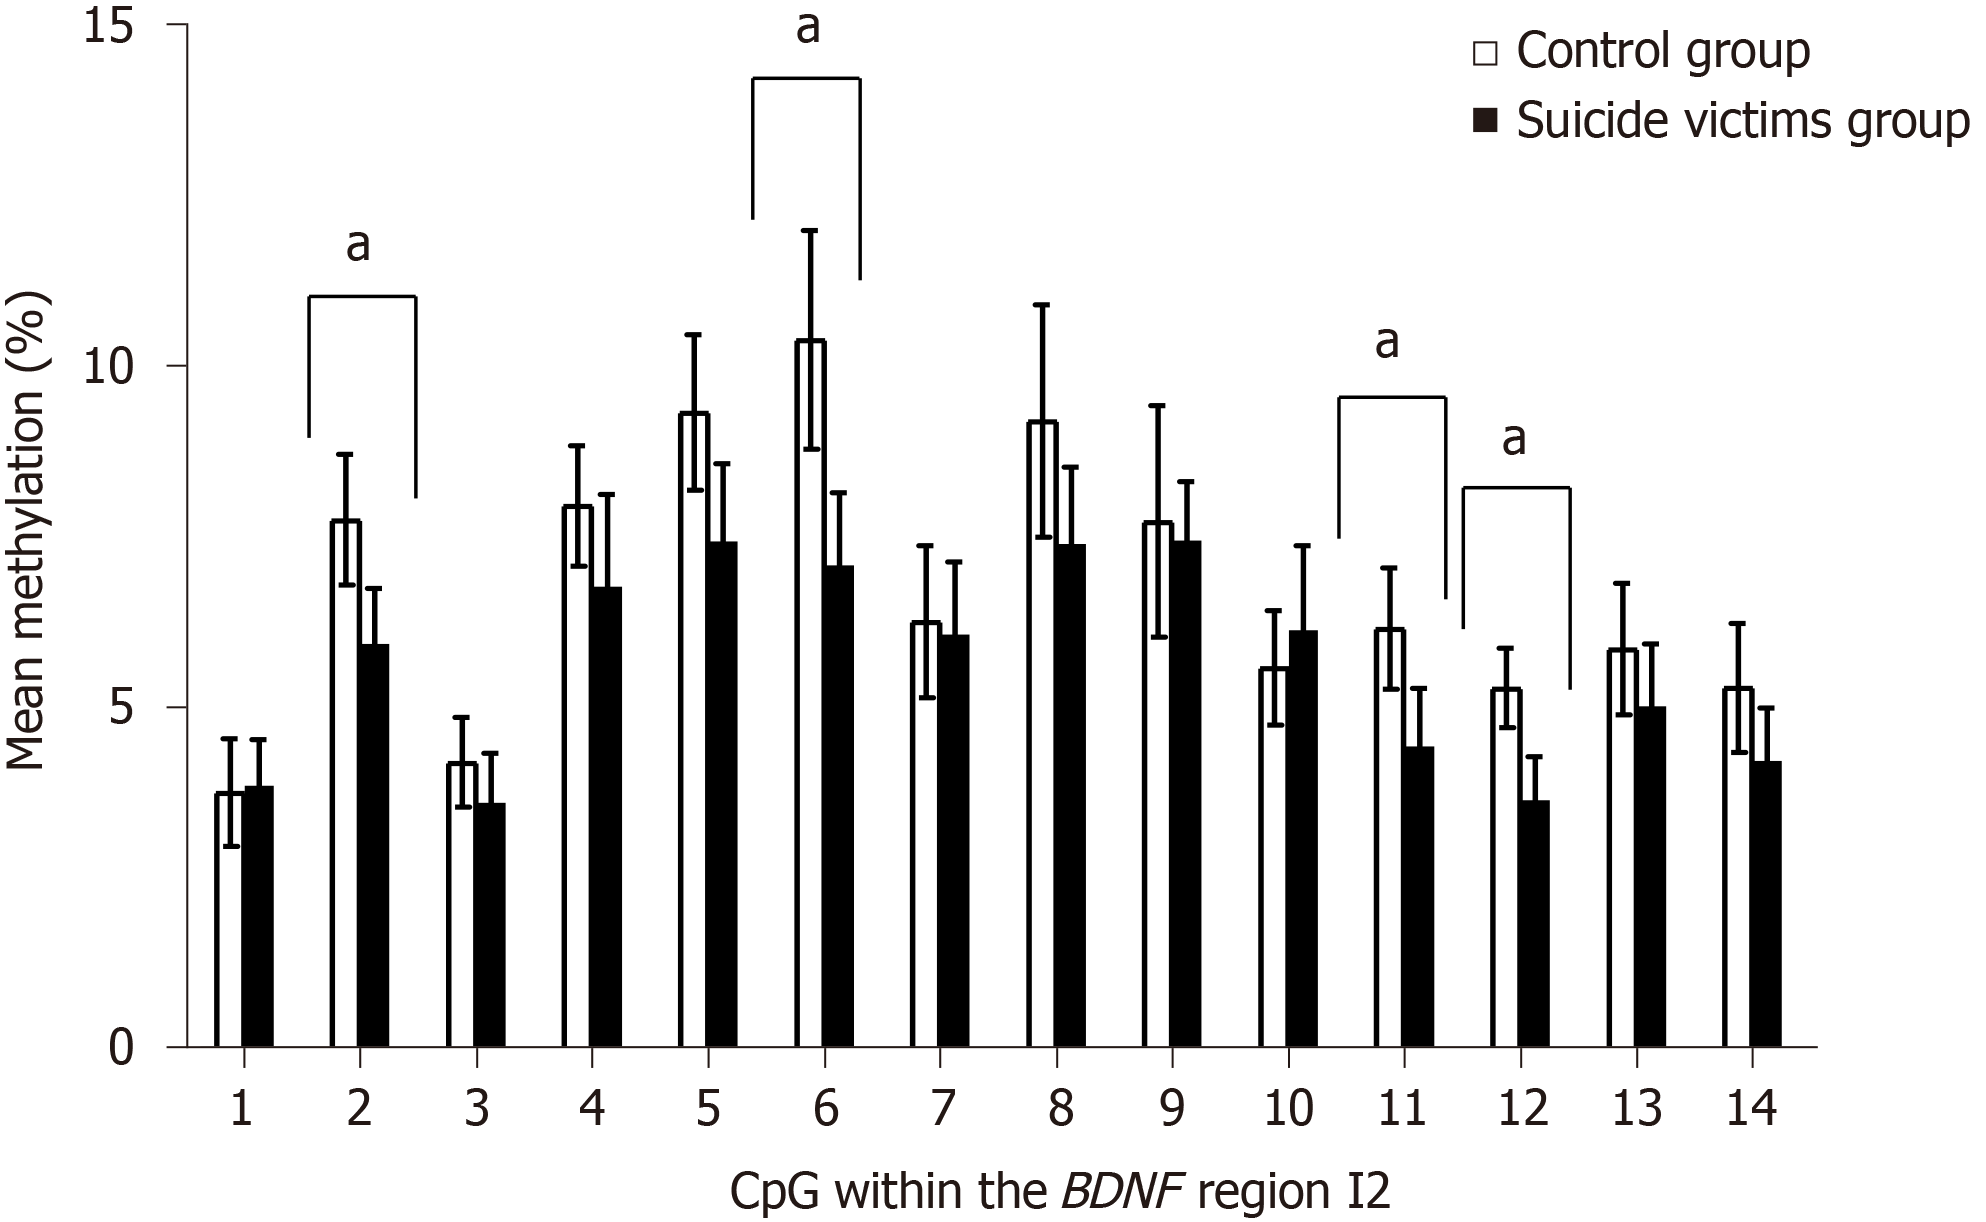
Figure 2 Methylation levels of individual CpGs within the BDNF I2 region in the blood from the control subjects and suicide victims.
Data are means ± 95% confidence interval; aP < 0.05 (two-tailed Student’s t test for two independent samples) between groups.
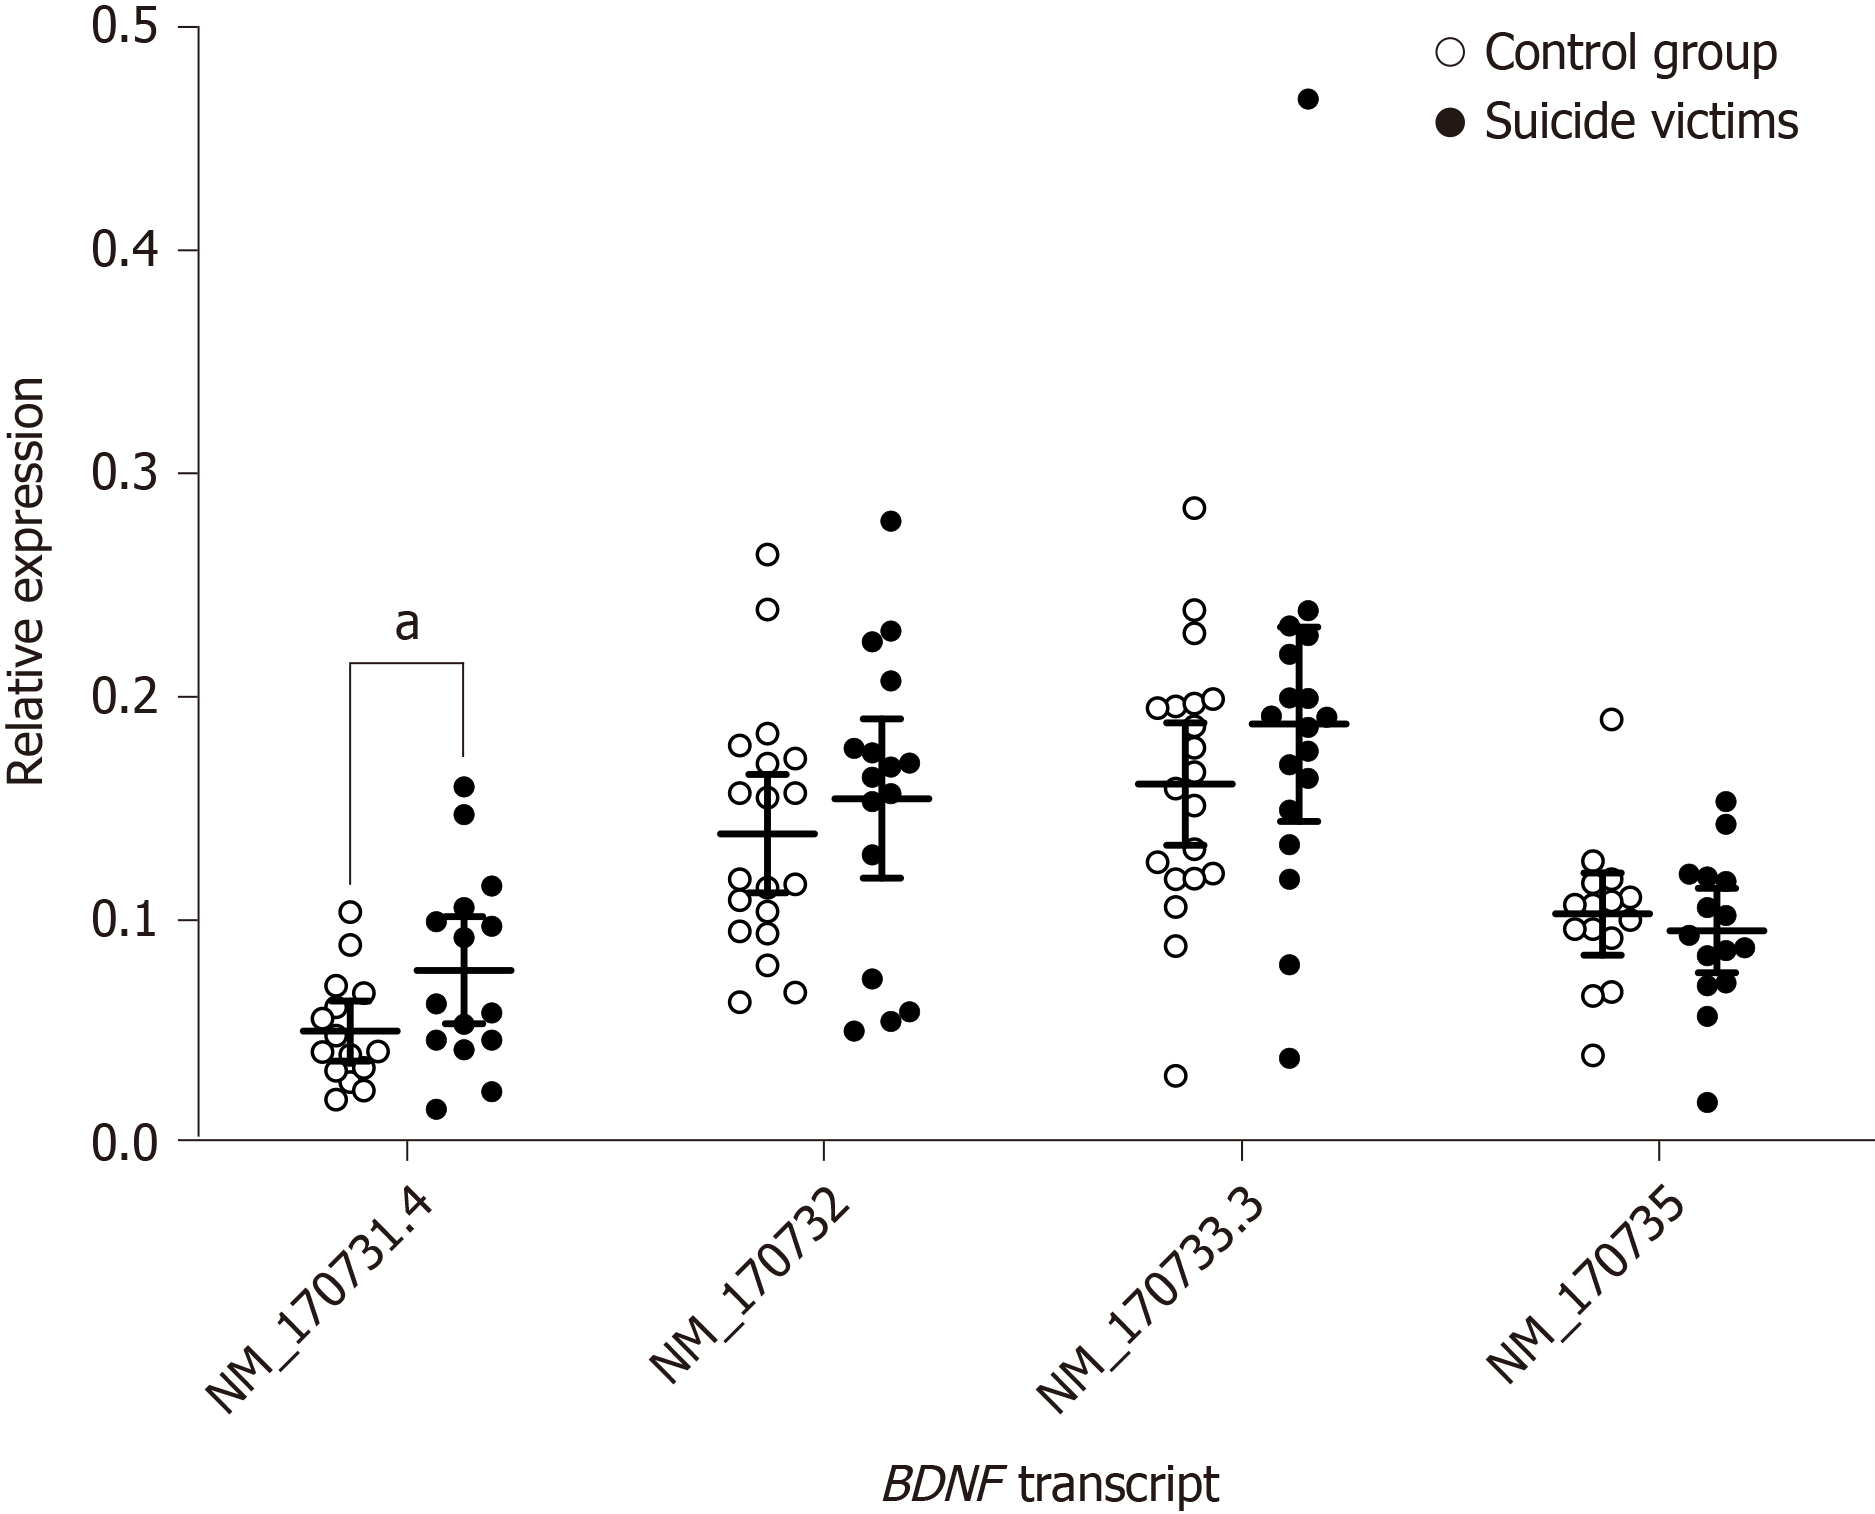
Figure 3 Relative expression levels of alternative BDNF transcripts in the Brodmann area 9 brain region of the control subjects and suicide victims.
Each circle symbol represents an individual study subject. Data are medians (horizontal bars) of the mean methylation levels for the BDNF regions ± 95% confidence interval (black, suicide victims). aP < 0.05 (two-tailed Student’s t test for two independent samples) between groups.
- Citation: Ropret S, Kouter K, Zupanc T, Videtic Paska A. BDNF methylation and mRNA expression in brain and blood of completed suicides in Slovenia. World J Psychiatr 2021; 11(12): 1301-1313
- URL: https://www.wjgnet.com/2220-3206/full/v11/i12/1301.htm
- DOI: https://dx.doi.org/10.5498/wjp.v11.i12.1301


