Copyright
©The Author(s) 2015.
World J Exp Med. May 20, 2015; 5(2): 140-153
Published online May 20, 2015. doi: 10.5493/wjem.v5.i2.140
Published online May 20, 2015. doi: 10.5493/wjem.v5.i2.140
Figure 1 Histological analysis of subcutaneous murine muscle implants.
A: Representative images of HPS-stained (upper panel) and desmin-stained (lower panel) sections of a cryopreserved mouse mince muscle implant at 30 d after implantation. From top to bottom are visible the skin layers (epidermis, dermis and hypodermis), the panniculus carnosus muscle (PC, arrow), a thin layer of connective tissue surrounding the implant (light yellow, arrowhead) and tissues composing the implant (e.g., adipose, skeletal muscle, nerves and other tissues). The intense brown desmin stain (lower panel) identifies myofibers of the PC (host) and myoblasts as well as regenerating myofibers of the implant. Scale bar is 500 μm; B: Higher magnifications of the marked areas in A. (1 and 4), connective tissue encapsulating the implant (asterisk). Arrows indicate PC. (2 and 5), adipose tissue and myoblast/myofibers in the central part of the implant. (3 and 6), areas of regeneration with myofibers positioned at different angles. Scale bar is 100 μm; C: Exemplary areas showing specific cells and structures as observed both in fresh and cryopreserved implants. For each pair of images the upper panels correspond to HPS- and desmin-stained tissue sections, respectively. (1, 5, 2 and 6), myoblasts and newly formed myofibers of different sizes and positioned at different angles. (3, 7, 4 and 8), blood vessels (asterisks) and nerves (n) usually located at the edges of the implants. (9, 13, 10 and 14), areas of active regeneration with centronucleated myofibers of different sizes. (11 and 15), degenerated myofibers devoid of nuclei and desmin. (12 and 16), myoregeneration within an adipogenic area. Scale bar is 100 μm for 1-8 and 50 μm for 9-16 is 50 μm. Note the images of HPS- and desmin-stained tissue sections do not always show overlapping areas.
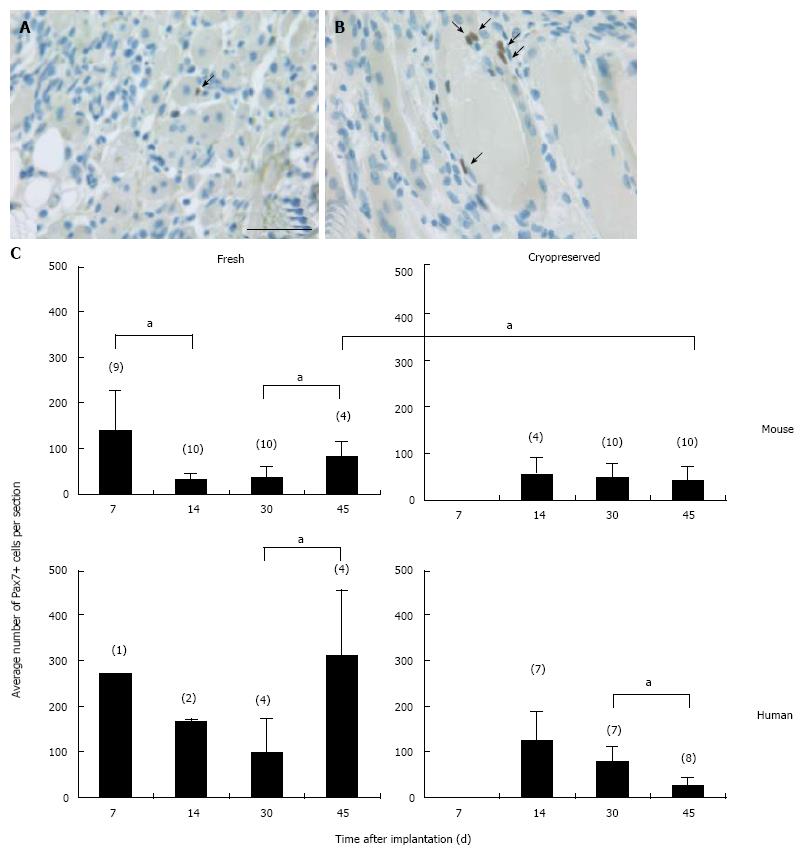
Figure 2 Pax7+ cells in regenerating skeletal muscle implants.
A, B: Examples of single (A and B) and pairs of (B) Pax7+ cells (arrows) attached or positioned in close proximity to myofibers in a fresh mouse implant at 14 d after implantation. Scale bar is 50 μm; C: Pax7+ cell counts in cross sections of fresh and cryopreserved mouse and human implants. From the center of each implant two or three consecutive sections were stained for Pax7. The average number of Pax7+ cells per section and SD are plotted. Data from implants with or without MSCs were pooled as they contained very similar numbers of Pax7+ cells. Numbers in parentheses indicate numbers of implants analyzed. aP < 0.05.
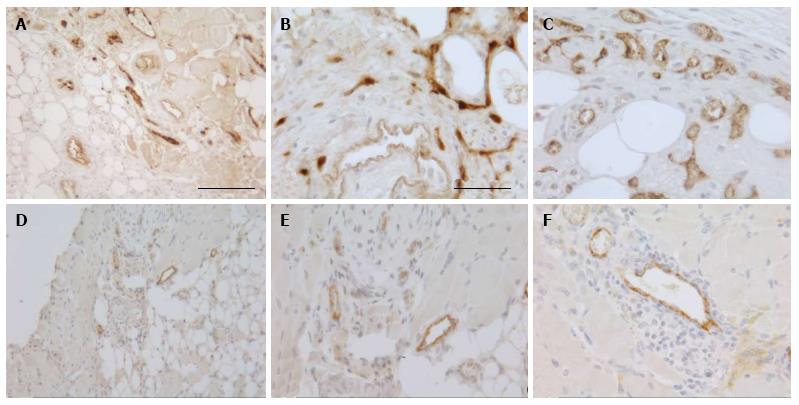
Figure 3 Vascularization of subcutaneous skeletal muscle implants.
Photomicrographs of sections of fresh human (A-C) and mouse (D-F) minced implants at 30 d after transplantation stained for vWF (brown). Scale bar is 100 μm for (A, D) and 50 μm for (B, C, E, F).
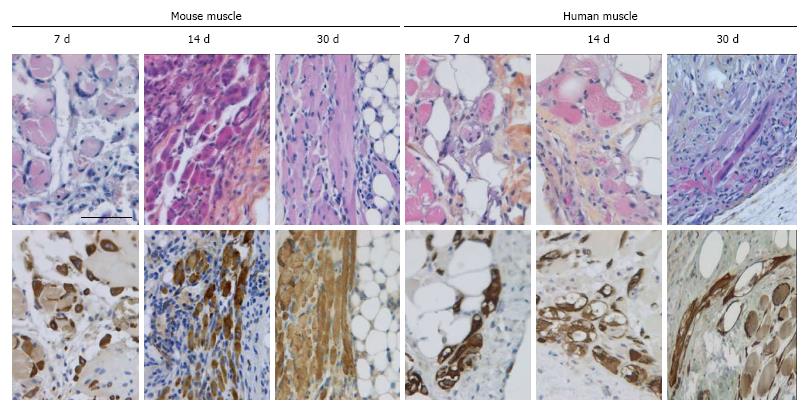
Figure 4 Myoregeneration of mouse and human minced cryopreserved muscle implants.
Mouse and human fresh muscle implants were excised at different time points and stained with HPS (upper panels) or for desmin (lower panels). In the mouse implants progression of myoregeneration over time from myoblasts to small and large myofibers was evident. In the human implants, fewer myoblast/myofibers were identified at all time points. Scale bar is 50 μm.
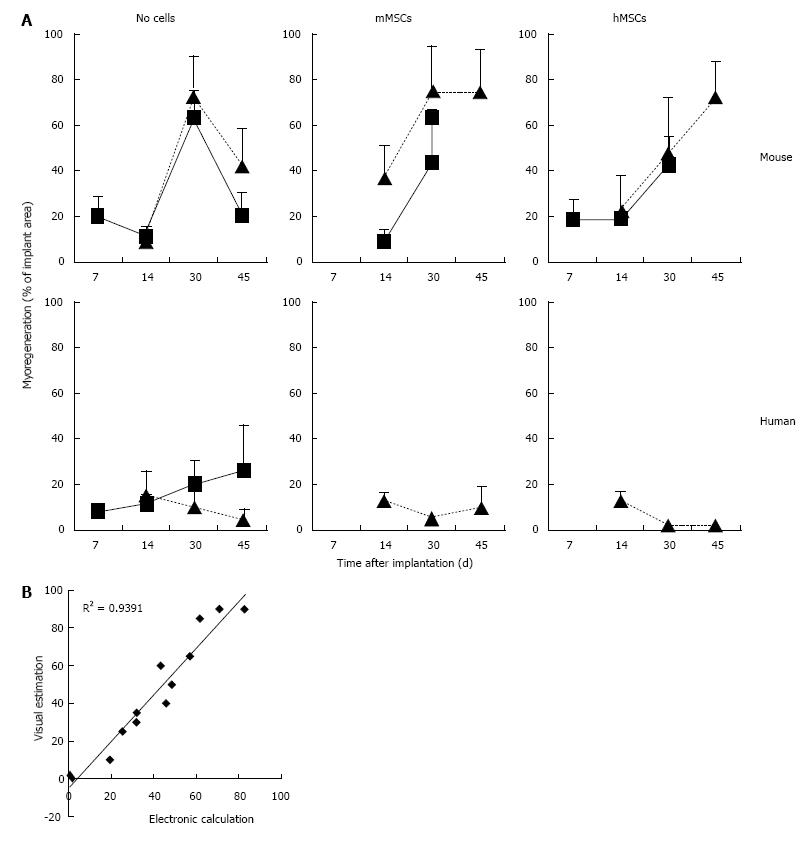
Figure 5 Myoregeneration kinetics of minced muscle implants without and with mesenchymal stem cells.
A: The data represent visual estimates derived from microscopic examination of 2 or 3 desmin-stained sections through the center of fresh (square frame and solid line) and cryopreserved (triangle and broken line) implants. Each point represents the mean with SD of between 2 and 10 (average 4) implants; B: Comparison between visual estimation and electronic calculation of areas of myoregeneration. Thirteen desmin-stained cross sections were analyzed by both visual estimation (plotted on the Y-axis) and with the Interactive Image Measurement program of CELL^F imaging software (plotted on the X-axis). The excellent correlation between the two methods of analysis justifies the choice of the less laborious visual estimation procedure.
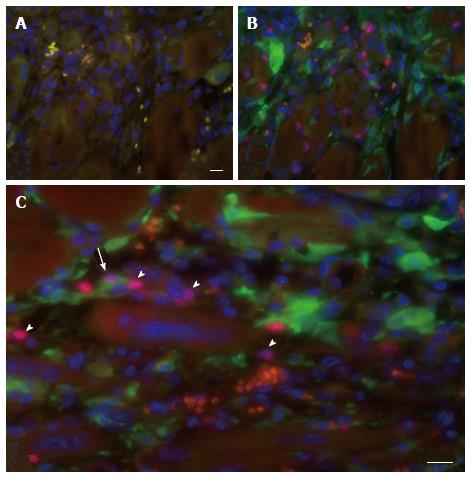
Figure 6 Contribution of host cells to myoregeneration in the muscle implant.
Immunofluorescence analysis of a fresh mouse implant excised 7 d after implantation in eGFP transgenic recipients. Host cell contribution was evaluated in tissue sections stained with the karyophilic fluorochrome Hoechst 33342 and antibodies specific for eGFP and Pax7. A: Negative control section incubated with Hoechst 33342 (blue), the secondary antibodies and Cy3-conjugated streptavidin; B: Section stained for Pax7 (red), eGFP (green) and Hoechst 33342 (blue); C: Example of a cell positive for both Pax7 and eGFP (arrow) situated at the periphery of the implant. Also present are cells only positive for Pax7 (arrowheads) or for GFP, blood vessels with erythrocytes (orange) and multinucleated myofibers (center of image). Scale bar for a and b is 50 μm. Panel (C) shows an electronic enlargement of an image recorded at the same magnification as (A) and (B).
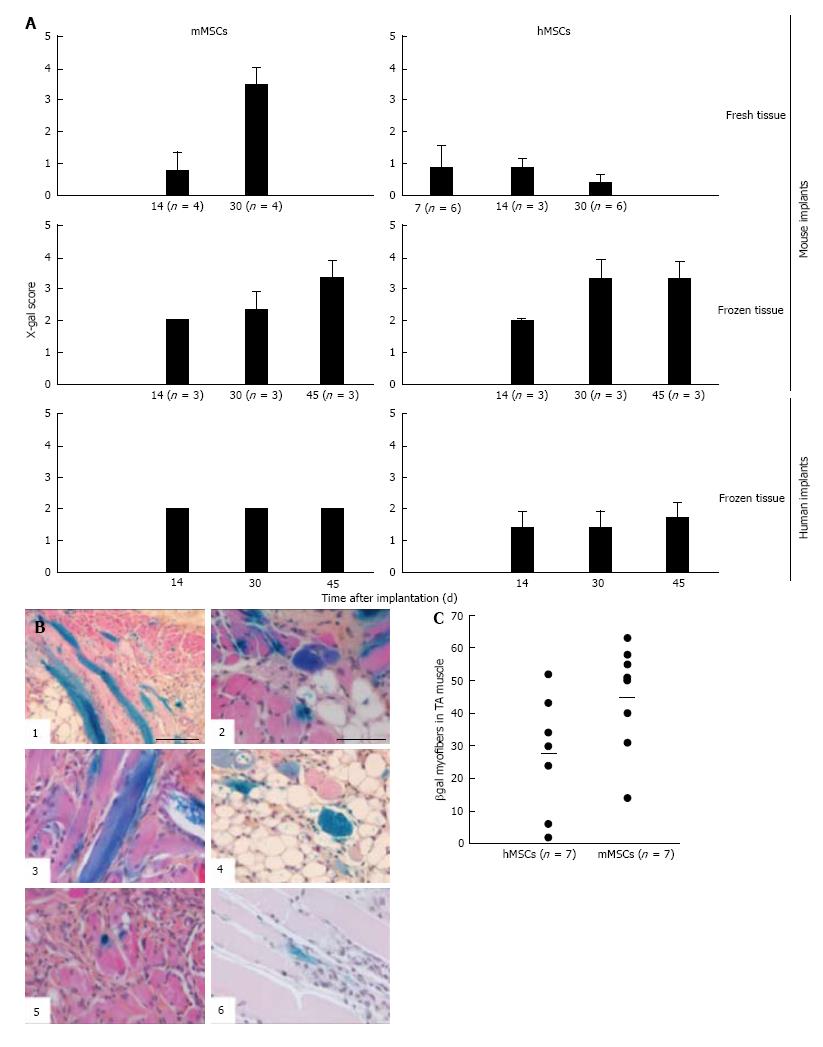
Figure 7 Contribution of mouse mesenchymal stem cells and human mesenchymal stem cells to myoregeneration in implants of fresh and cryopreserved mouse and human muscle minced.
MSCs and their derivatives were identified by X-gal staining. A: For comparing implants we used an arbitrary score described in Results. Plotted in A is the average X-gal score and SD. Numbers in parentheses indicate number of implants analyzed; B: Representative images of X-gal-stained sections of fresh mouse muscle implants at 30 d after grafting. Note the higher frequency of blue myofibers (longitudinal and transversal cuts) and β-gal+ mononuclear cells in the implants containing mMSCs (B1-4) as compared to those with hMSCs (B5 and 6). Scale bar is 100 μm for B1 and 50 μm for B2 through B6; C: Quantification of β-gal+ myofibers in CTX-damaged tibialis anterior (TA) muscles of NOD/SCID mice following injection of LacZ-tagged MSCs. Each mouse received 5 × 10⁵ cells. Muscles were collected 30 d after stem cell injection and processed as described in[2]. Data points represent numbers of hybrid myofibers per TA. The average number of hybrid myofibers for hMSCs and mMSCs was 27 ± 18.3 and 45 ± 16.2, respectively. MSCs: Mesenchymal stem cells; hMSCs: Human mesenchymal stem cells; mMSCs: Mouse mesenchymal stem cells.
- Citation: Garza-Rodea ASL, Boersma H, Dambrot C, Vries AA, Bekkum DWV, Knaän-Shanzer S. Barriers in contribution of human mesenchymal stem cells to murine muscle regeneration. World J Exp Med 2015; 5(2): 140-153
- URL: https://www.wjgnet.com/2220-315X/full/v5/i2/140.htm
- DOI: https://dx.doi.org/10.5493/wjem.v5.i2.140


