Copyright
©The Author(s) 2015.
World J Exp Med. May 20, 2015; 5(2): 140-153
Published online May 20, 2015. doi: 10.5493/wjem.v5.i2.140
Published online May 20, 2015. doi: 10.5493/wjem.v5.i2.140
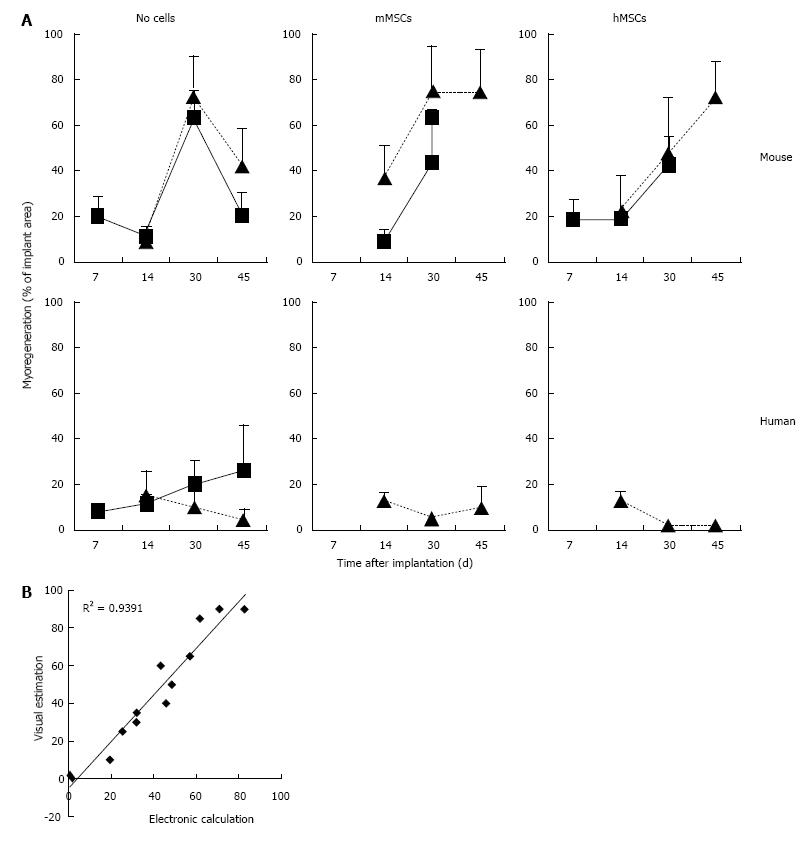
Figure 5 Myoregeneration kinetics of minced muscle implants without and with mesenchymal stem cells.
A: The data represent visual estimates derived from microscopic examination of 2 or 3 desmin-stained sections through the center of fresh (square frame and solid line) and cryopreserved (triangle and broken line) implants. Each point represents the mean with SD of between 2 and 10 (average 4) implants; B: Comparison between visual estimation and electronic calculation of areas of myoregeneration. Thirteen desmin-stained cross sections were analyzed by both visual estimation (plotted on the Y-axis) and with the Interactive Image Measurement program of CELL^F imaging software (plotted on the X-axis). The excellent correlation between the two methods of analysis justifies the choice of the less laborious visual estimation procedure.
- Citation: Garza-Rodea ASL, Boersma H, Dambrot C, Vries AA, Bekkum DWV, Knaän-Shanzer S. Barriers in contribution of human mesenchymal stem cells to murine muscle regeneration. World J Exp Med 2015; 5(2): 140-153
- URL: https://www.wjgnet.com/2220-315X/full/v5/i2/140.htm
- DOI: https://dx.doi.org/10.5493/wjem.v5.i2.140


