Copyright
©The Author(s) 2025.
World J Exp Med. Sep 20, 2025; 15(3): 104799
Published online Sep 20, 2025. doi: 10.5493/wjem.v15.i3.104799
Published online Sep 20, 2025. doi: 10.5493/wjem.v15.i3.104799
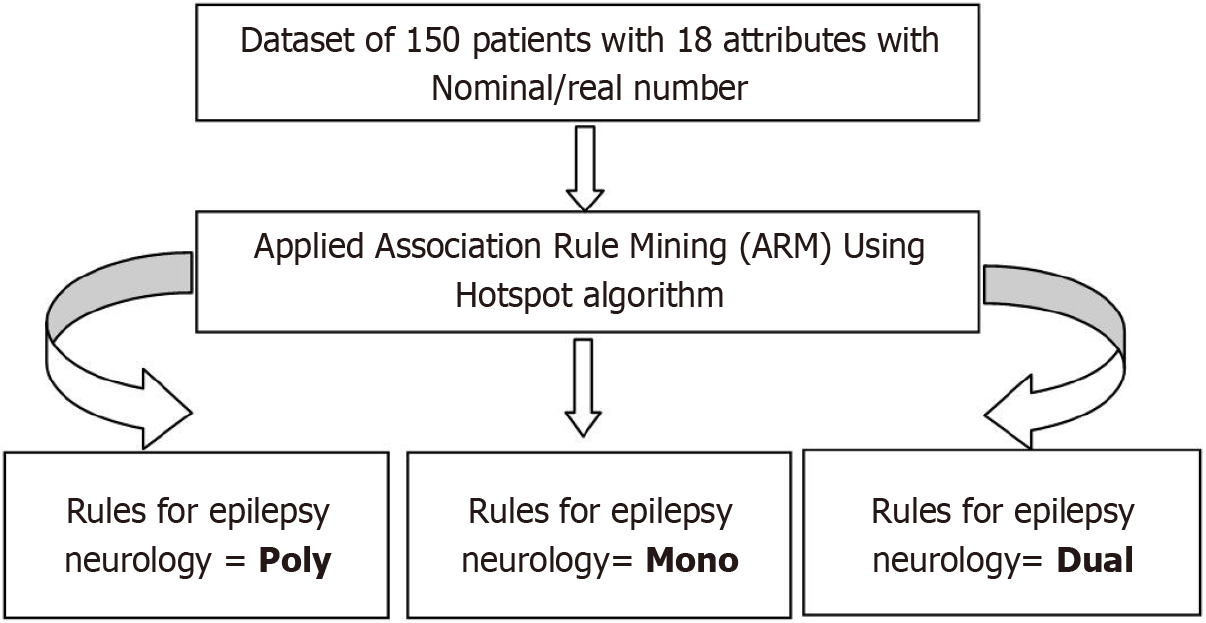
Figure 1 Epilepsy Neurology data extraction and management.
Poly: Polytherapy; Mono: Monotherapy; Dual: Dual therapy.
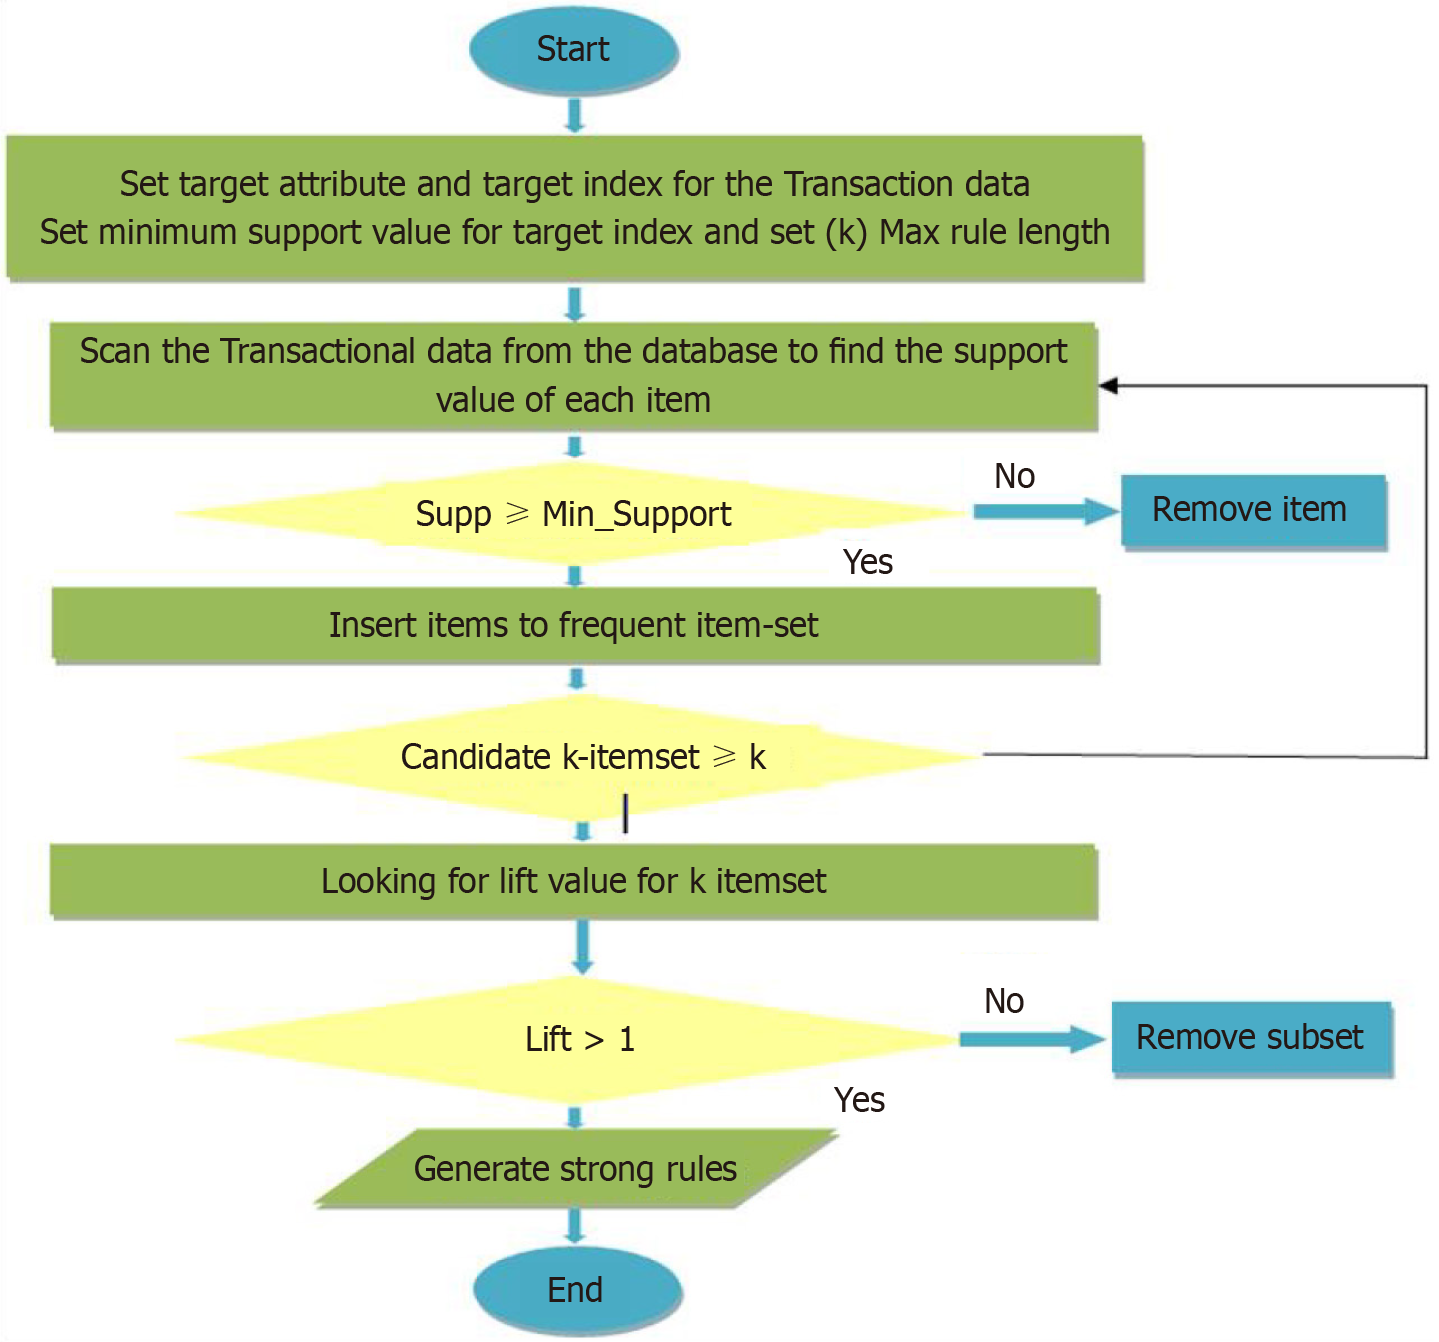
Figure 2 Shows the working steps of the Hotspot algorithm for class value-based market basket analysis.
Min: Minimum.
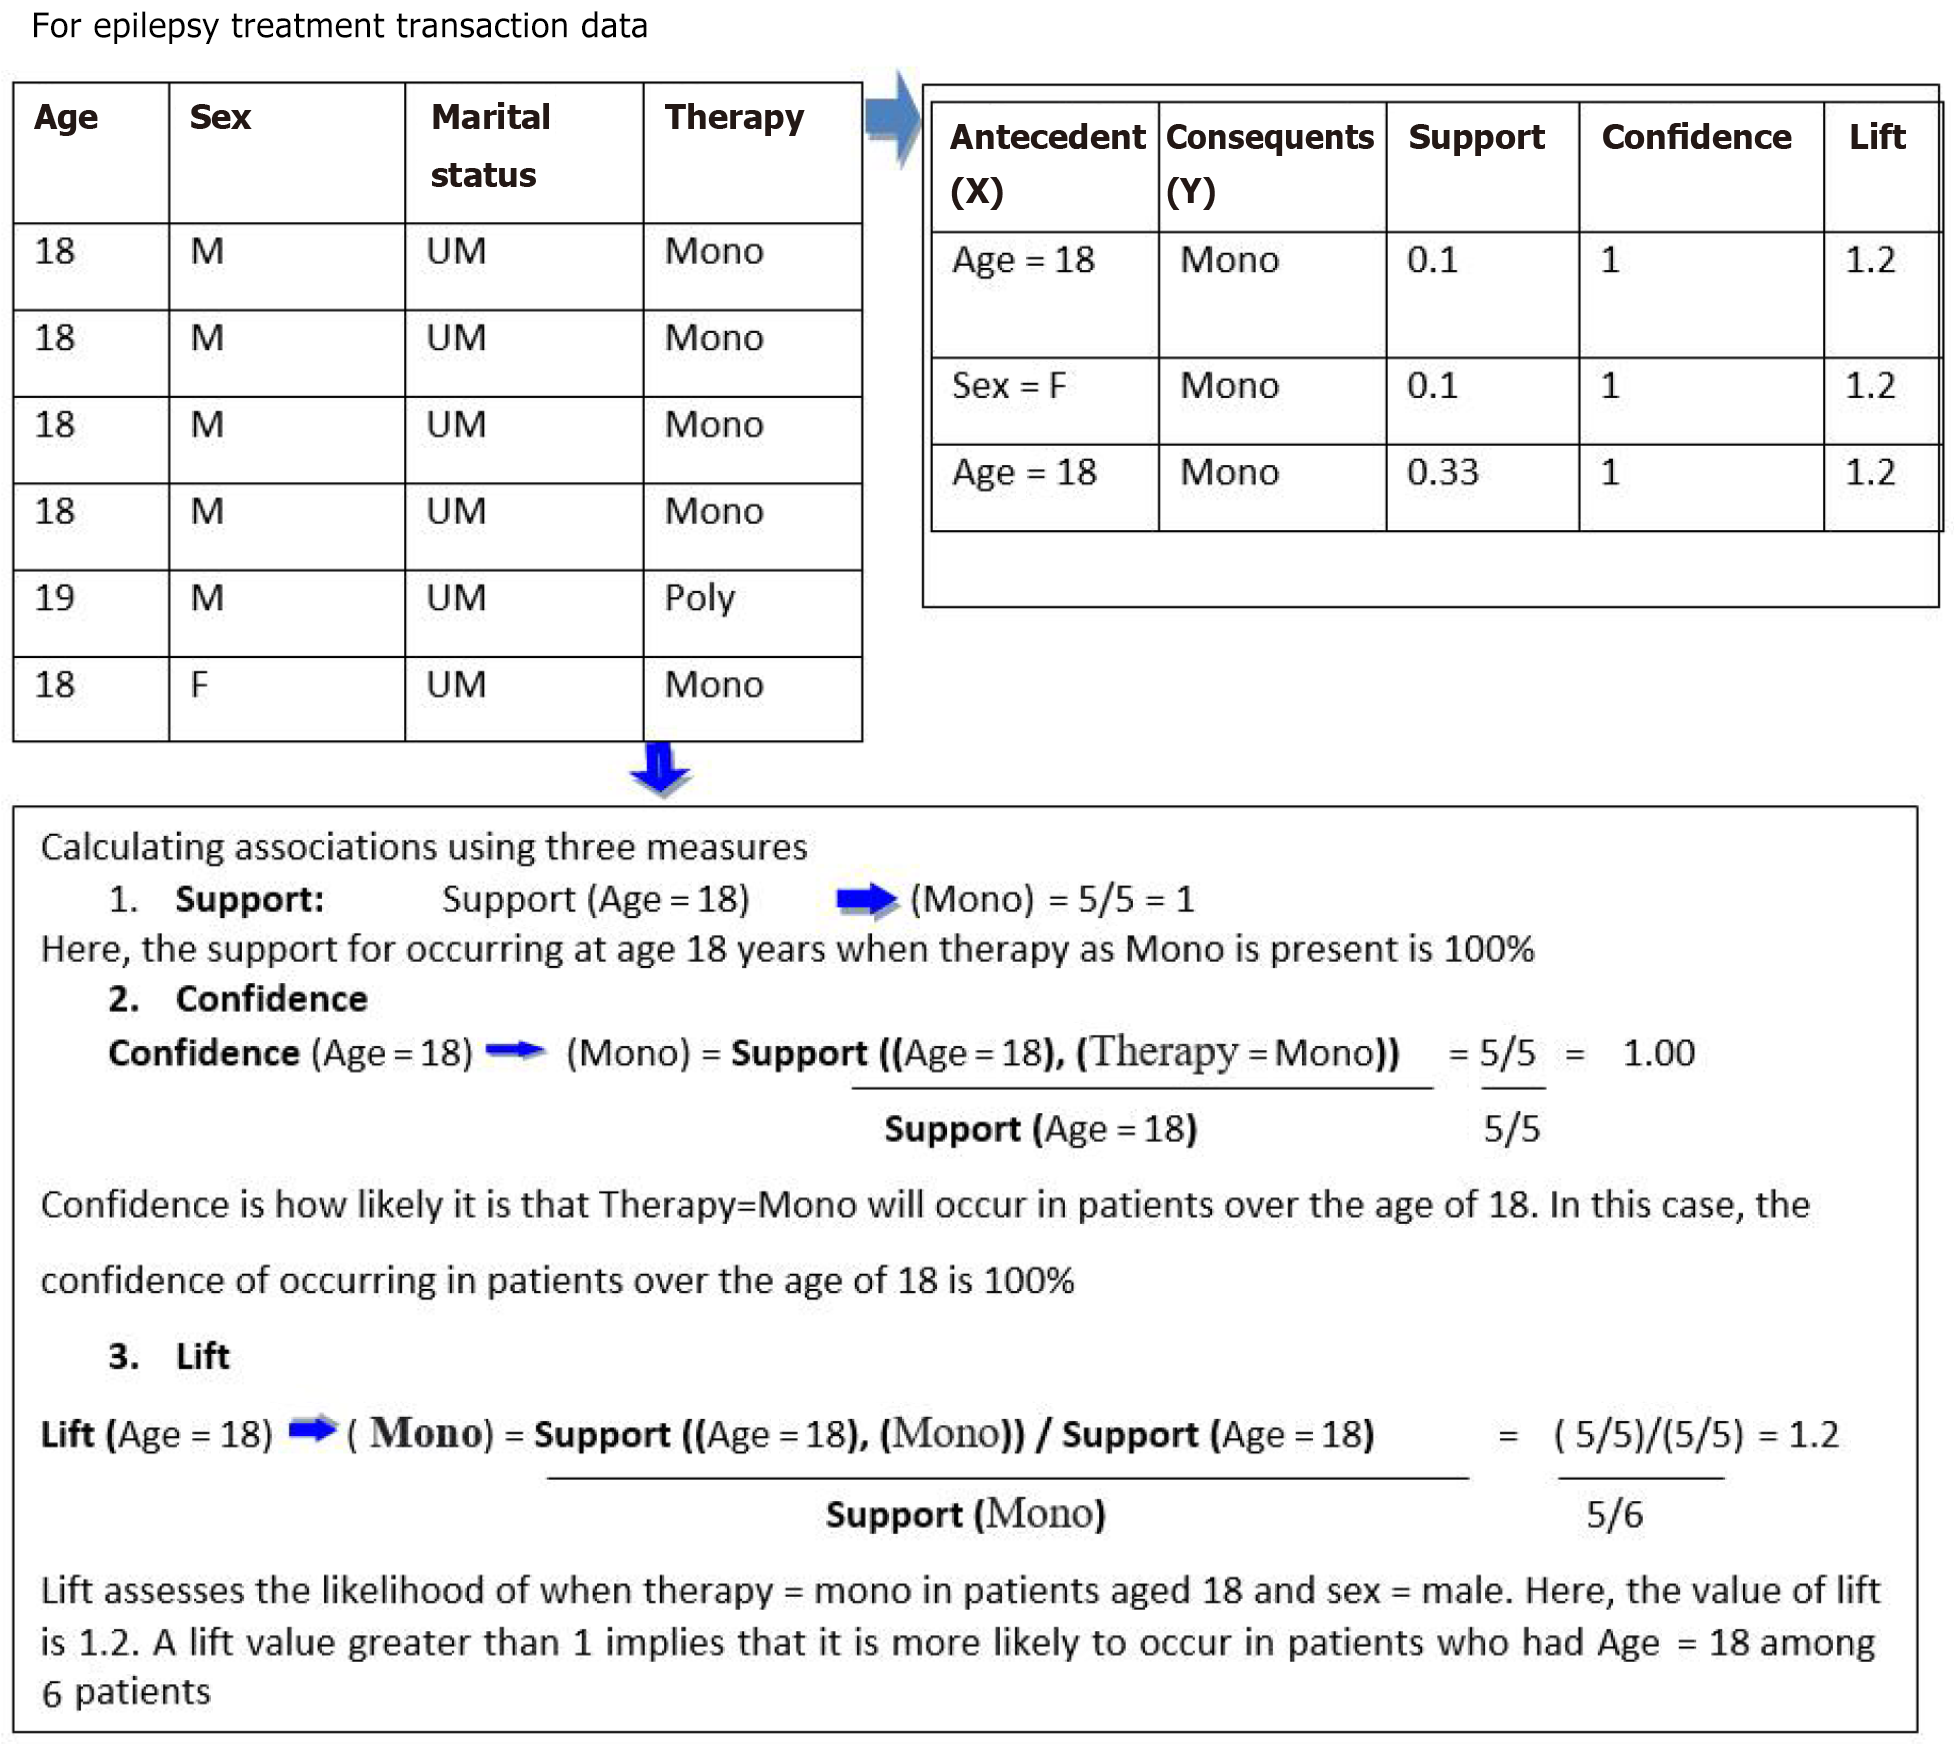
Figure 3 Association rule mining example calculating support, confidence and lift with transactional data.
M: Male; F: Famale; Mono: Monotherapy; UM: Unmarried.
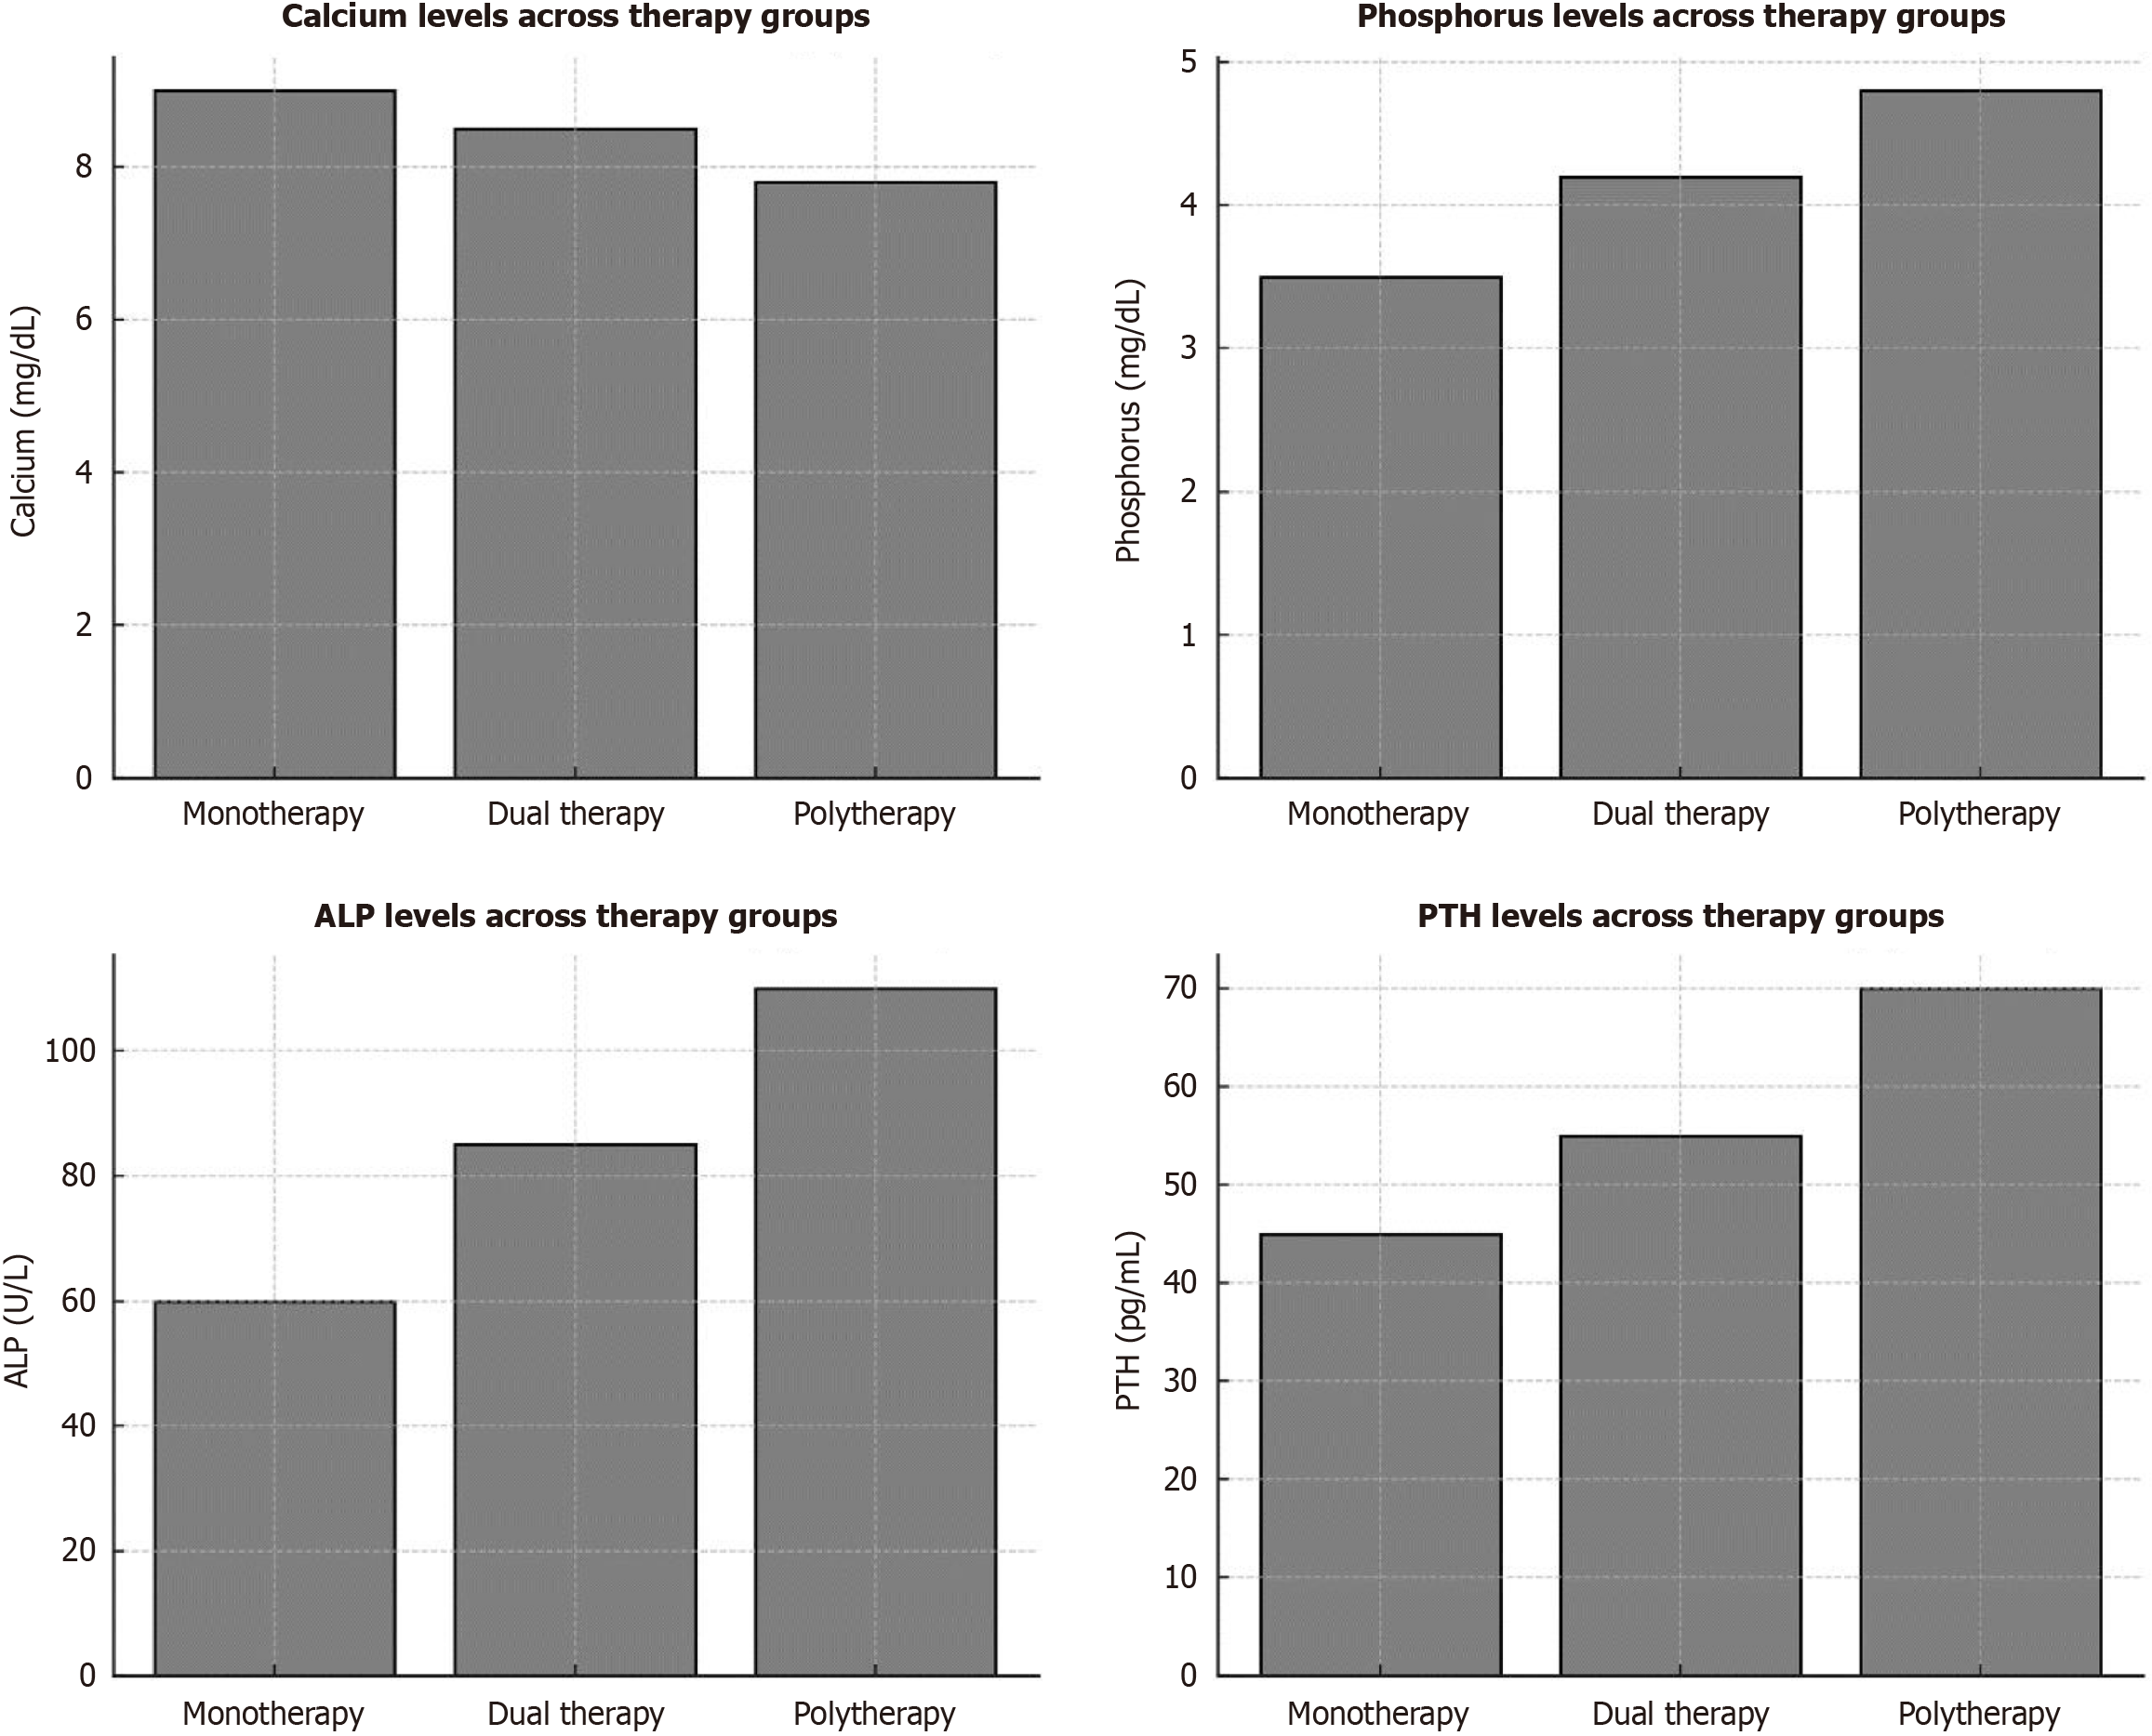
Figure 4 Comparison of calcium, phosphorus, alkaline phosphatase, and parathyroid hormone levels across anti-epileptic drug therapy groups.
ALP: Alkaline phosphatase; PTH: Parathyroid hormone.
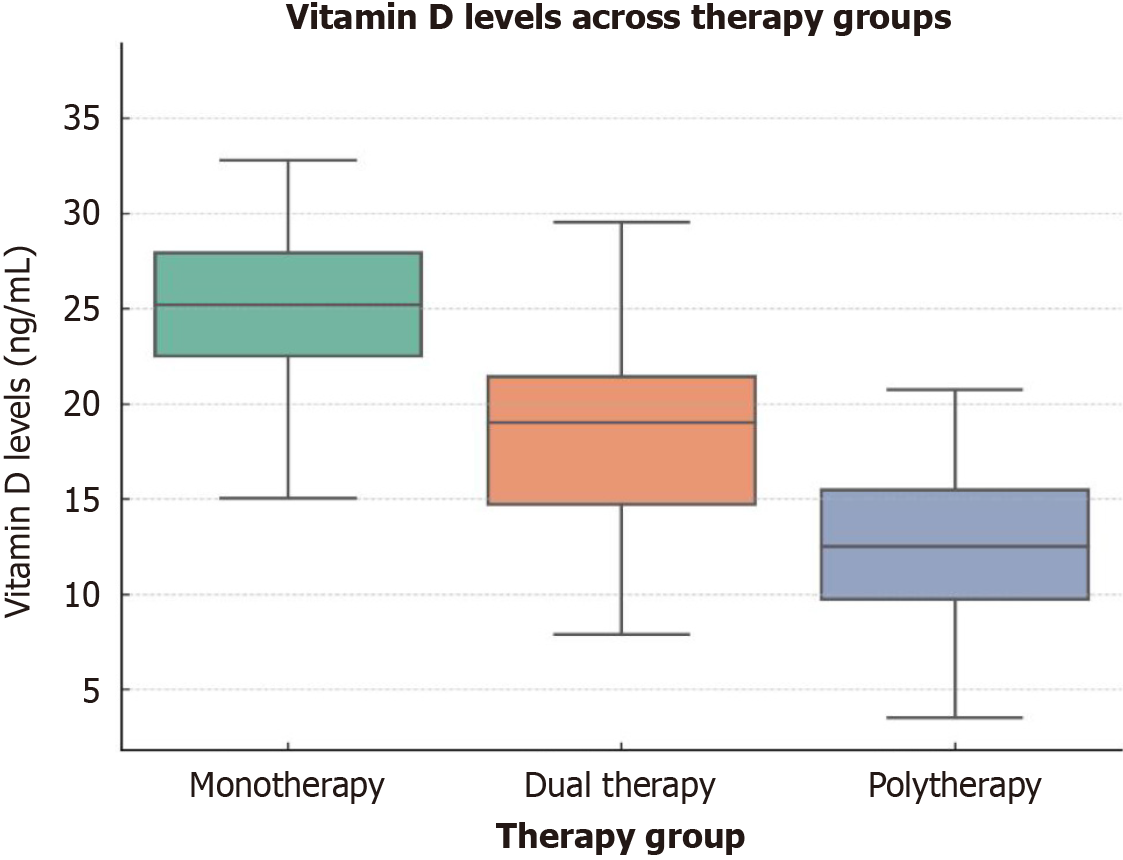
Figure 5 Vitamin D levels in relation to therapy groups.
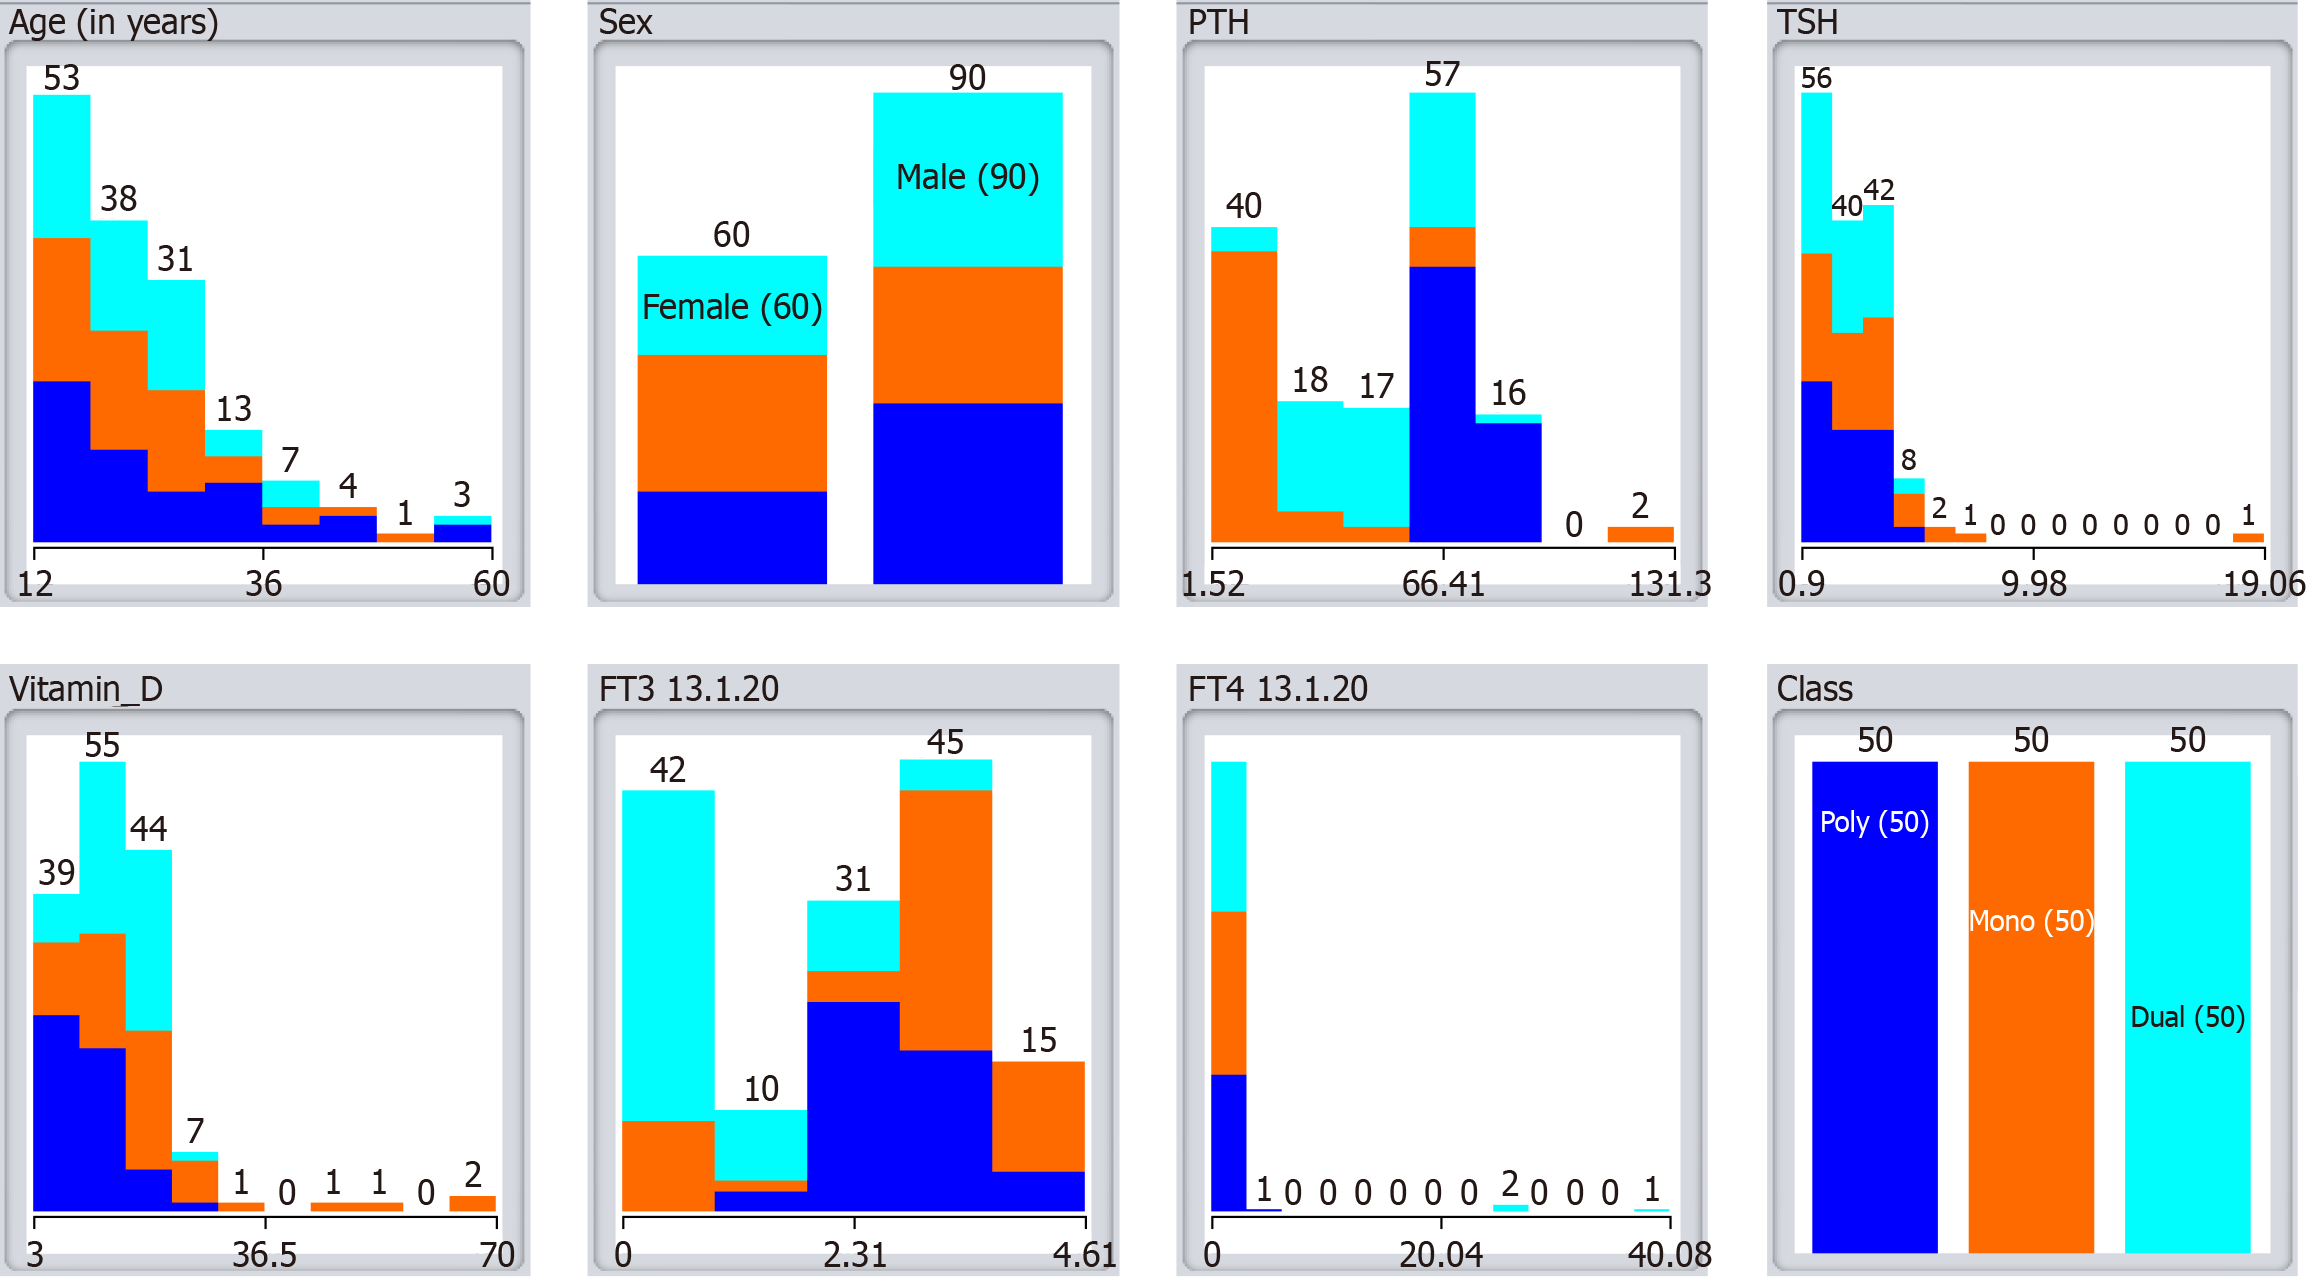
Figure 6 Epilepsy neurology with class value.
Blue color for poly-therapy, gray for mono-therapy and cyan for dual-therapy. FT3: Free T3; FT4: Free T4; PTH: Parathyroid hormone; TSH: Thyroid stimulating hormone; Poly: Polytherapy; Mono: Monotherapy; Dual: Dual therapy.
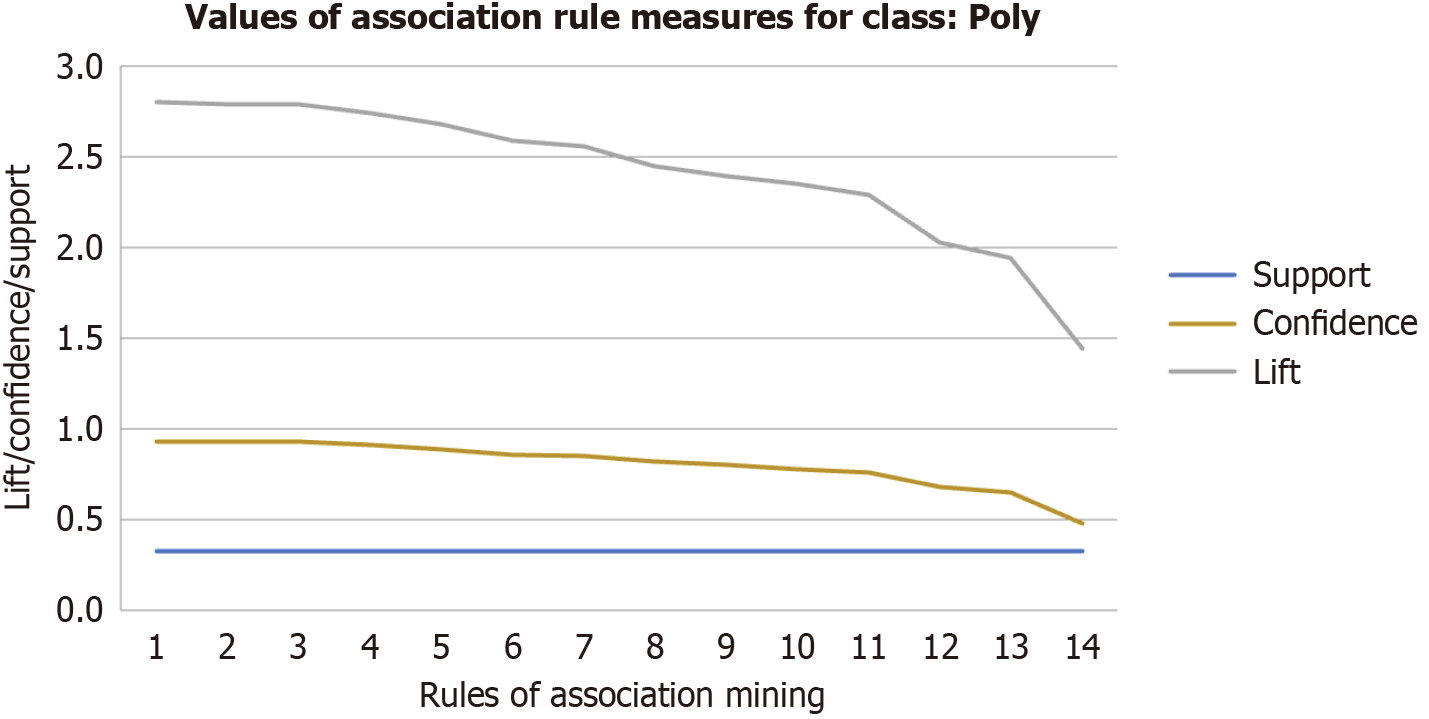
Figure 7 Shows values of association rule measures for class.
Poly: Polytherapy.
- Citation: Dabla PK, Upreti K, Singh D, Singh A, Puri V, Stanciu AE, Serdarevic N, Gruson D. Anti-epileptic medication induced disturbed calcium-vitamin D metabolism: A behavioral analysis using association rule mining technique. World J Exp Med 2025; 15(3): 104799
- URL: https://www.wjgnet.com/2220-315X/full/v15/i3/104799.htm
- DOI: https://dx.doi.org/10.5493/wjem.v15.i3.104799


