Copyright
©The Author(s) 2025.
World J Exp Med. Sep 20, 2025; 15(3): 103154
Published online Sep 20, 2025. doi: 10.5493/wjem.v15.i3.103154
Published online Sep 20, 2025. doi: 10.5493/wjem.v15.i3.103154
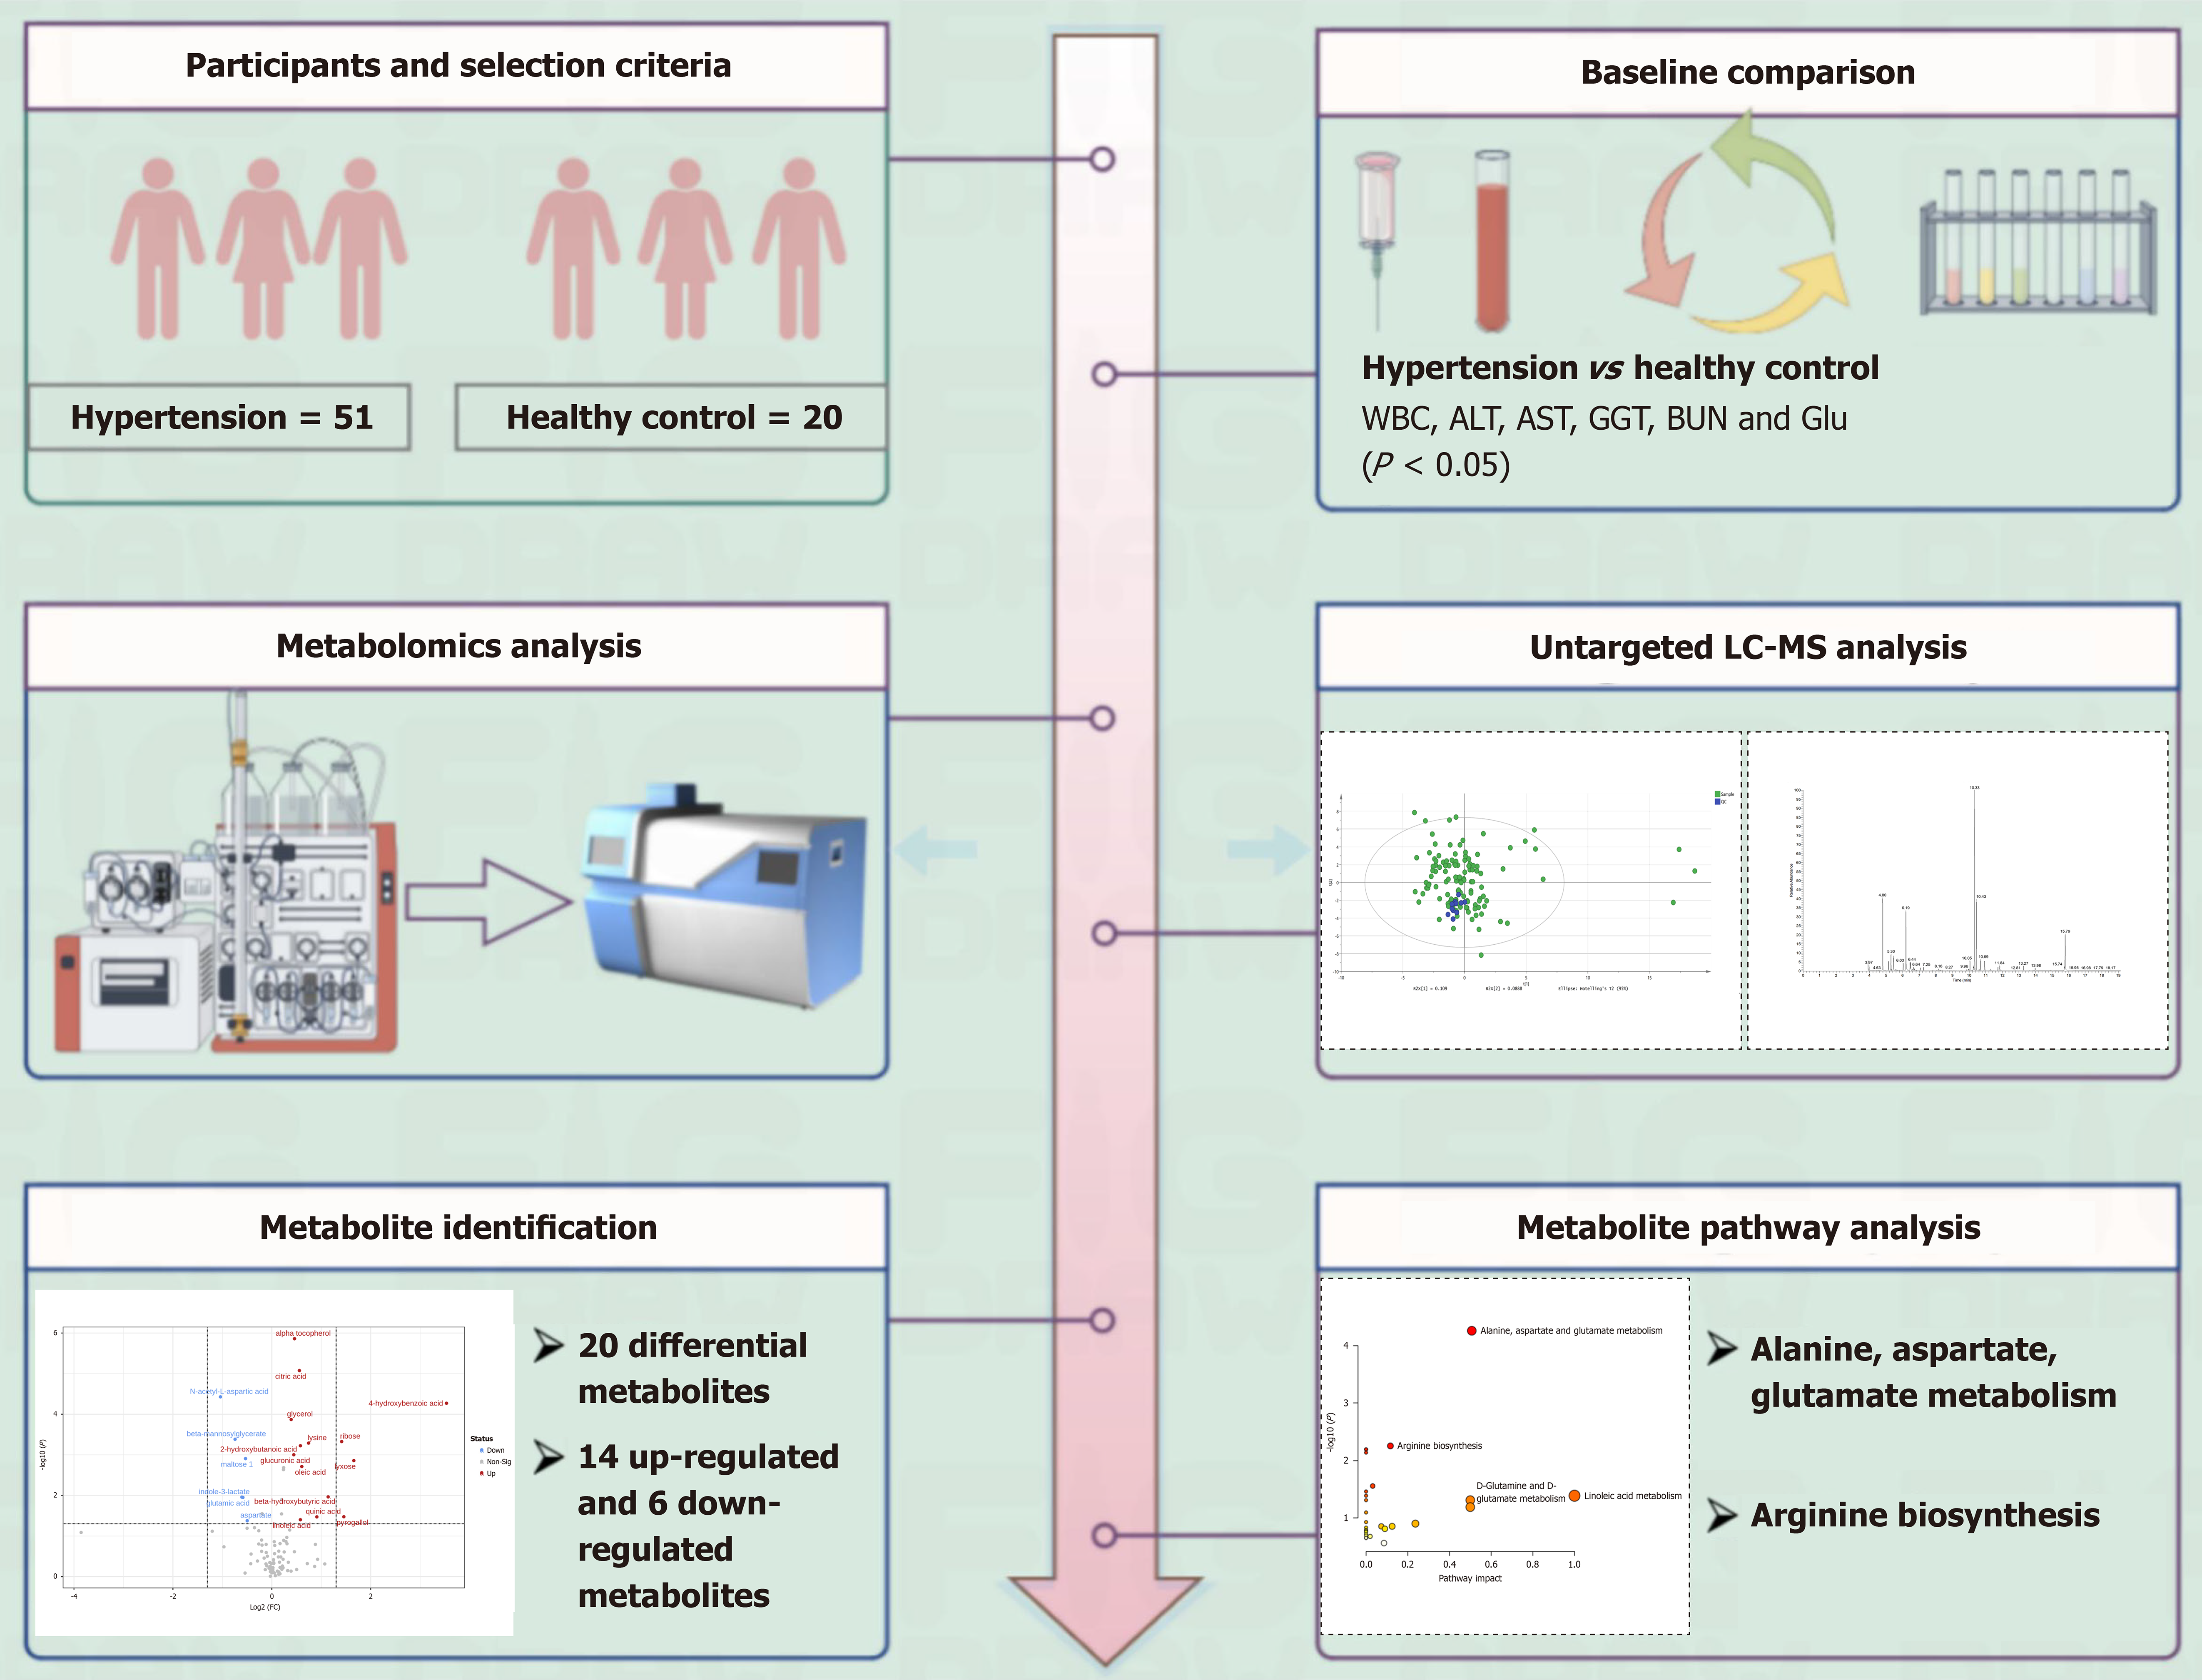
Figure 1 Graphical abstract.
ALT: Alanine transaminase; AST: Aspartate transaminase; GGT: Gamma-glutamyl transferase; BUN: Blood urea nitrogen; Glu: Glucose; WBC: White blood cells; LC-MS: Liquid chromatography-mass spectrometry.
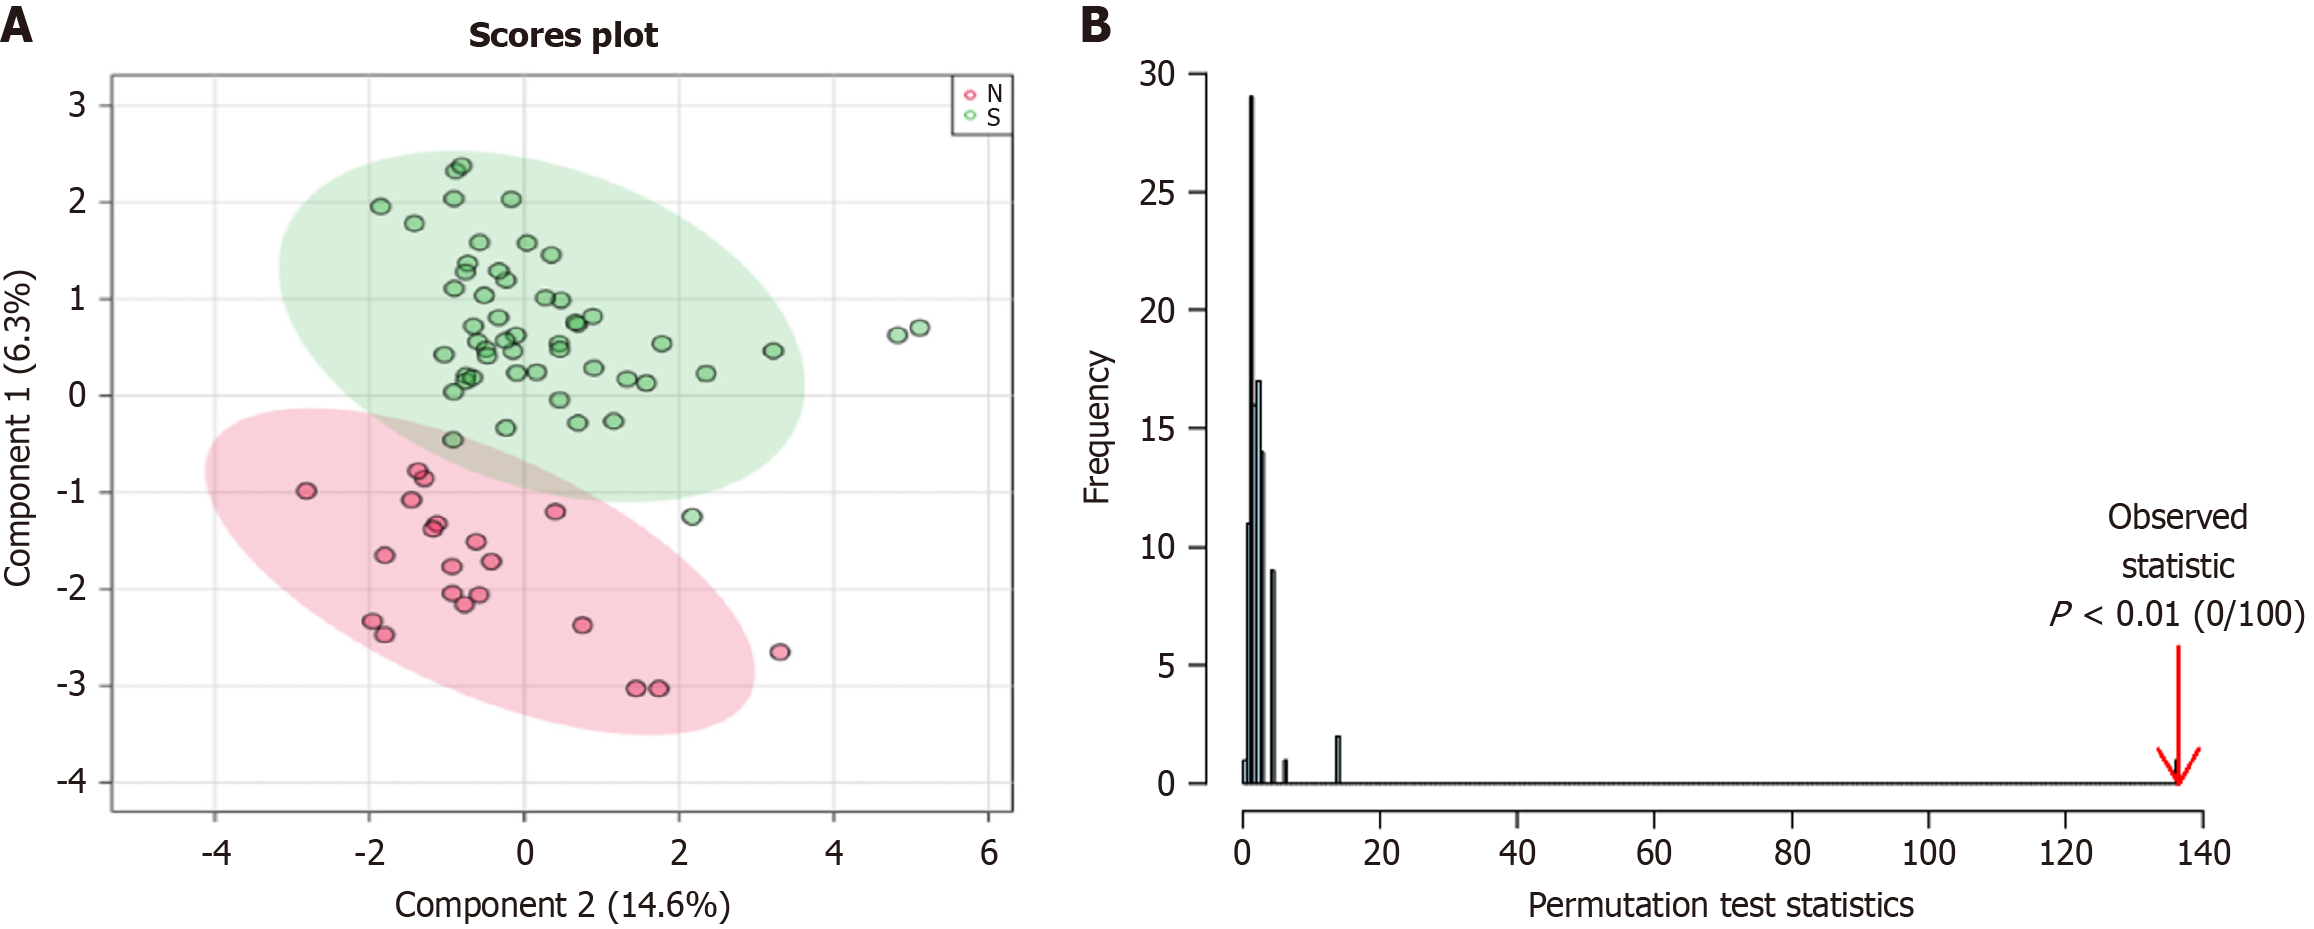
Figure 2 Serum metabolic patterns changed in hypertensive patients compared to healthy subjects.
A: Partial least squares discriminant analysis; B: Model validation.
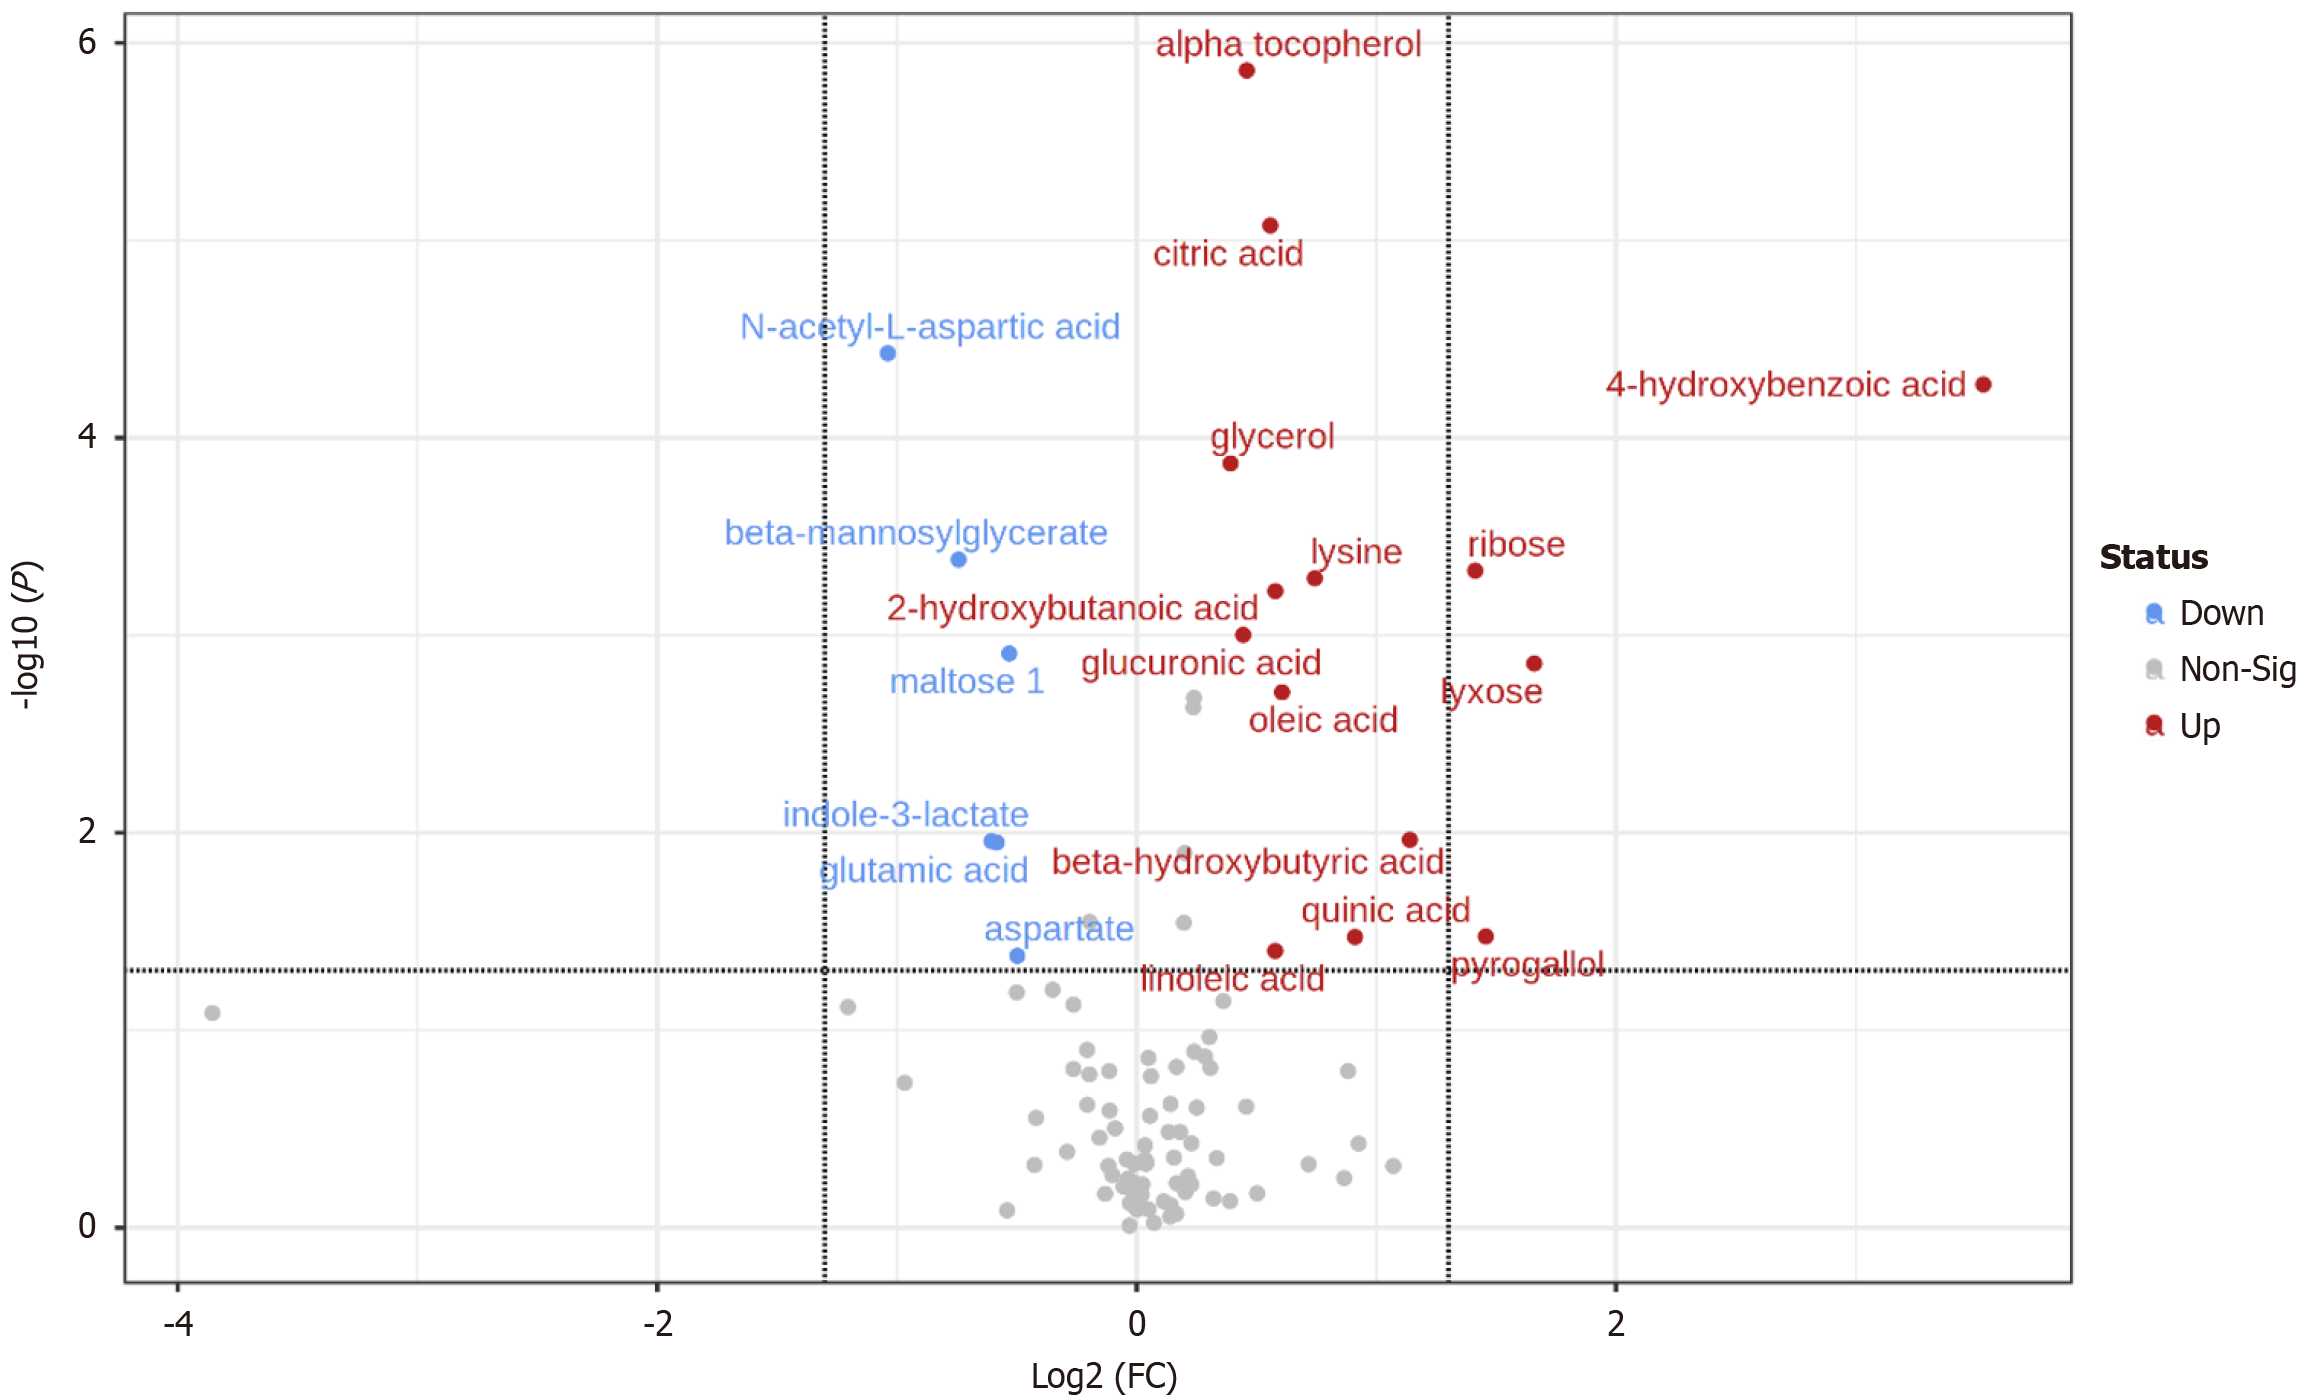
Figure 3 Volcano map of differential metabolites.
FC: Fold change.
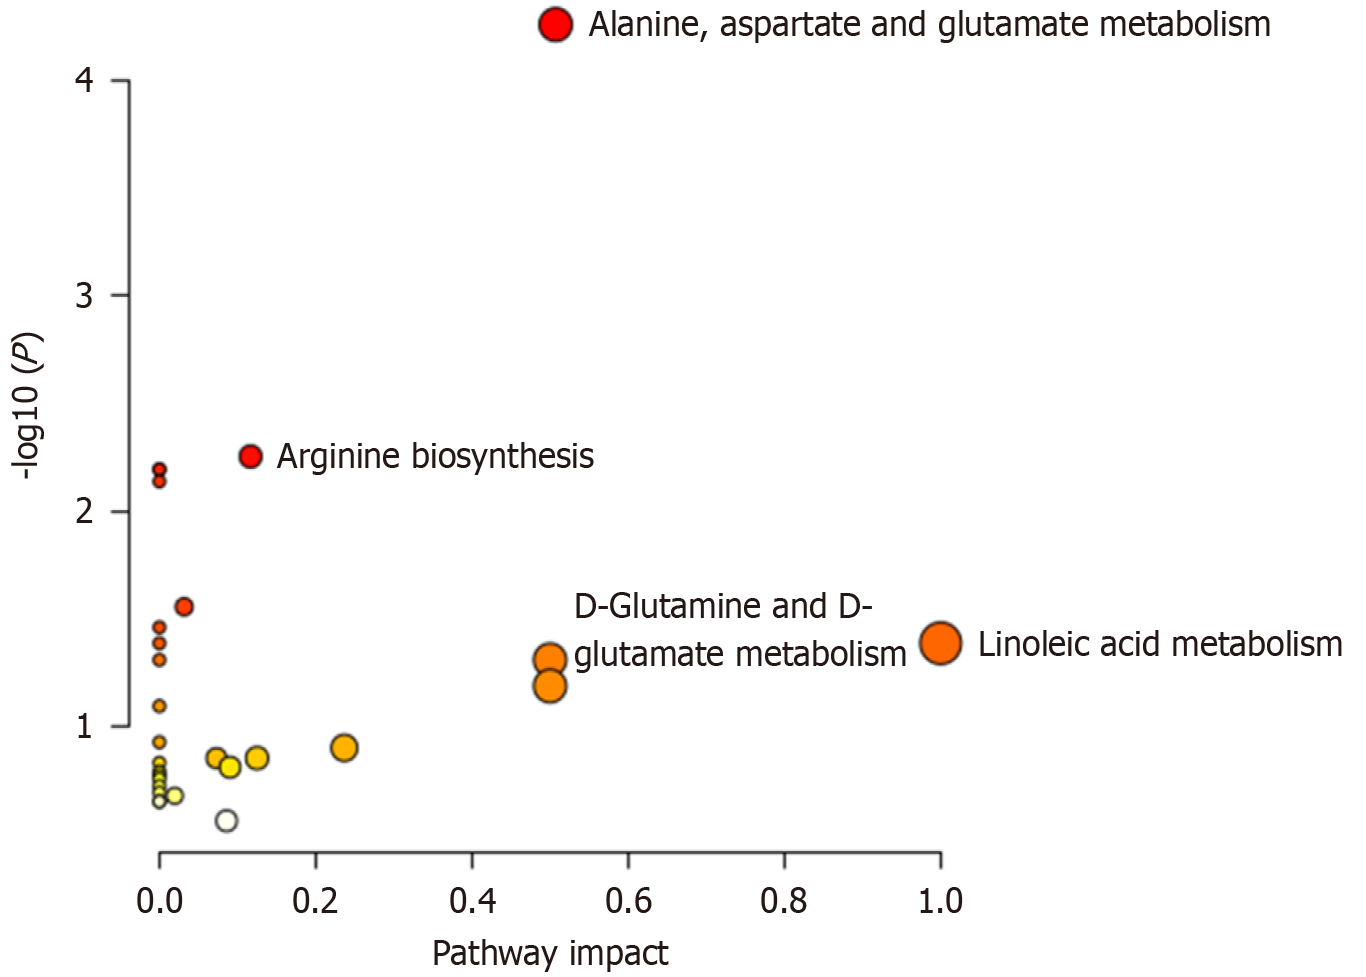
Figure 4 Metabolic pathways of 20 differential metabolites.
- Citation: Jialiken D, Dai J, Fan YD, Zhang HT, Shan JJ, Xu WC, Zou C. Gas chromatography-mass spectrometry-based plasma metabolomics analysis in hypertensive patients with Yin deficiency and Yang hyperactivity syndrome. World J Exp Med 2025; 15(3): 103154
- URL: https://www.wjgnet.com/2220-315X/full/v15/i3/103154.htm
- DOI: https://dx.doi.org/10.5493/wjem.v15.i3.103154


