Copyright
©The Author(s) 2016.
World J Crit Care Med. Aug 4, 2016; 5(3): 180-186
Published online Aug 4, 2016. doi: 10.5492/wjccm.v5.i3.180
Published online Aug 4, 2016. doi: 10.5492/wjccm.v5.i3.180
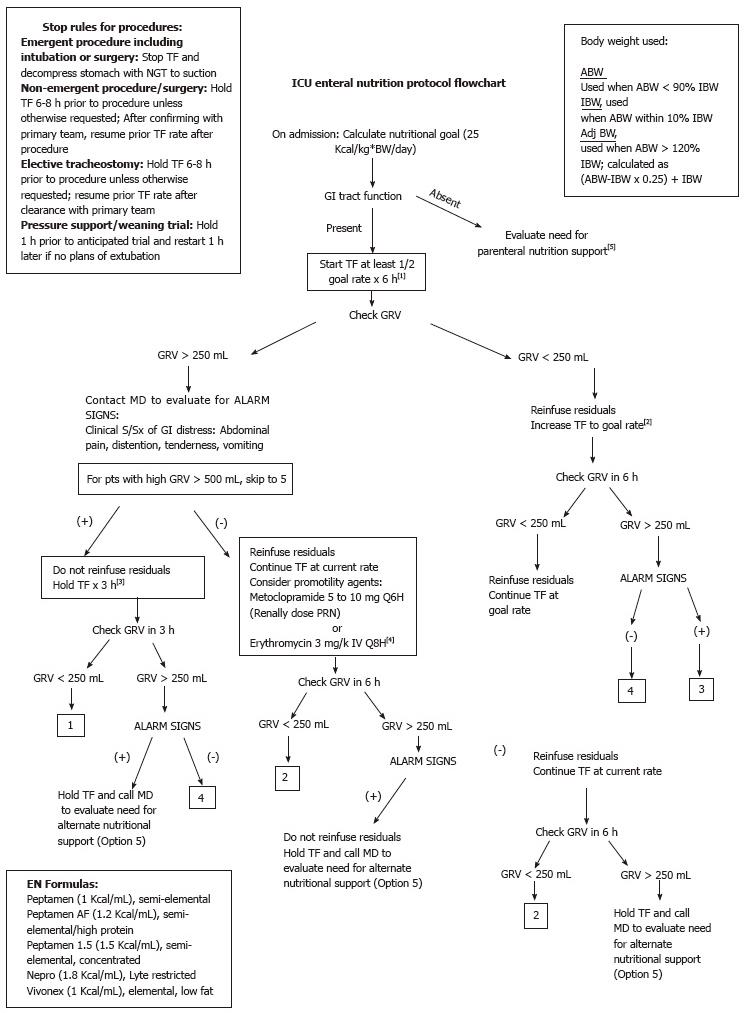
Figure 1 Intensive care unit enteral nutrition protocol flowchart.
TF: Tube feeds; NGT: Nasogastric tube; GI: Gastrointestinal; PN: Parenteral nutrition; S/Sx: Symptoms and signs; pts: Patients; GRV: Gastric residual volume; ABW: Actual body weight; IBW: Ideal body weight; Adj BW: Adjusted body weight.
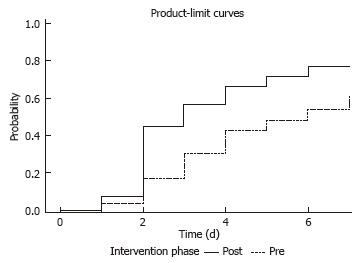
Figure 2 Days to achieve goal rate by intervention phase.
The Kaplan-Meier method was used to calculate the time to achieve goal rate over the seven-day period. The log-rank test was used to compare the time to both of those events between the pre- and post-intervention phases.
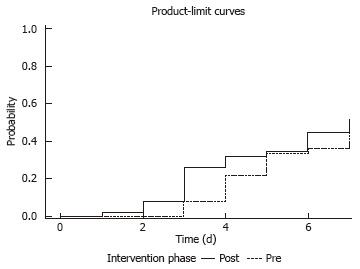
Figure 3 Days to achieve total recommended volume by intervention phase.
The Kaplan-Meier method was used to calculate the time to achieve total recommended daily volume over the seven-day period. The log-rank test was used to compare the time to both of those events between the pre- and post-intervention phases.
- Citation: Wilson S, Madisi NY, Bassily-Marcus A, Manasia A, Oropello J, Kohli-Seth R. Enteral nutrition administration in a surgical intensive care unit: Achieving goals with better strategies. World J Crit Care Med 2016; 5(3): 180-186
- URL: https://www.wjgnet.com/2220-3141/full/v5/i3/180.htm
- DOI: https://dx.doi.org/10.5492/wjccm.v5.i3.180


