
















Copyright: ©Author(s) 2026.
World J Crit Care Med. Sep 9, 2026; 15(3): 115627
Published online Sep 9, 2026. doi: 10.5492/wjccm.115627
Published online Sep 9, 2026. doi: 10.5492/wjccm.115627
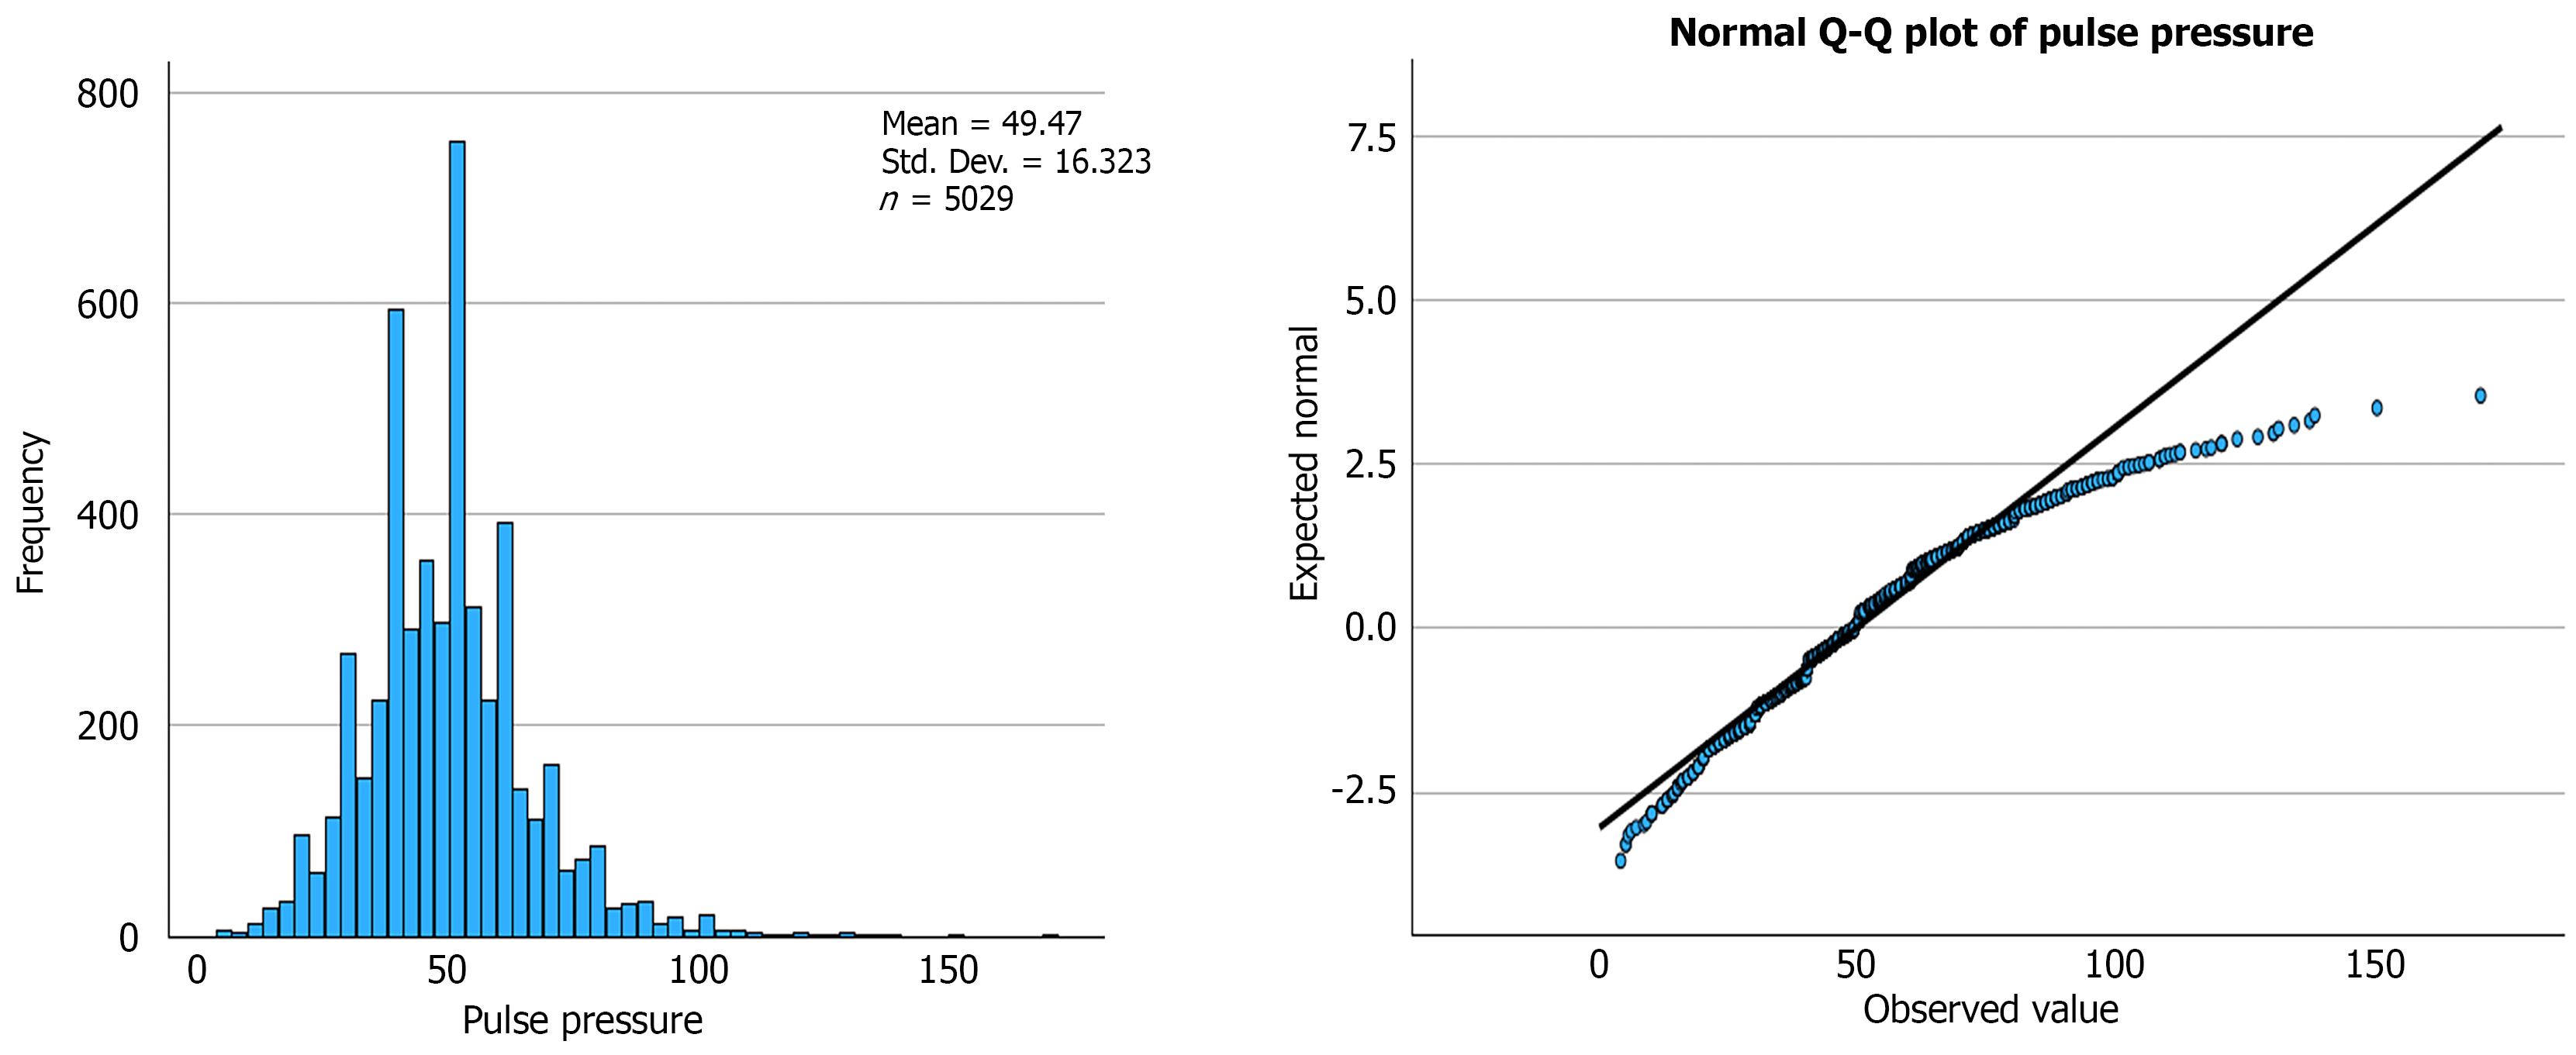
Figure 1 Normality test for pulse pressure using a histogram and normal Q-Q plot.
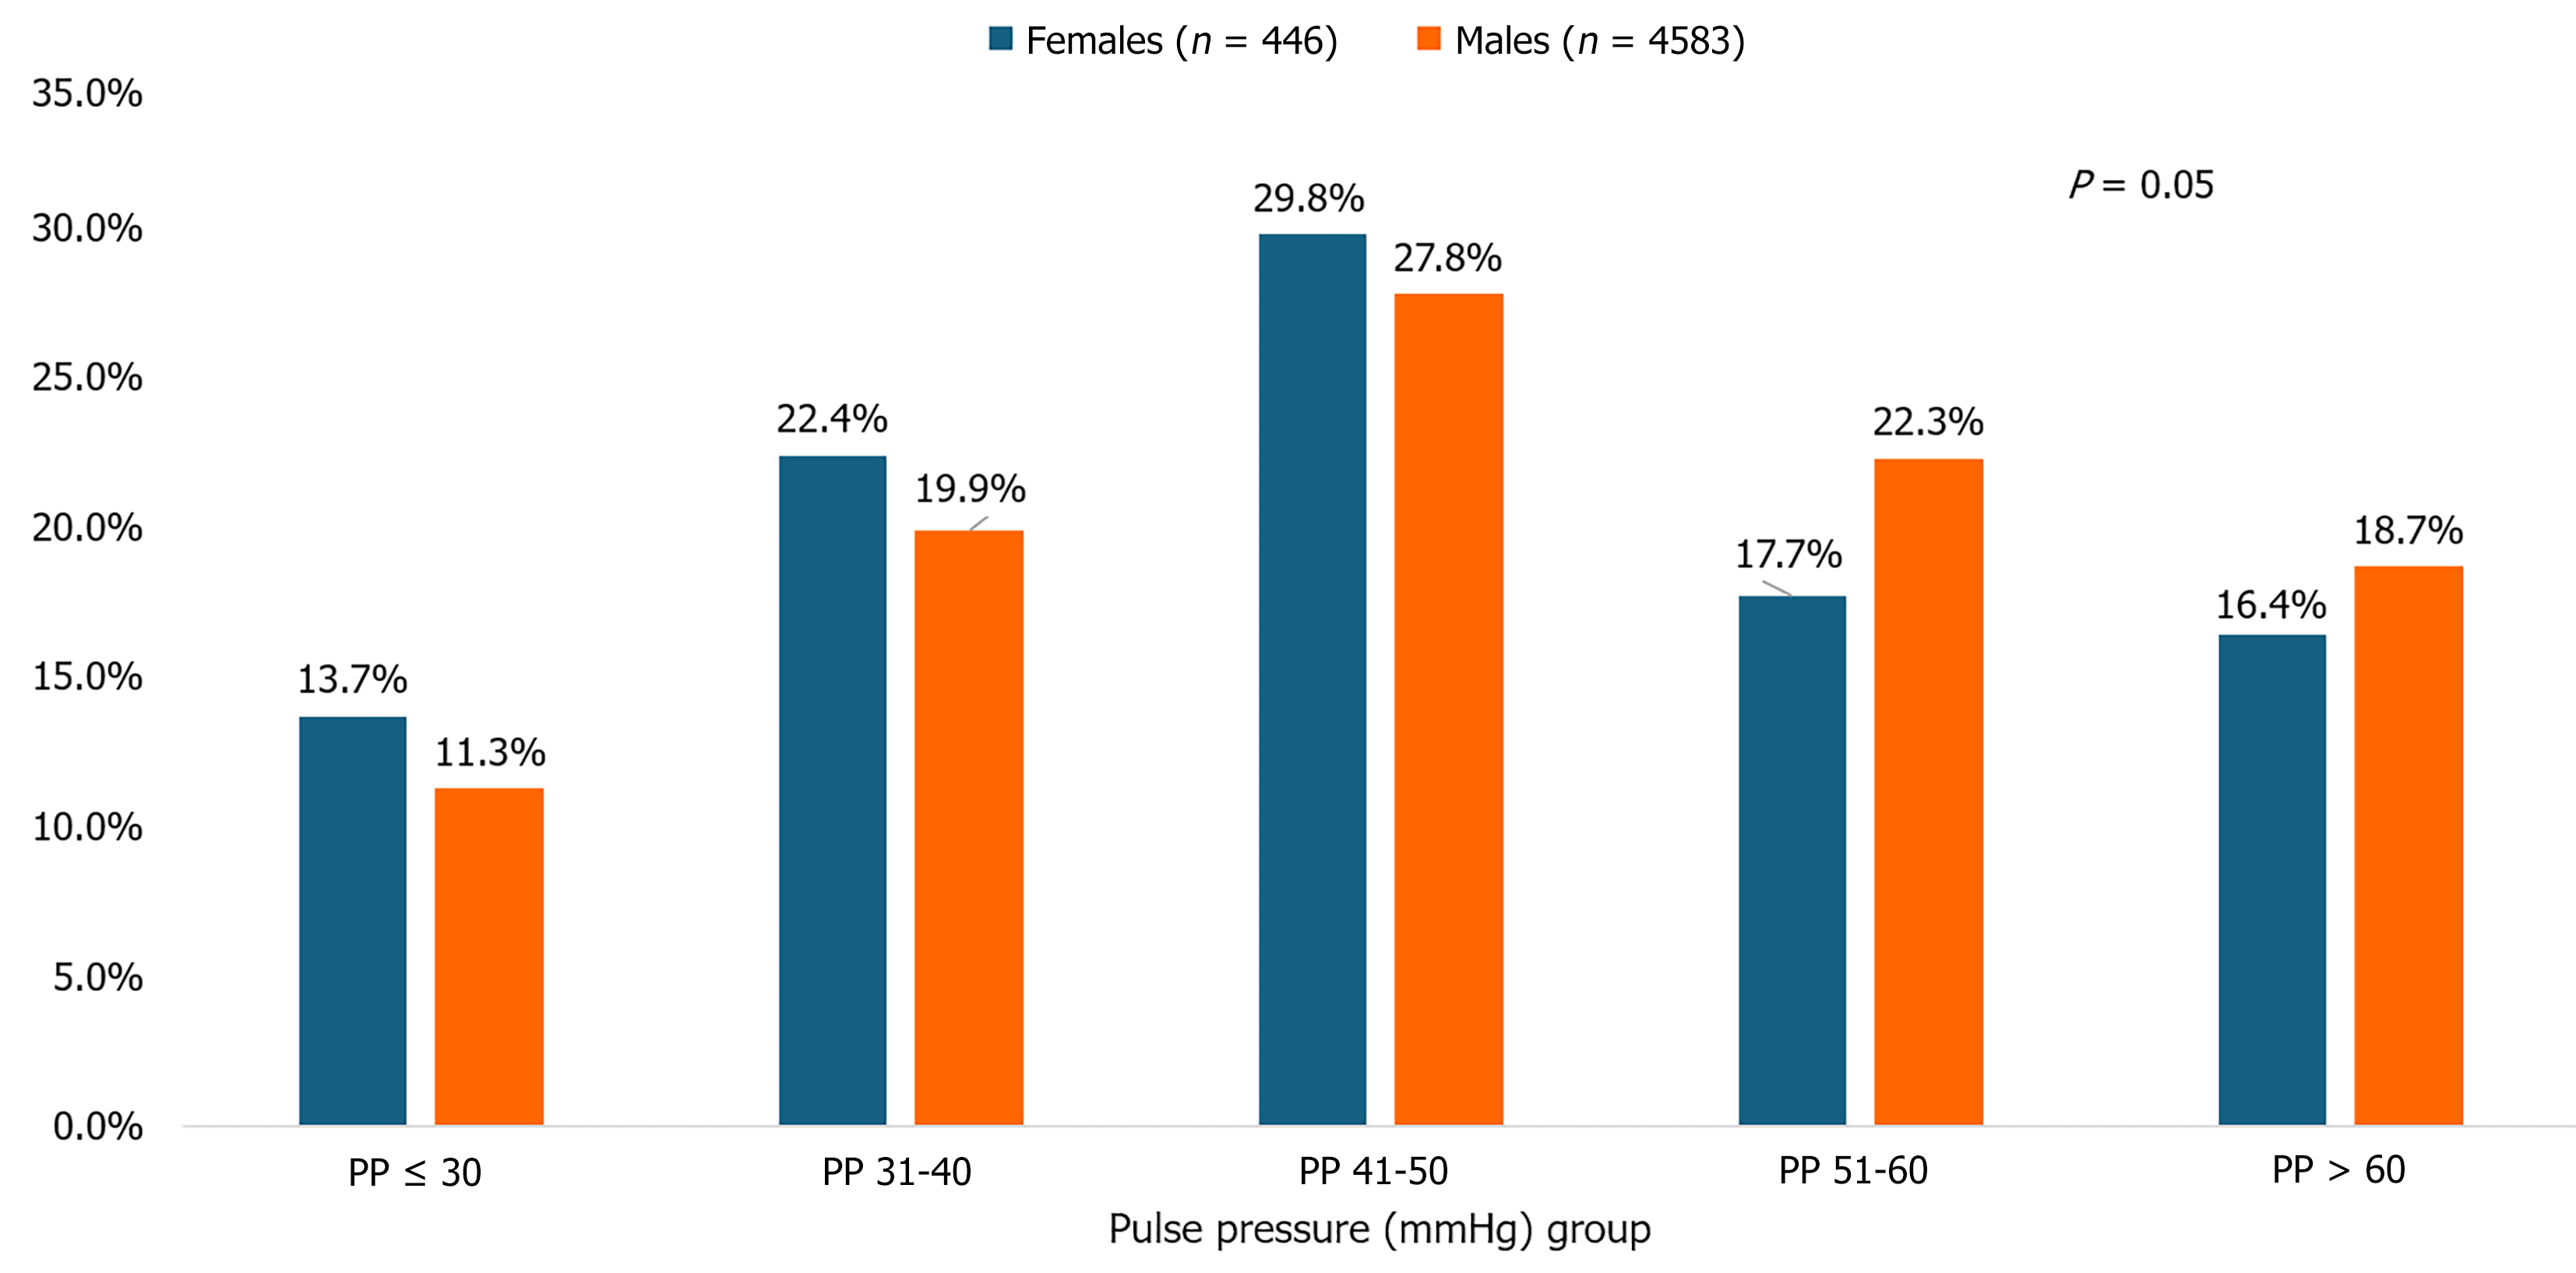
Figure 2 Distribution of pulse pressure categories stratified by sex.
PP: Pulse pressure.
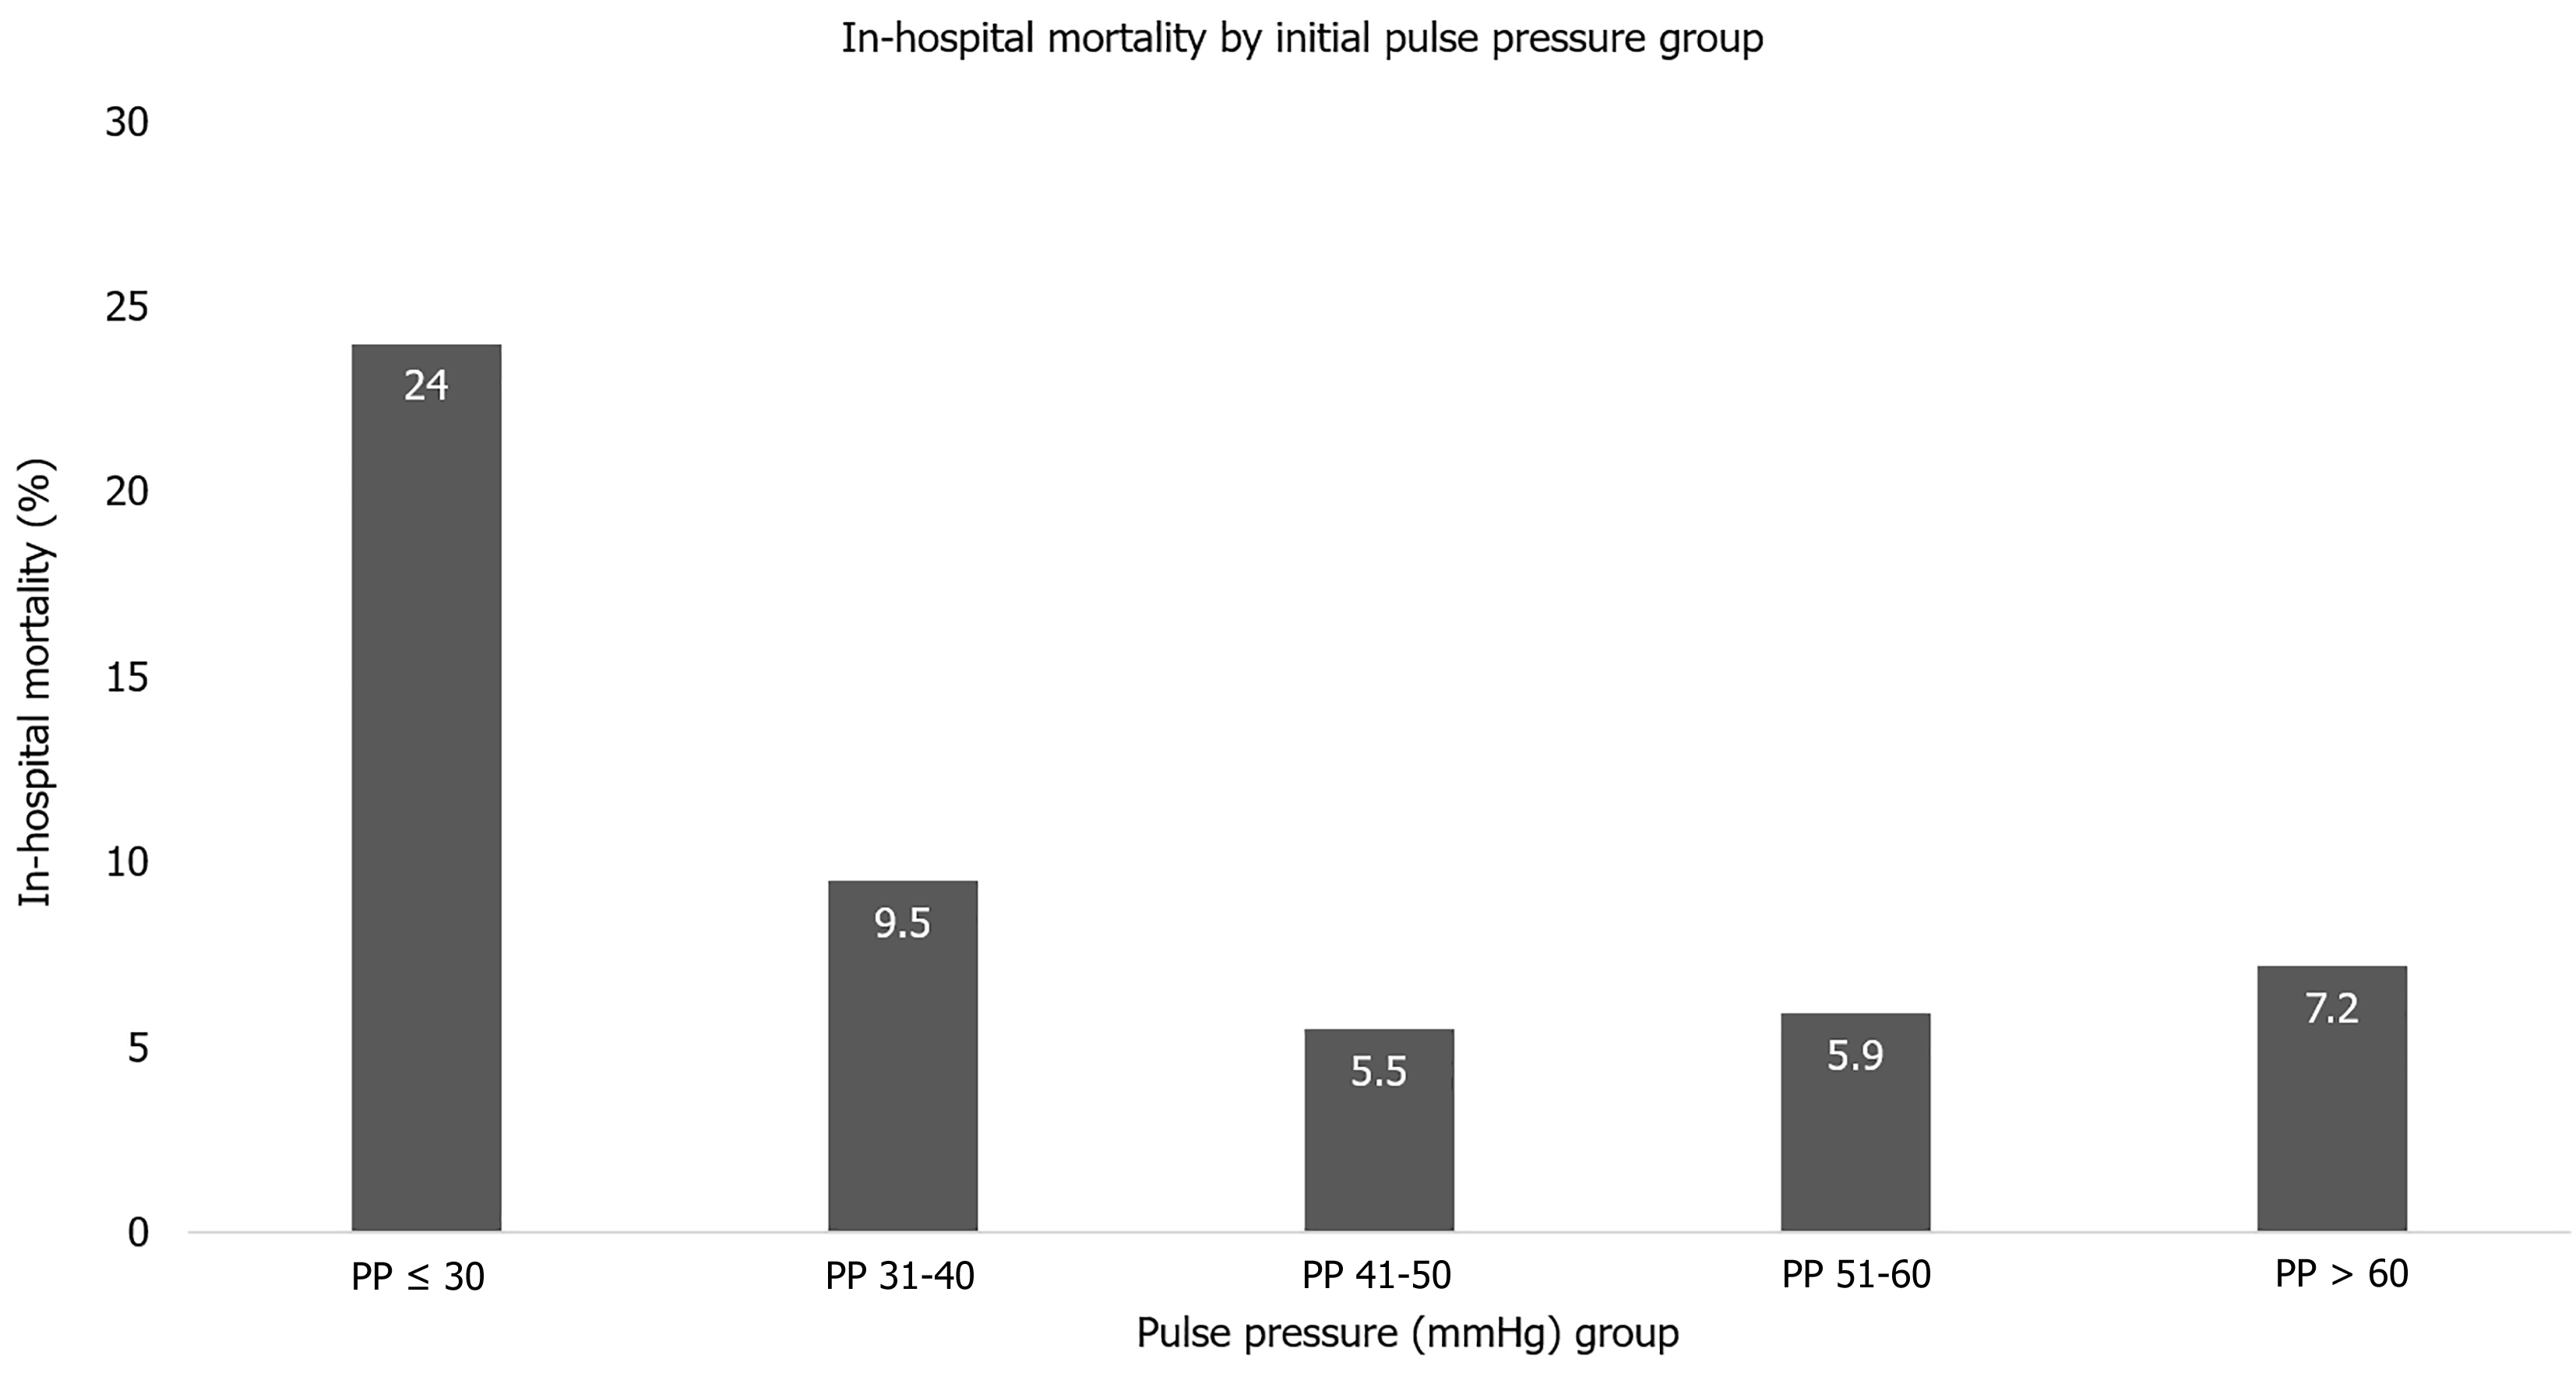
Figure 3 In-hospital mortality across the five pulse pressure (PP) groups.
Mortality was highest in the lowest PP group (≤ 30 mmHg) and lowest in the moderate PP range (41-60 mmHg). PP: Pulse pressure.
- Citation: Ahmed K, El-Menyar A, Asim M, Al Jogol H, Taha I, Kanbar A, Younis B, Rizoli S, Al-Thani H. Prognostic utility of on-admission pulse pressure in hospitalized patients with traumatic brain injury. World J Crit Care Med 2026; 15(3): 115627
- URL: https://www.wjgnet.com/2220-3141/full/v15/i3/115627.htm
- DOI: https://dx.doi.org/10.5492/wjccm.115627