
















Copyright: ©Author(s) 2026.
World J Clin Urol. Sep 16, 2026; 15(2): 123397
Published online Sep 16, 2026. doi: 10.5410/wjcu.123397
Published online Sep 16, 2026. doi: 10.5410/wjcu.123397
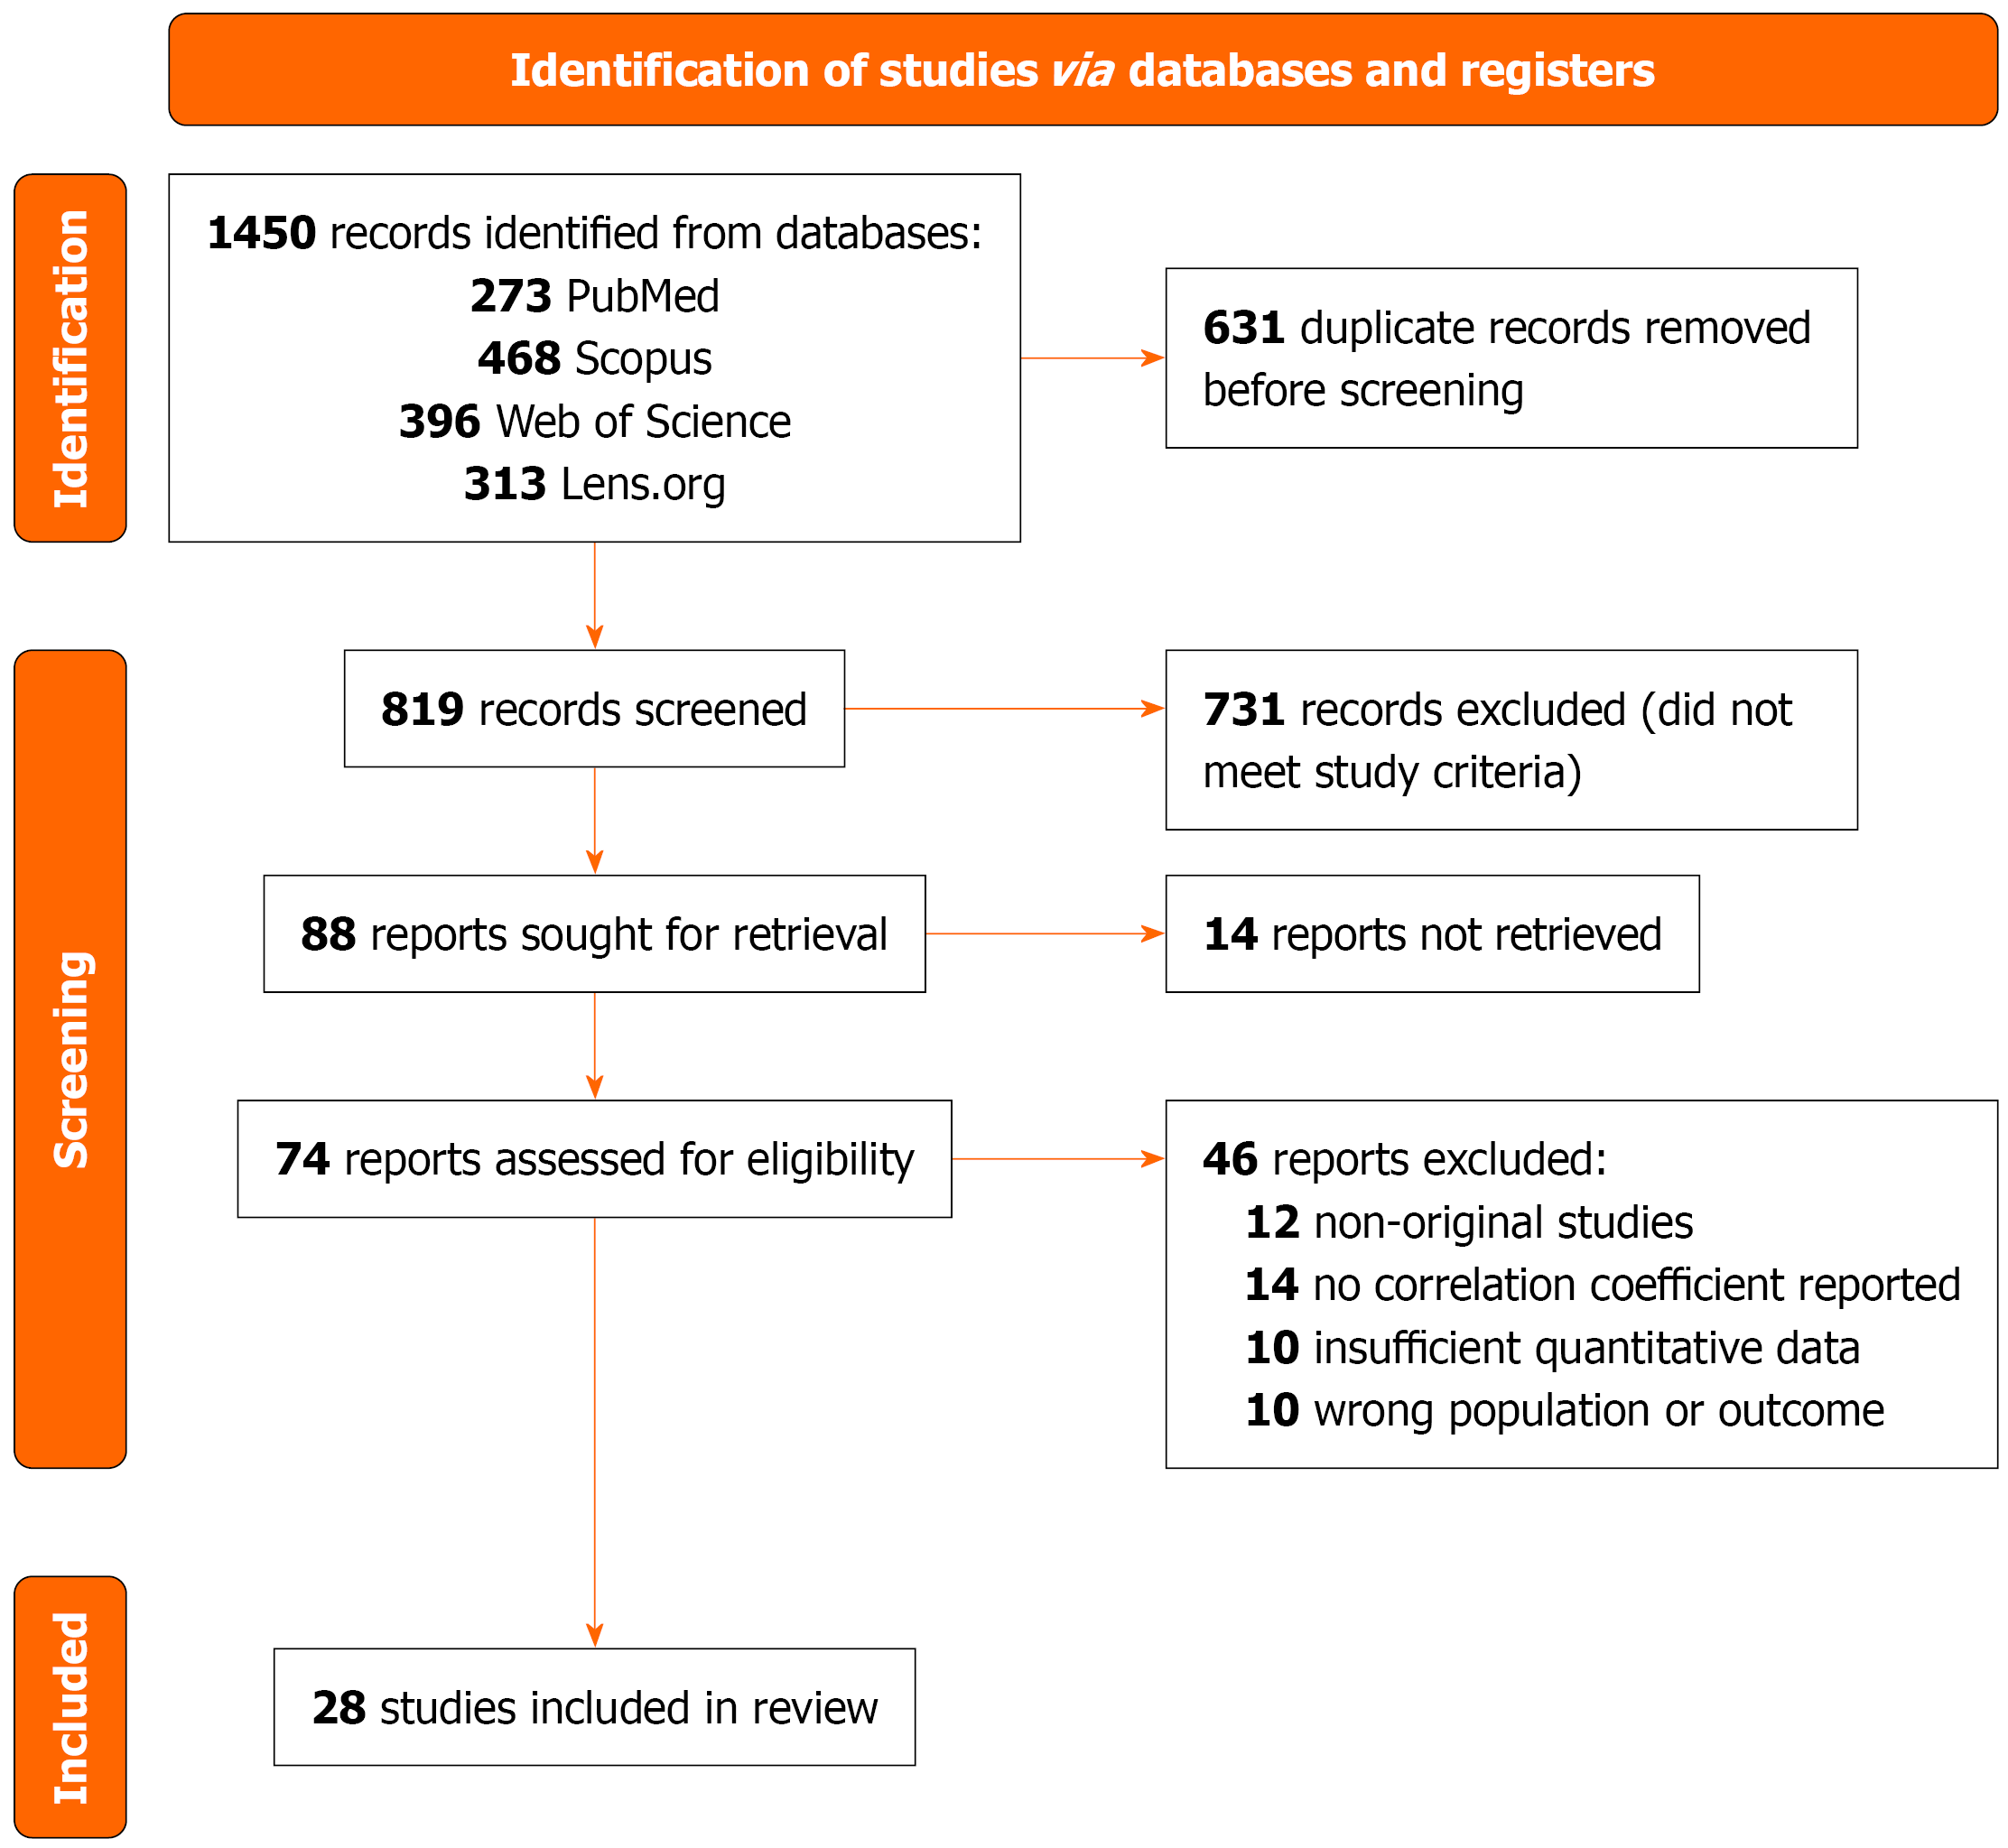
Figure 1
PRISMA flow diagram for study identification and selection.
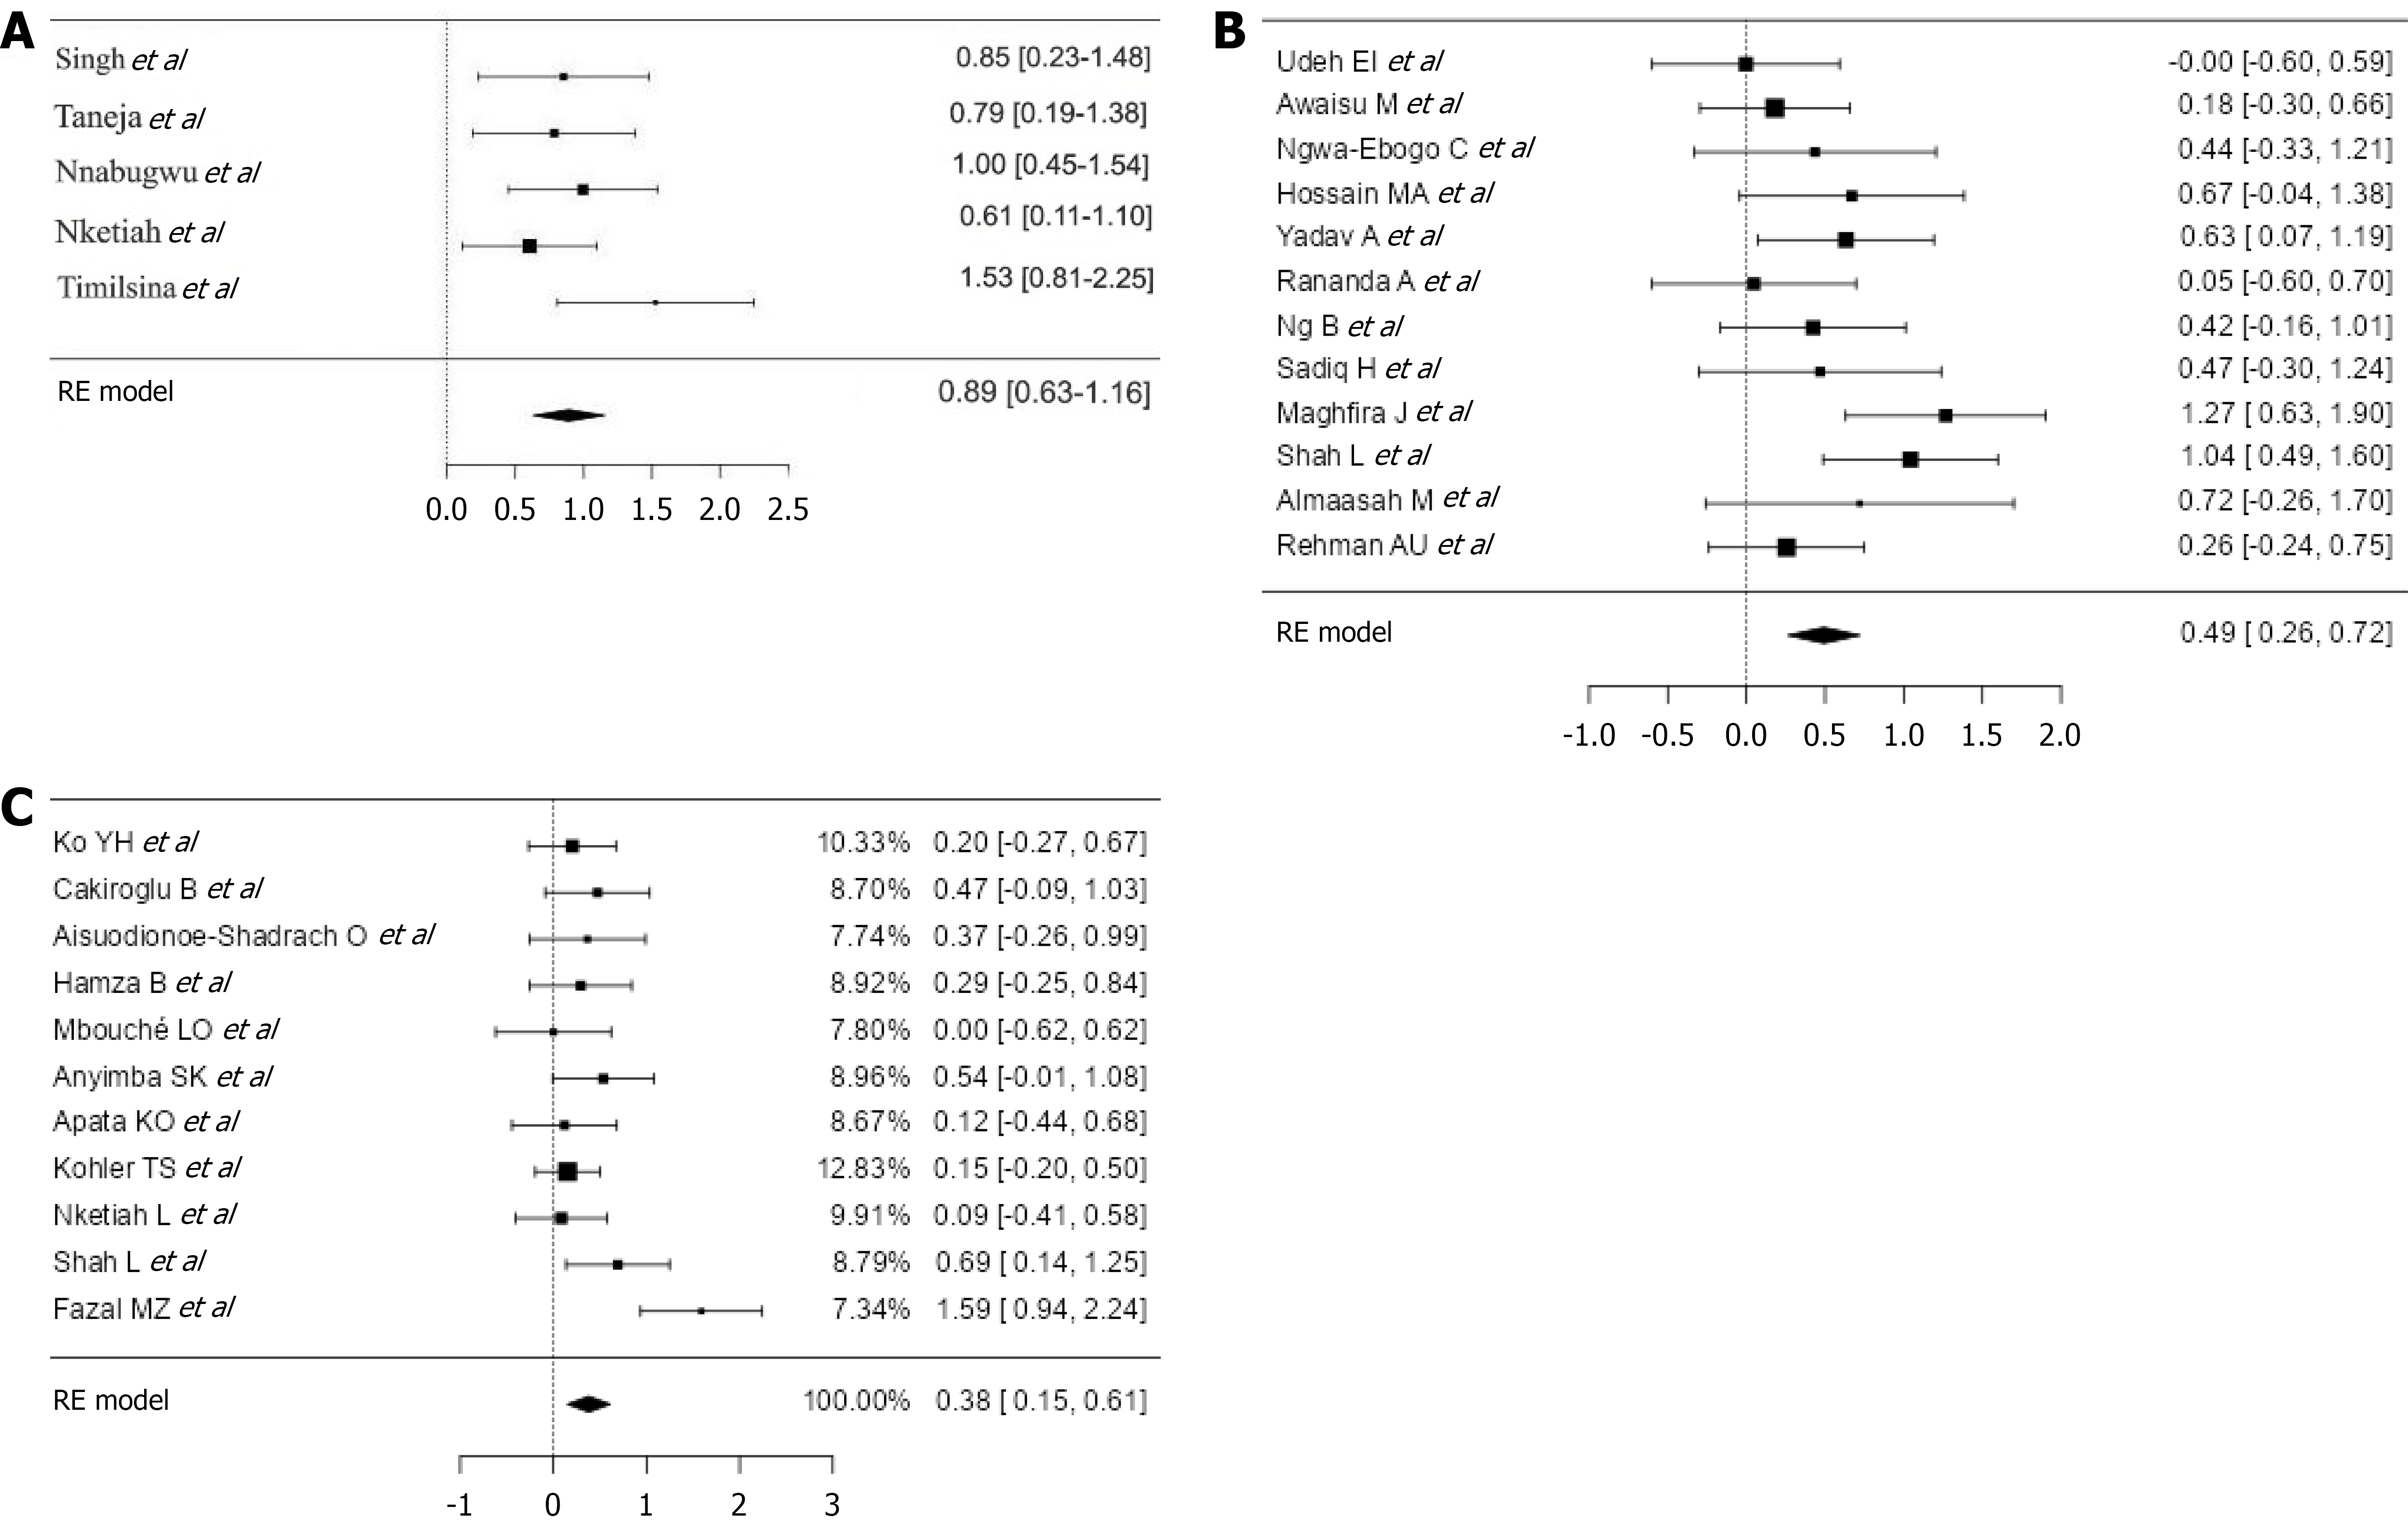
Figure 2 Forest plots.
A: Forest plot for the International Prostate Symptom Score (IPSS)-quality of life meta-analysis (k = 5, n = 705). Pooled random-effects r = 0.713 [95% confidence interval (CI): 0.557-0.820; I2 = 3.26%]. Studies ordered by publication year; B: Forest plot for the prostate volume-IPSS meta-analysis (k = 12, n = 1446). Pooled random-effects r = 0.457 (95%CI: 0.257-0.619; I2 = 38.37%). Studies ordered by publication year; C: Forest plot for the IPSS-post-void residual meta-analysis (k = 11, n = 2663). Pooled random-effects r = 0.363 (95%CI: 0.150-0.543; I2 = 51.18%). Studies ordered by publication year.
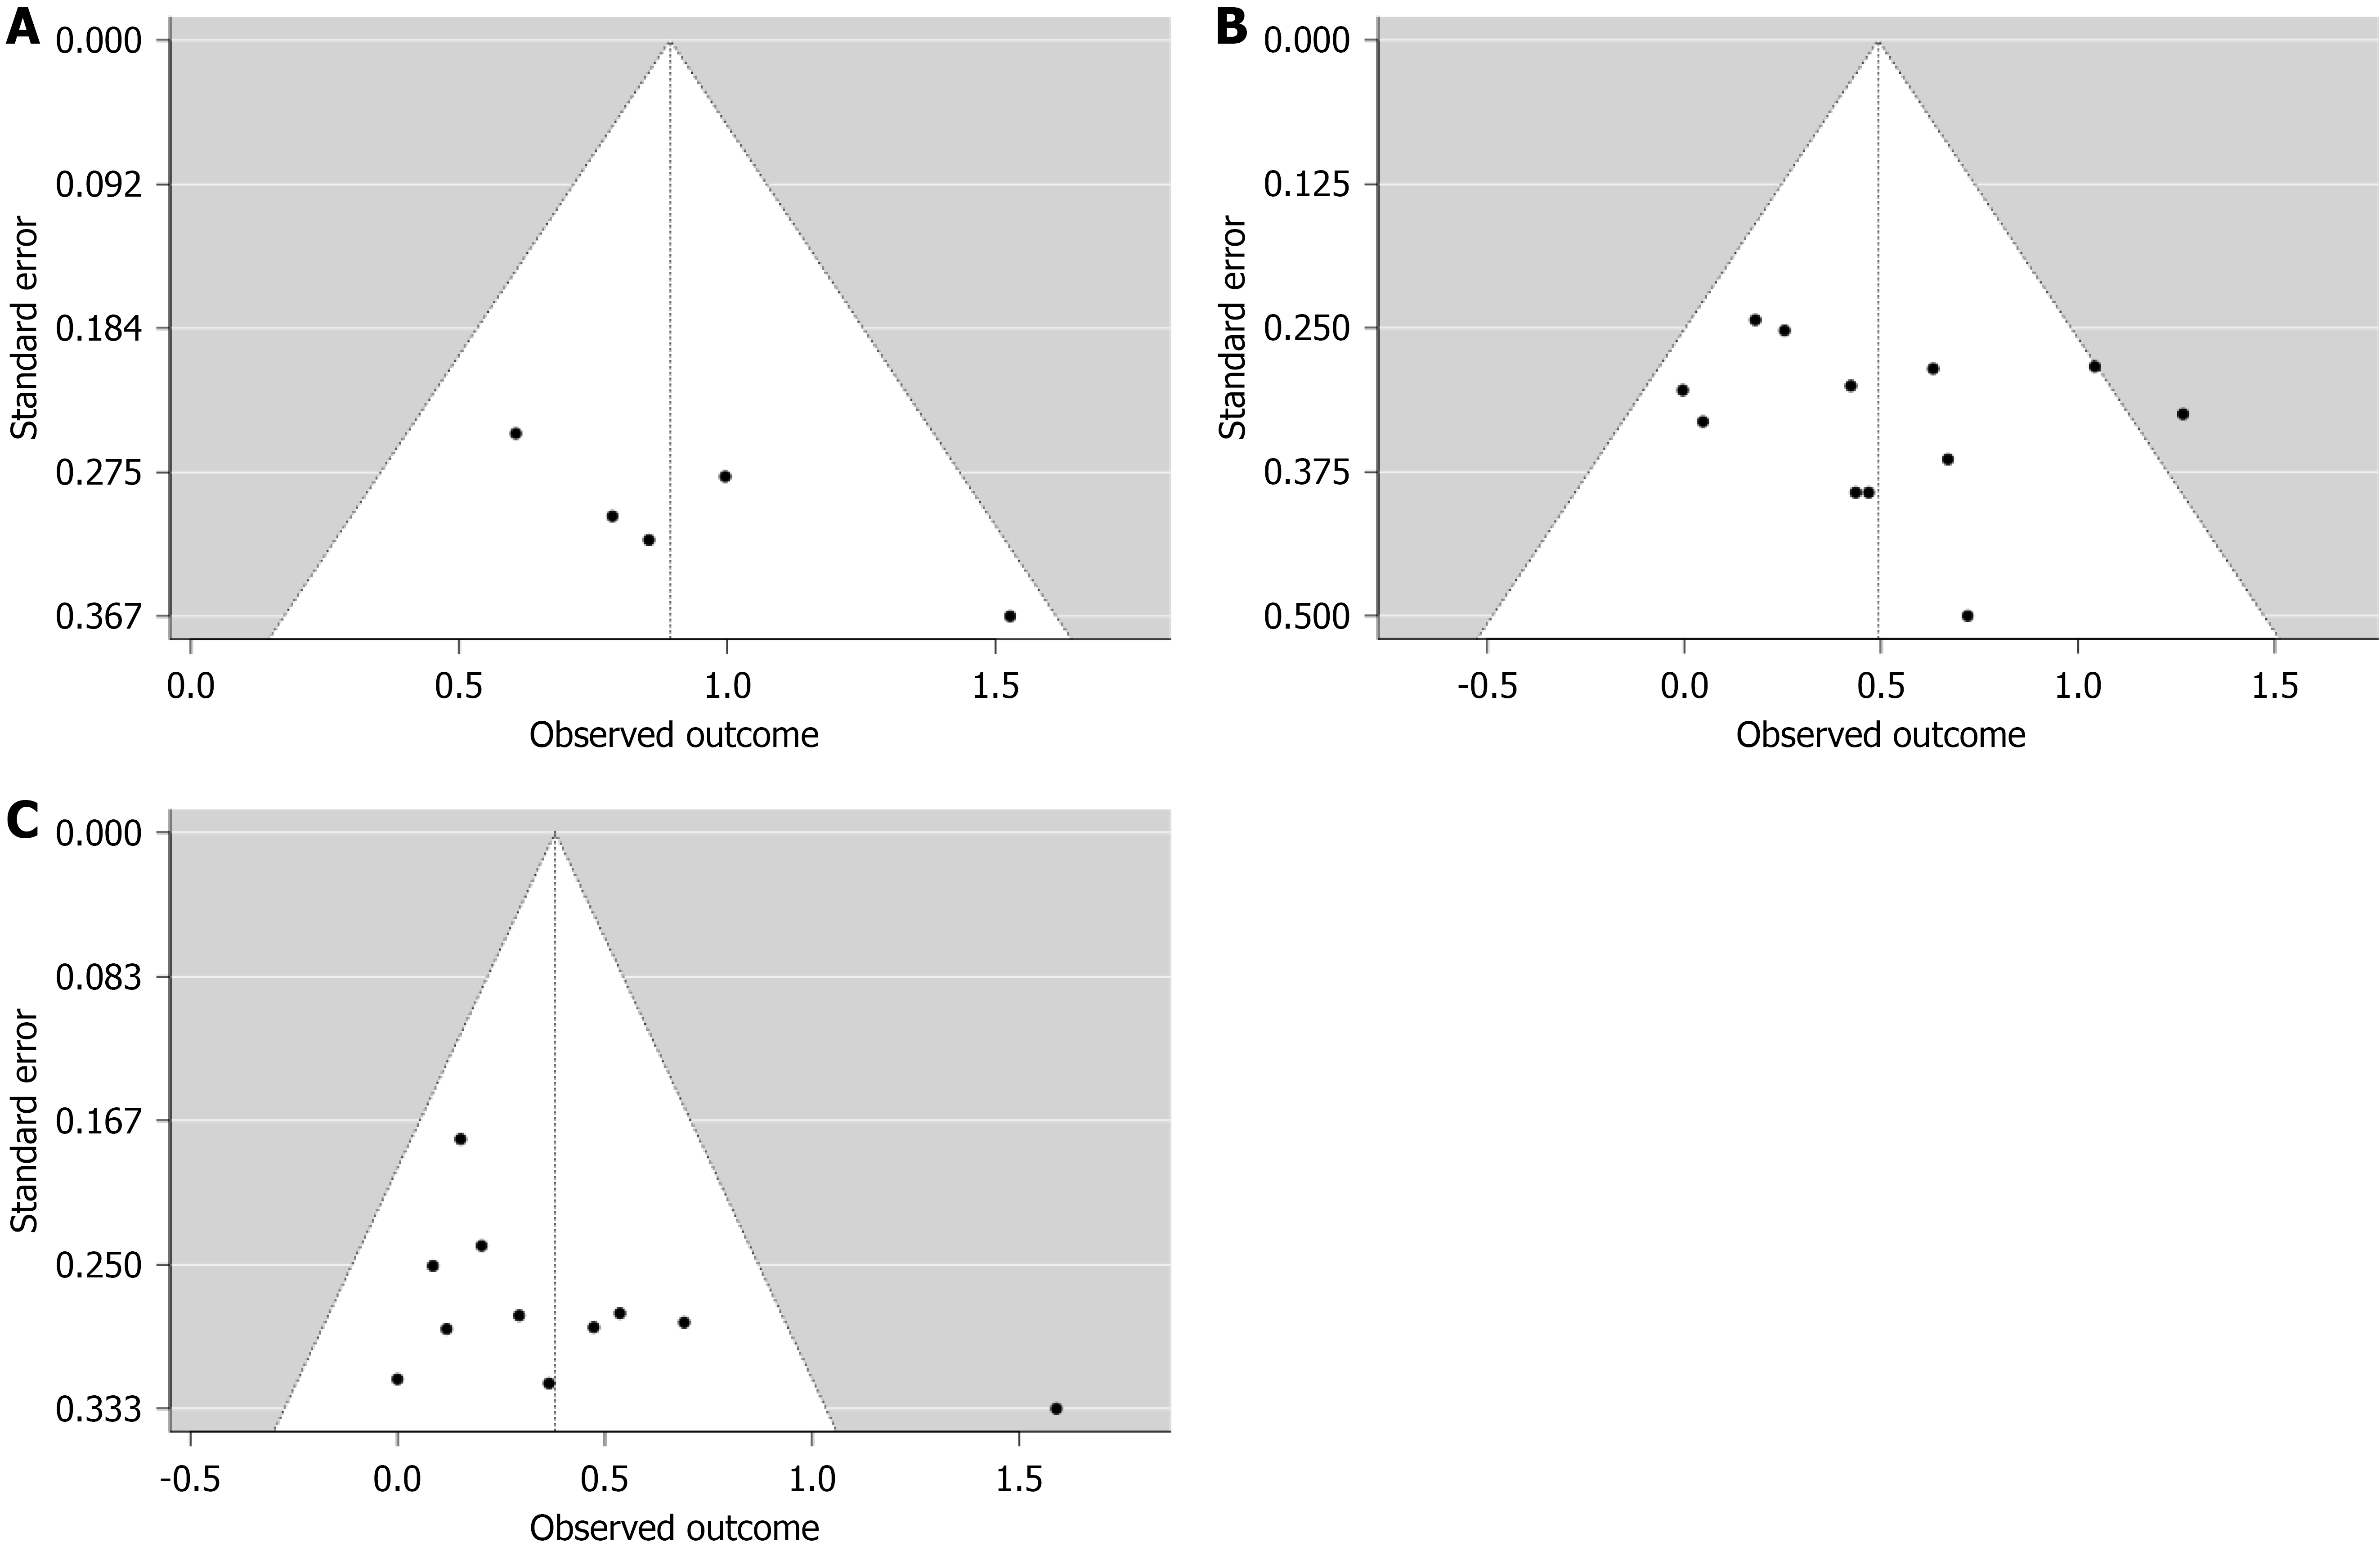
Figure 3 Funnel plots.
A: Funnel plot for the International Prostate Symptom Score (IPSS)-quality of life meta-analysis. No significant asymmetry detected (Egger’s P = 0.076; Kendall’s P = 0.233); B: Funnel plot for the prostate volume-IPSS meta-analysis. No evidence of publication bias (Egger’s P = 0.510; Kendall’s P = 0.630); C: Funnel plot for the IPSS-post-void residual meta-analysis. Borderline asymmetry noted (Egger’s P = 0.087; Kendall’s P = 0.218). Fazal et al[12] is a high-Fisher’s-Z outlier consistent with a small-study effect.
- Citation: Kakooza J, Hakizimana T, Mugenyi M, Akankwasa P, Lewis CR, Mukiibi E, Ssebamala J, Elias SD, Eltahir EA, Okwi N, Mumbere BV. Symptom scores and clinical measures in benign prostatic hyperplasia. World J Clin Urol 2026; 15(2): 123397
- URL: https://www.wjgnet.com/2219-2816/full/v15/i2/123397.htm
- DOI: https://dx.doi.org/10.5410/wjcu.123397