Copyright
©The Author(s) 2016.
World J Clin Pediatr. Aug 8, 2016; 5(3): 330-342
Published online Aug 8, 2016. doi: 10.5409/wjcp.v5.i3.330
Published online Aug 8, 2016. doi: 10.5409/wjcp.v5.i3.330
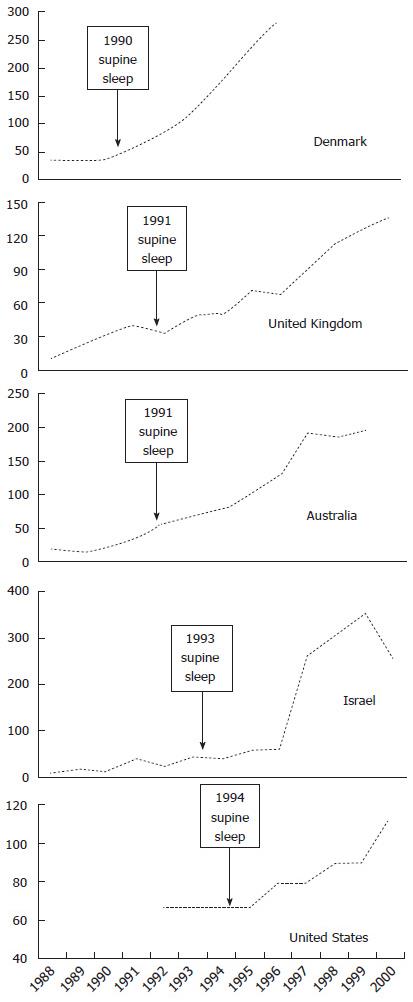
Figure 1 Epidemiological associations with autism rates (dashed line, rate per 10000) and supine sleep campaigns (block arrows).
Autism incidence plotted by reported year of birth cohort, except Israel which is reported from year of insurance claim for infants average 39 mo old (source references in Table 1).
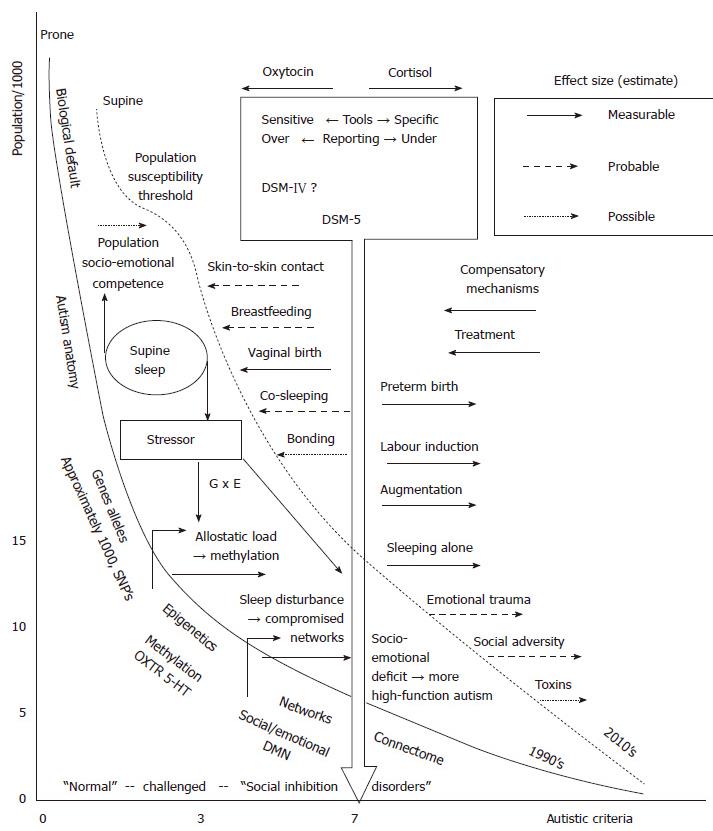
Figure 2 Model for proposed mechanisms of impact of supine sleep on expression of autistic criteria in a population.
Autism diagnosis according to DSM-5 is indicated by block arrow, issues debated concerning real incidence in arrow box. Solid black line represents “1990’s” incidence of 8 years old final and actual criteria, dashed black line represents the rightward shift that supine sleep is proposed to have made to current time (“2010’s”), with mechanisms indicated between the curves, see text for details. Autism incidence increases by right shift of the curve along the X axis, as reflected on Y axis. Other factors identified that increase and decrease expression of autistic criteria are to the right of the dashed curve. 5-HT: Serotonin; DMN: Default mode network; DSM: Diagnostic and Statistical Manual; G x E: Gene environment interaction; OXTR: Oxytocin receptor.
- Citation: Bergman NJ. Hypothesis on supine sleep, sudden infant death syndrome reduction and association with increasing autism incidence. World J Clin Pediatr 2016; 5(3): 330-342
- URL: https://www.wjgnet.com/2219-2808/full/v5/i3/330.htm
- DOI: https://dx.doi.org/10.5409/wjcp.v5.i3.330


