Copyright
©The Author(s) 2024.
World J Clin Pediatr. Mar 9, 2024; 13(1): 87866
Published online Mar 9, 2024. doi: 10.5409/wjcp.v13.i1.87866
Published online Mar 9, 2024. doi: 10.5409/wjcp.v13.i1.87866
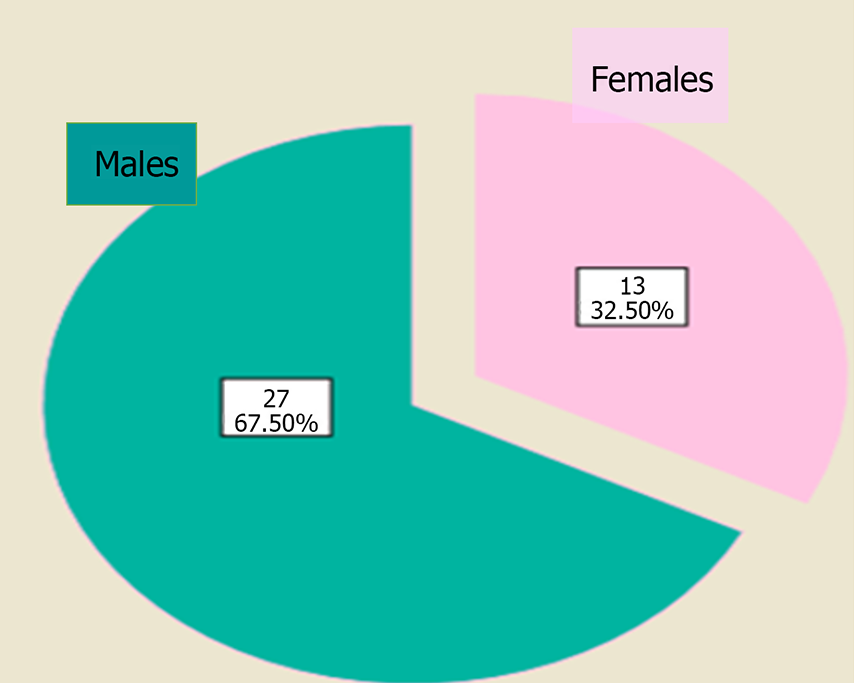
Figure 1 Pie chart showing the sex distribution among children with bronchial asthma.
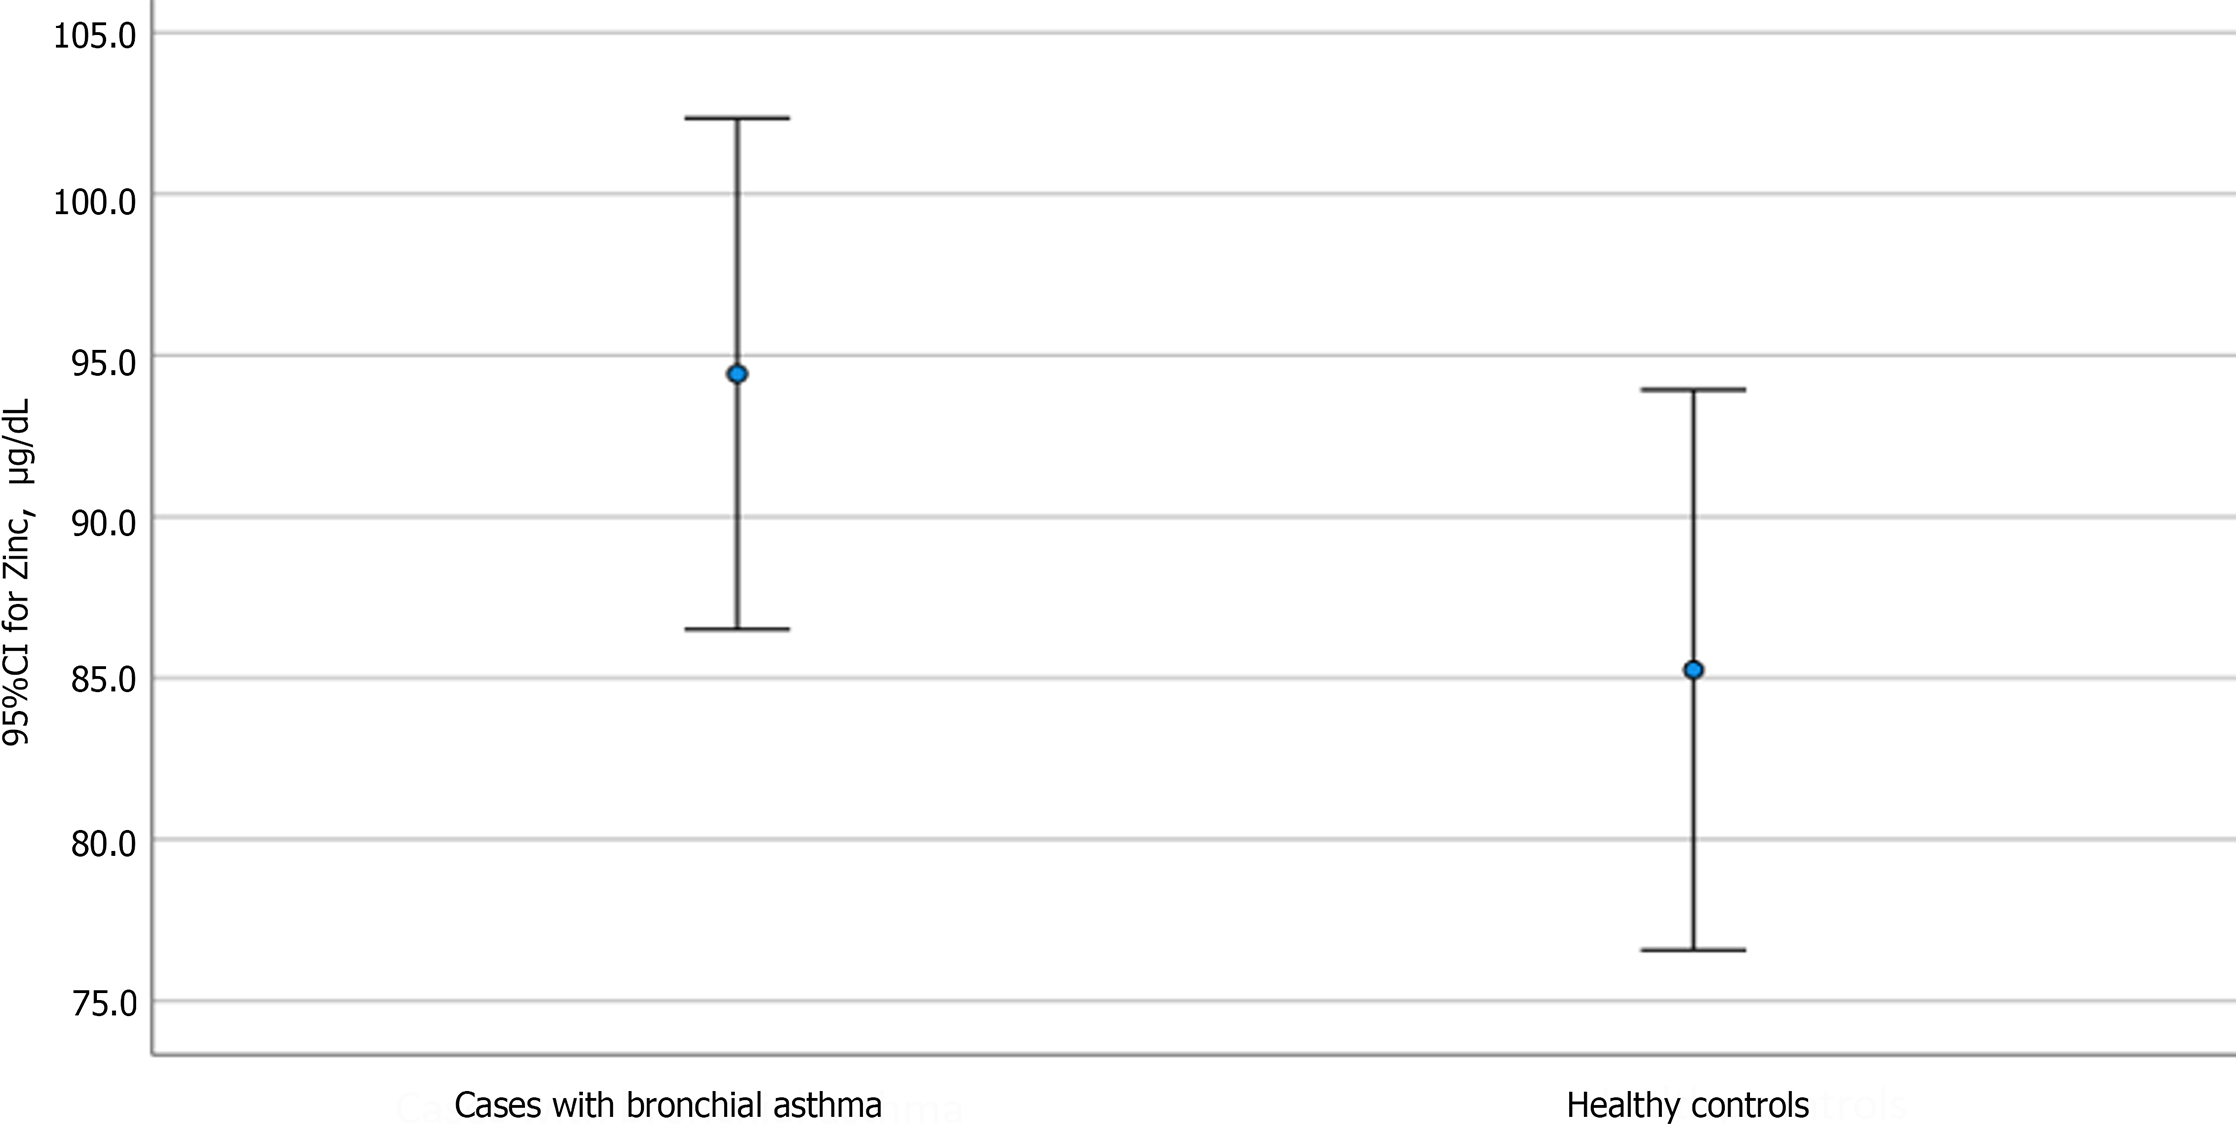
Figure 2 Error bar showing the mean difference between cases and controls, including the confidence interval regarding zinc levels.
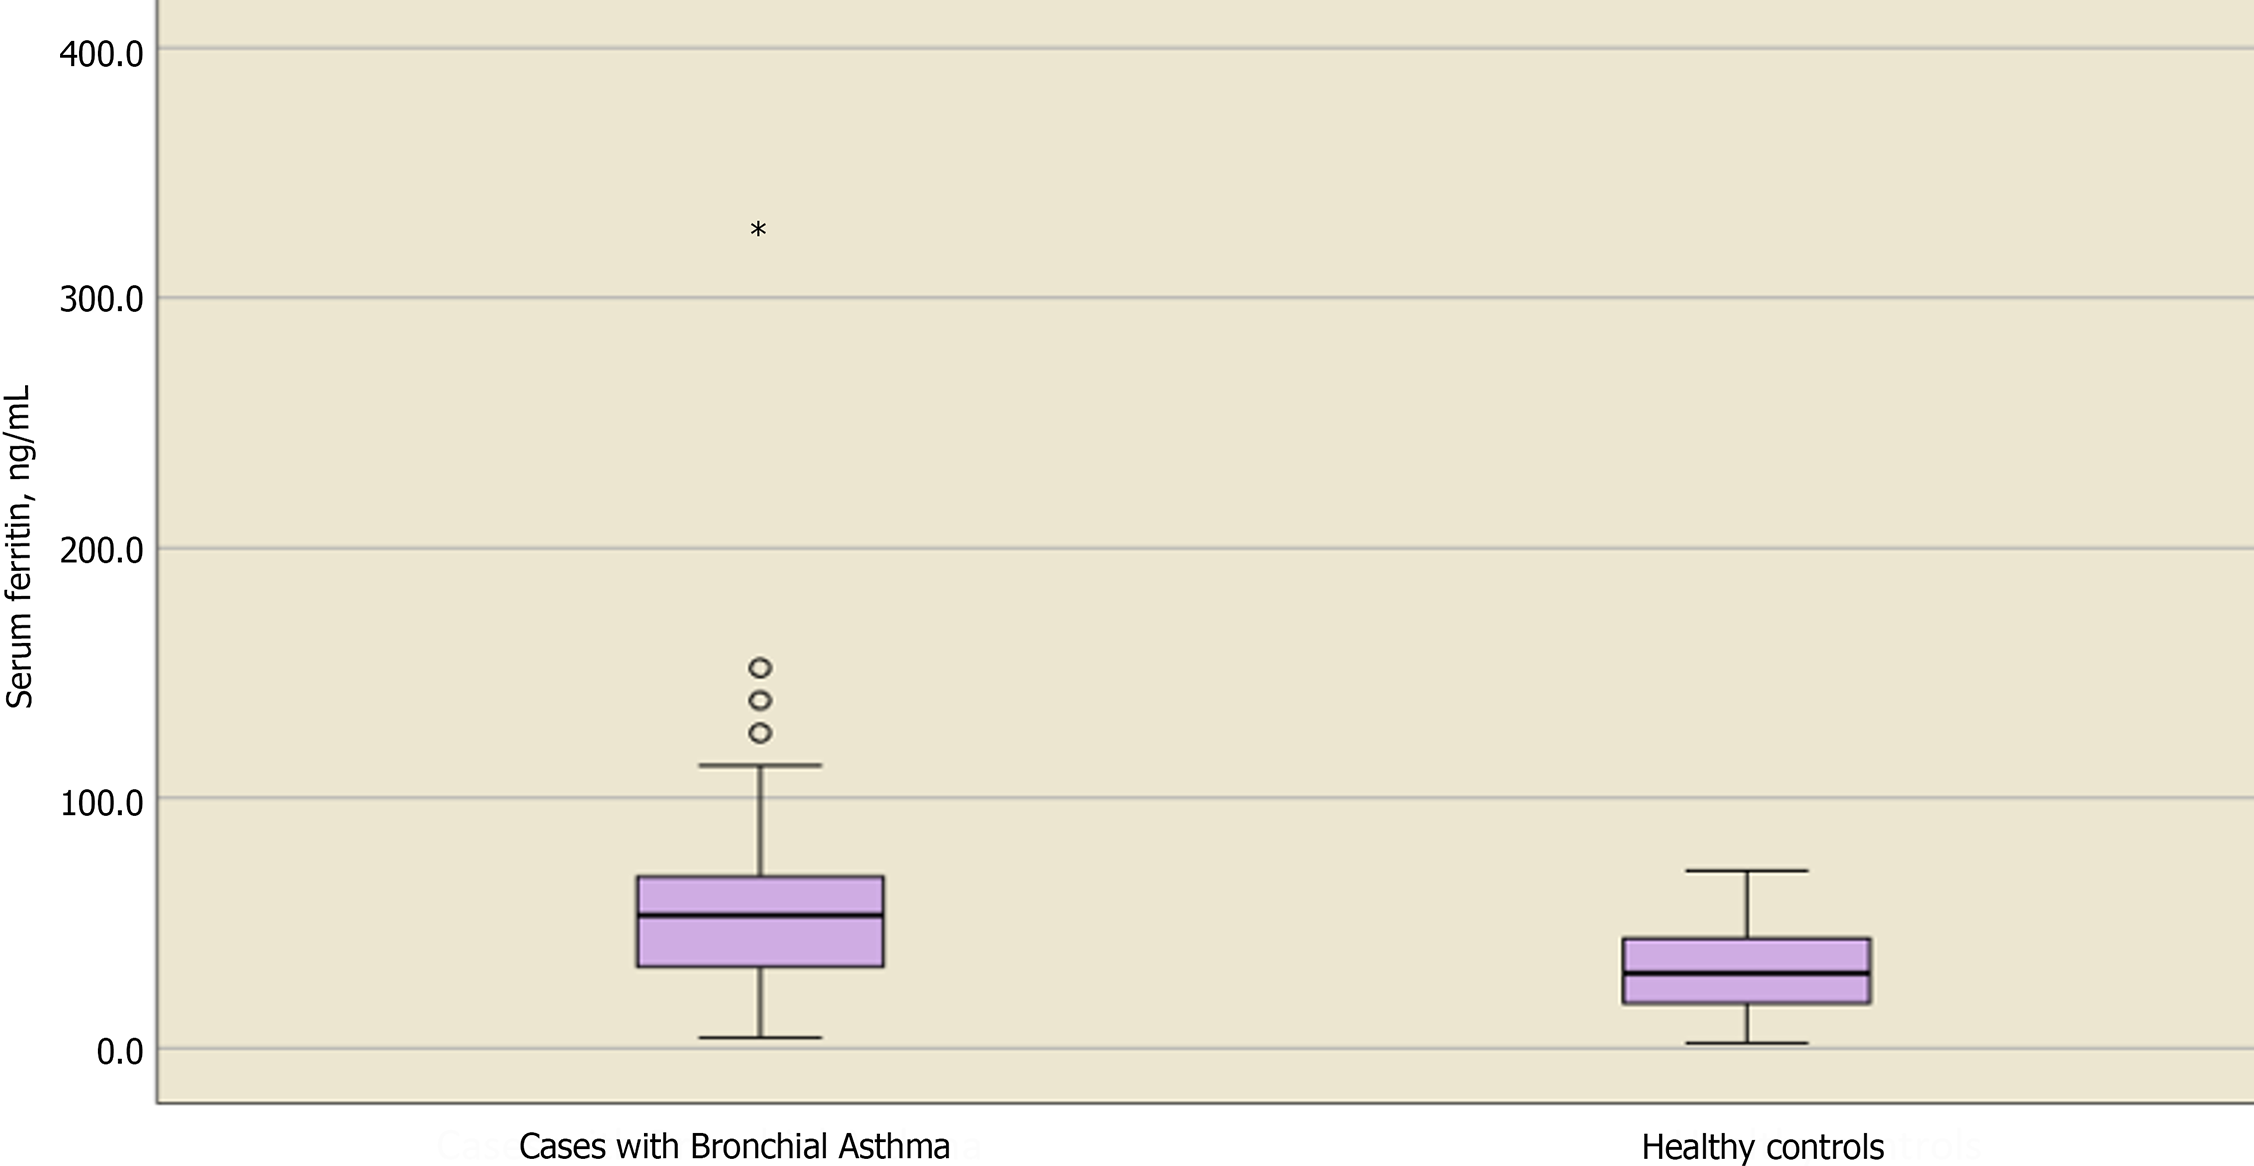
Figure 3 Box plot showing the median difference between cases and controls regarding ferritin levels.
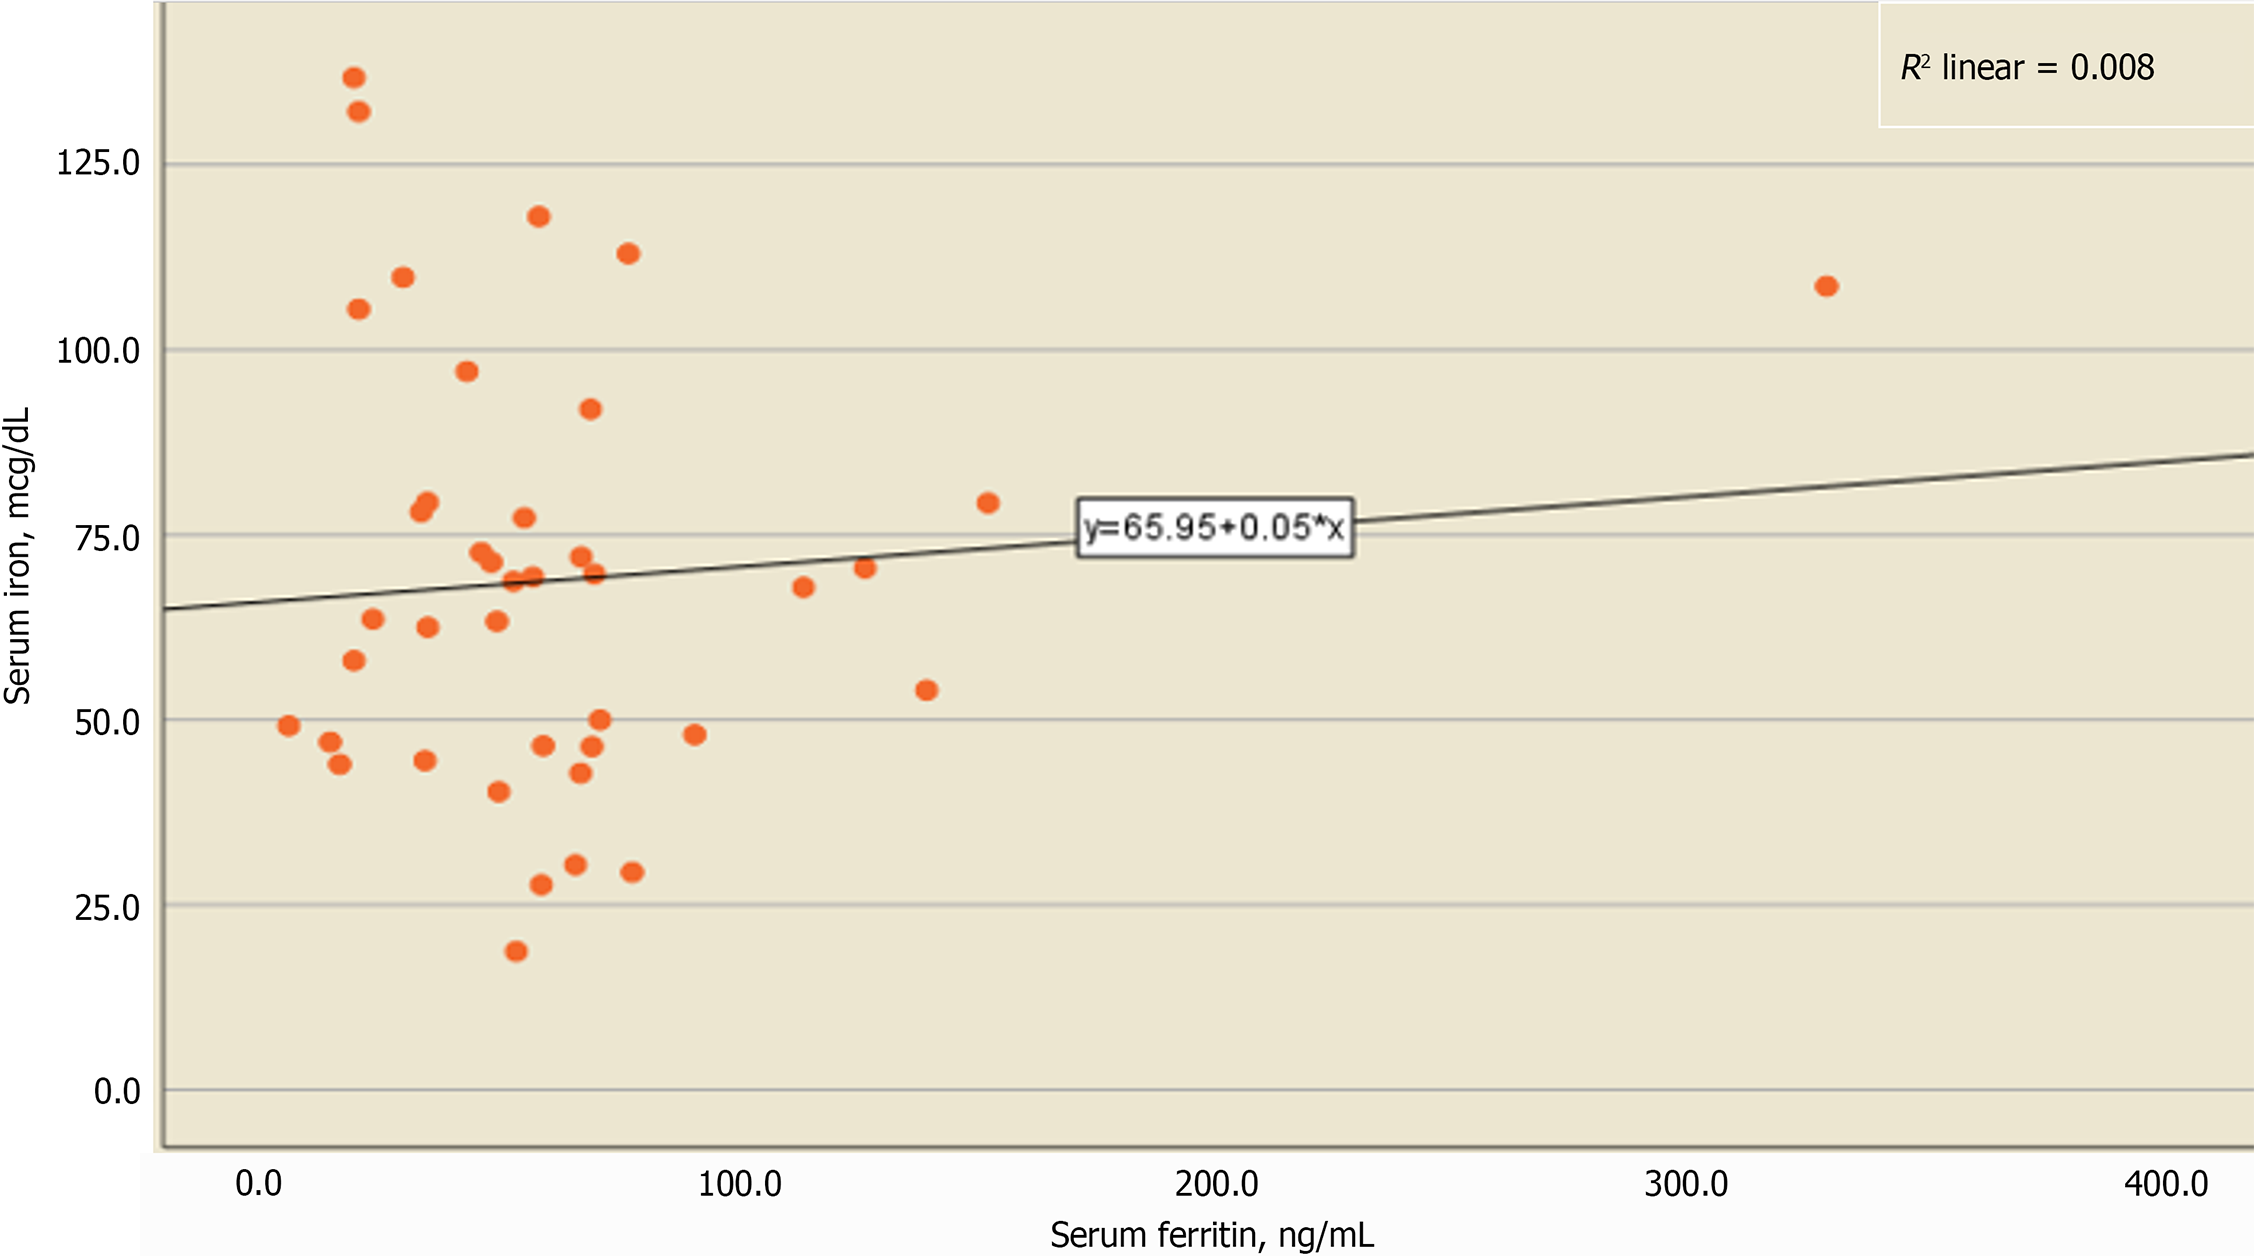
Figure 4 Scatter plot between serum iron and serum ferritin levels.
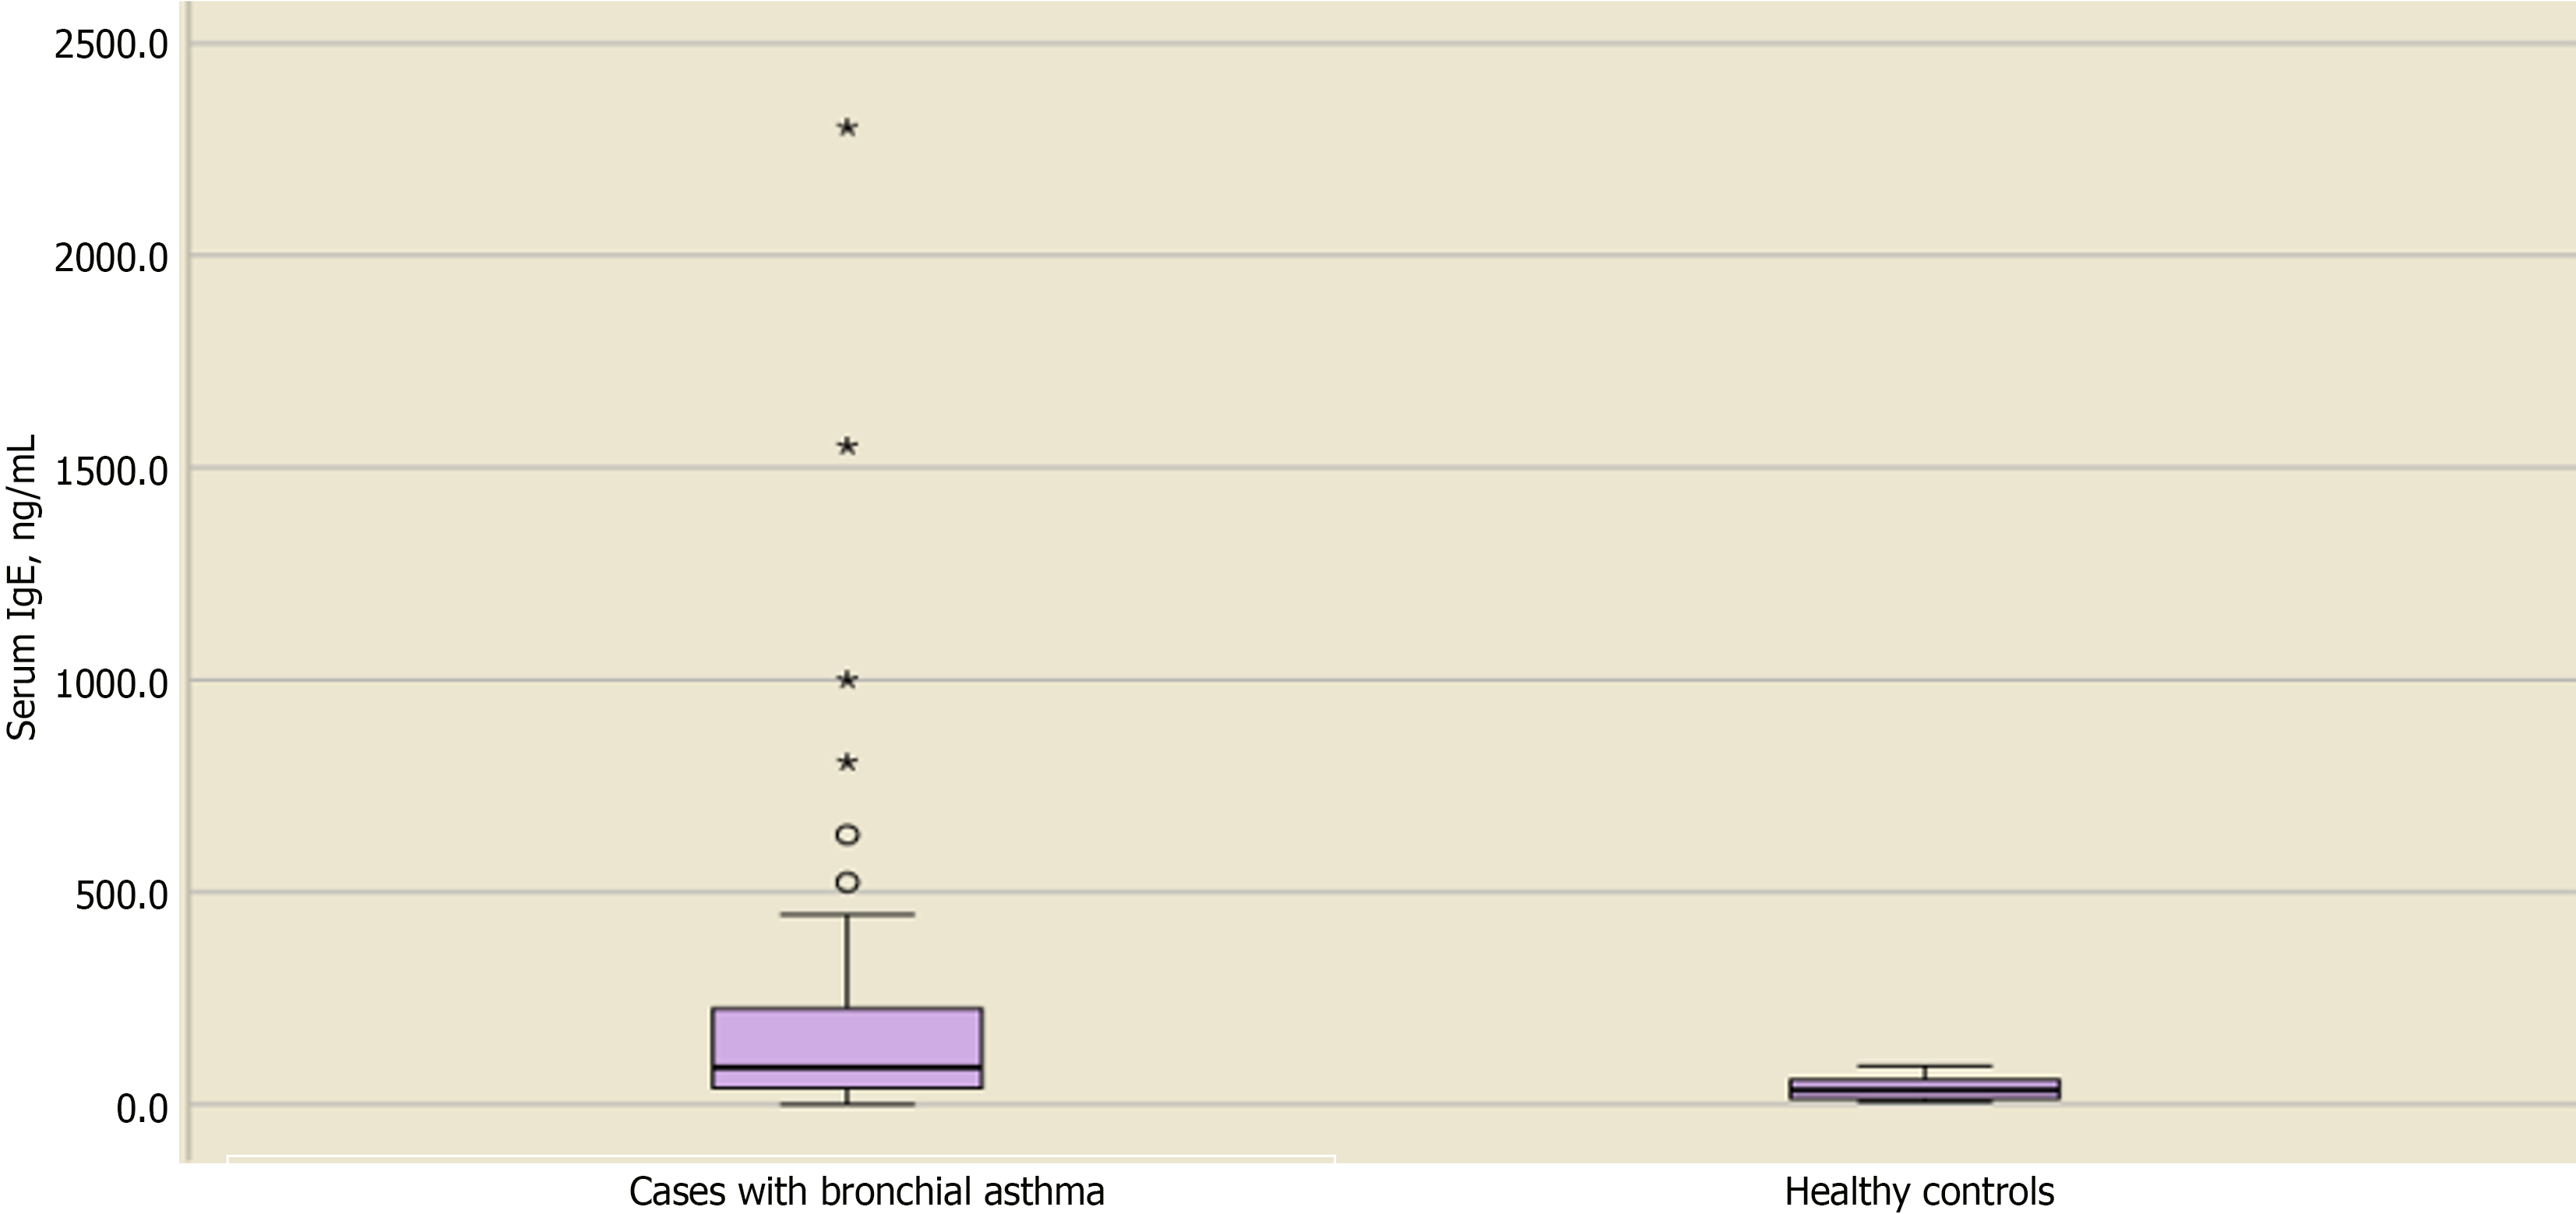
Figure 5 Box plot showing the median difference in serum immunoglobulin E levels between cases and controls.
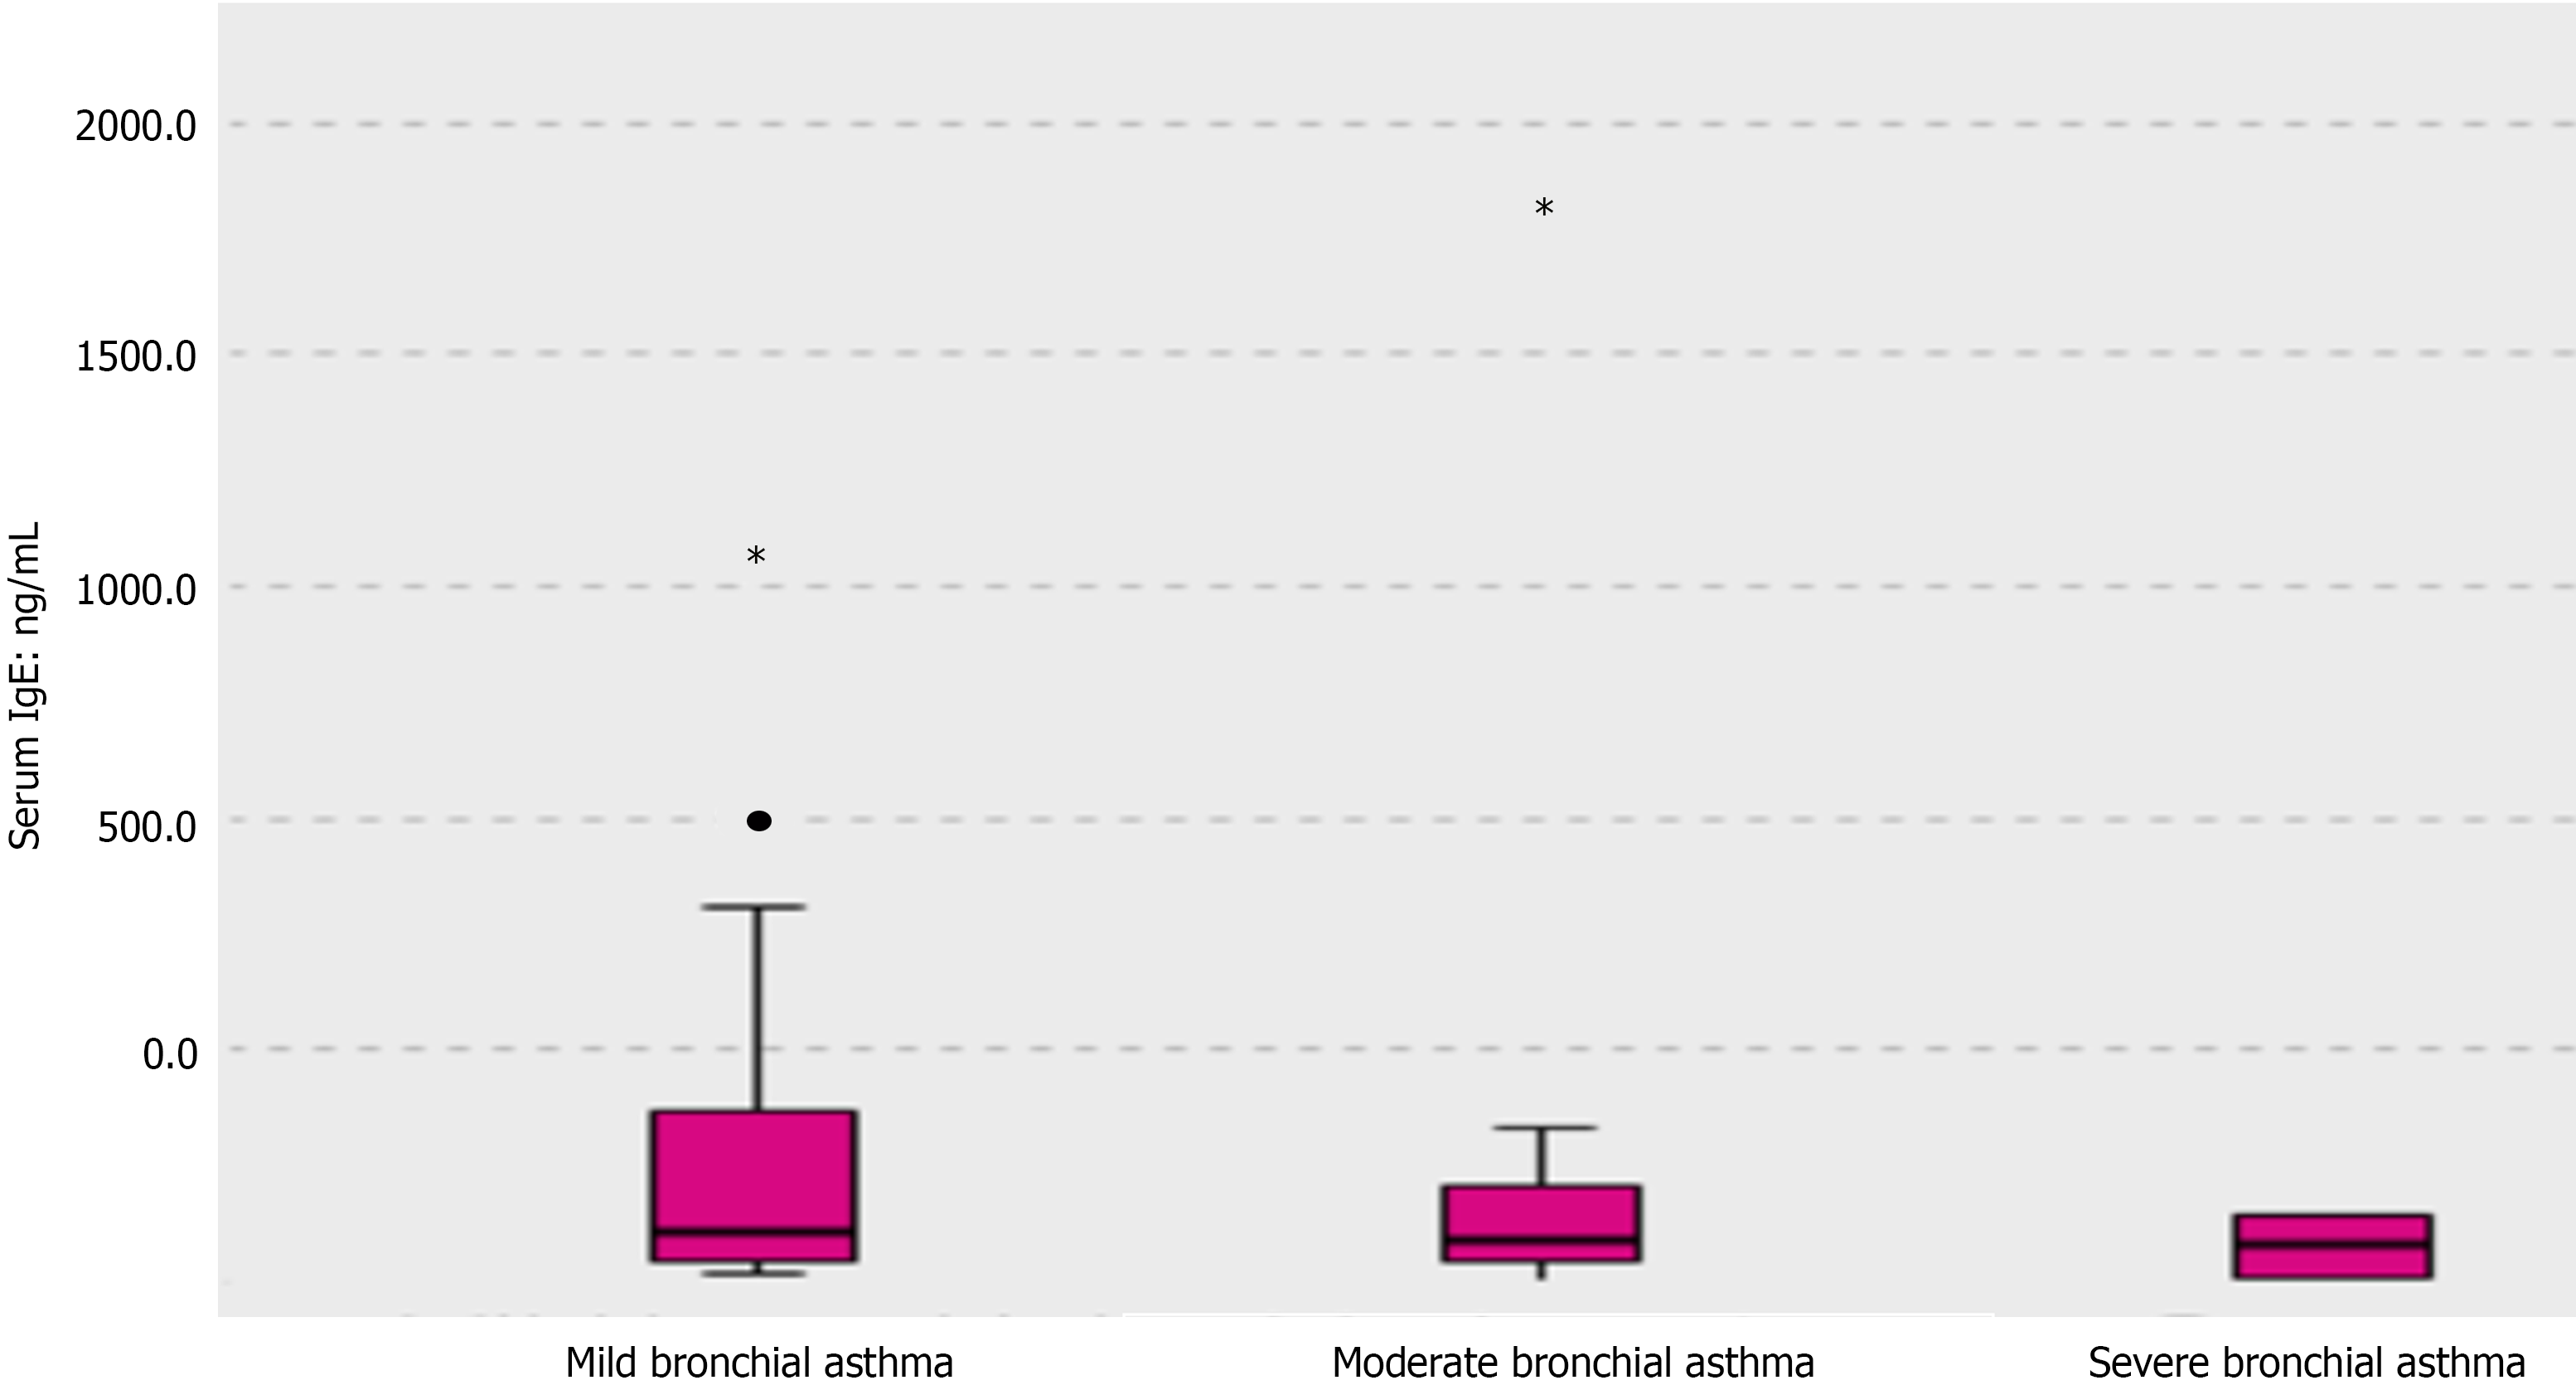
Figure 6 Box plot showing the median difference in immunoglobulin E levels between children with mild, moderate, and severe asthma.
- Citation: Atef Abdelsattar Ibrahim H, Mohsen M, Salep Aziz Hanna B, Mahmoud D, Mohamed Abdelhamid El-Khashab K. Childhood asthma biomarkers including zinc: An exploratory cross-sectional study. World J Clin Pediatr 2024; 13(1): 87866
- URL: https://www.wjgnet.com/2219-2808/full/v13/i1/87866.htm
- DOI: https://dx.doi.org/10.5409/wjcp.v13.i1.87866


