Copyright
©The Author(s) 2016.
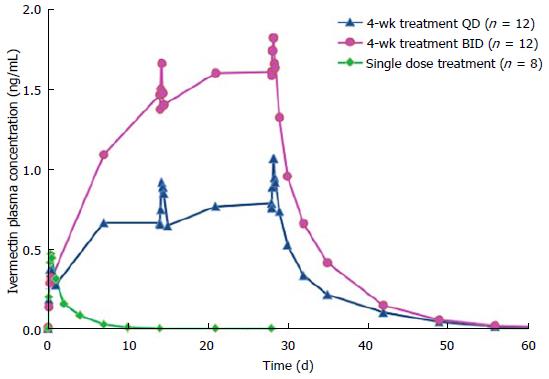
Figure 1 Plasma concentration-time curves after application of ivermectin 1% cream in healthy volunteers (means).
QD: Once a day; BID: Twice a day.
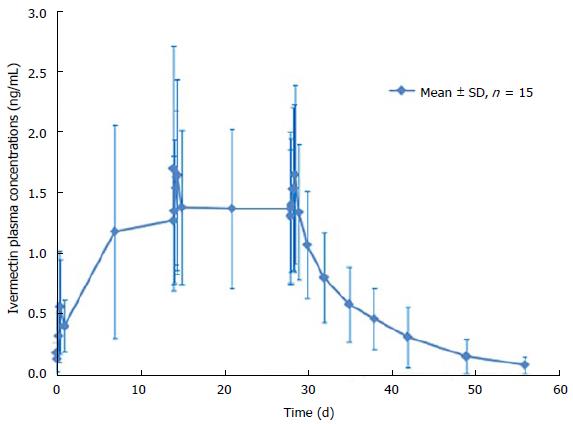
Figure 2 Plasma concentration-time curves after application of ivermectin 1% cream once a day in subject with severe papulopustular rosacea.
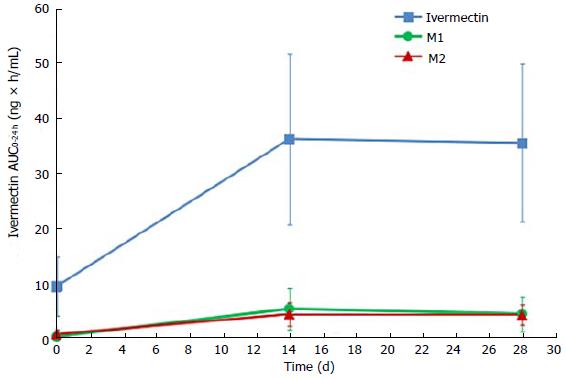
Figure 3 Mean AUC0-24 h of ivermectin and its circulating major metabolites versus study days in subject with severe papulopustular rosacea.
AUC0-24 h: Area under the plasma concentration-time curve from pre-application (T0) through to 24 h.
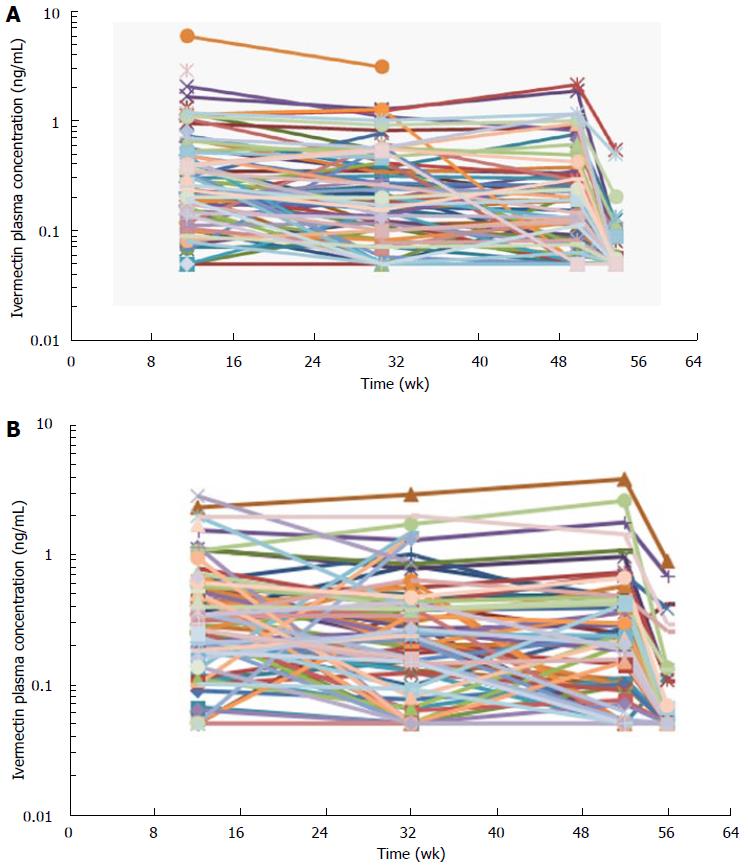
Figure 4 Individual ivermectin plasma profiles in a semi-logarthmic scale.
(A: Study #1; B: Study #2) in subject with severe papulopustular rosacea.
- Citation: Benkali K, Rony F, Graeber M, Jacovella J, Chappuis JP, Peirone MH, Poncet M, Delage S, Bouer R, Wagner N. Clinical pharmacokinetics profile of ivermectin 1% cream after dermal applications on the face. World J Dermatol 2016; 5(1): 57-64
- URL: https://www.wjgnet.com/2218-6190/full/v5/i1/57.htm
- DOI: https://dx.doi.org/10.5314/wjd.v5.i1.57


