Copyright
©The Author(s) 2016.
World J Orthop. May 18, 2016; 7(5): 308-314
Published online May 18, 2016. doi: 10.5312/wjo.v7.i5.308
Published online May 18, 2016. doi: 10.5312/wjo.v7.i5.308
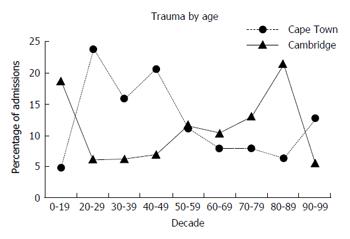
Figure 1 A graph showing age of patients admitted to both centres.
Figure 2 A bar chart showing the most common fracture sites at each centre by anatomical distribution.
Rad: Radius; Tib: Tibia; Fib: Fibula; NOF: Neck of femur.
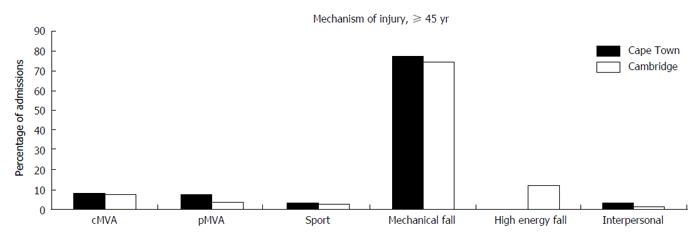
Figure 3 A bar chart showing mechanism of injury in patients aged 45 and over.
pMVA: Pedestrian motor vehicle accident; cMVA: Car motor vehicle accident.
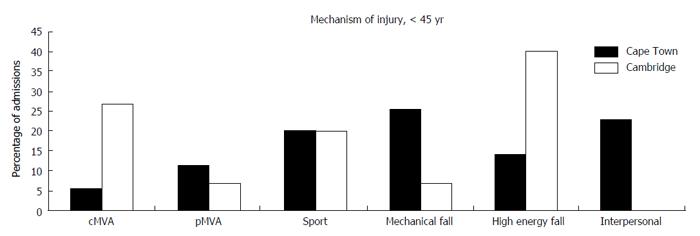
Figure 4 A bar chart showing mechanism of injury in patients aged under 45.
pMVA: Pedestrian motor vehicle accident; cMVA: Car motor vehicle accident.
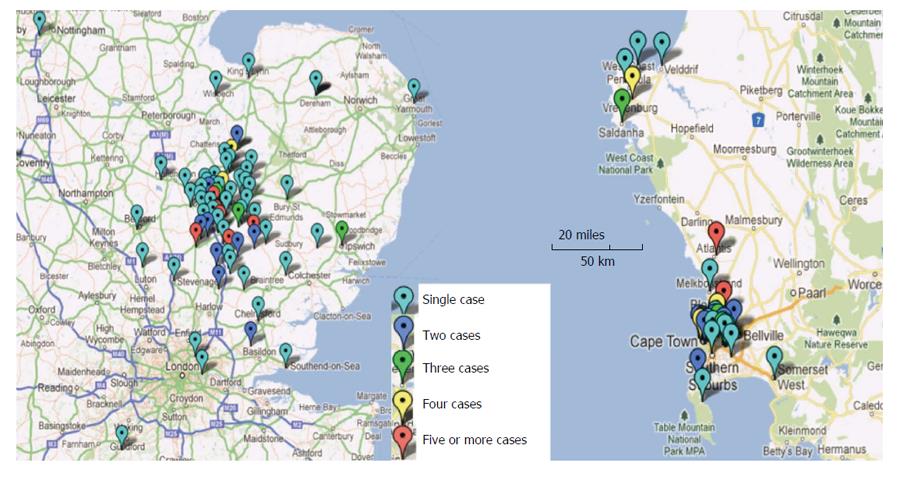
Figure 5 A composite map, to scale, showing the geographical location of trauma in Cambridge (left) and Cape Town (right).
- Citation: Lawrence JE, Khanduja V. From Cape Town to Cambridge: Orthopaedic trauma in contrasting environments. World J Orthop 2016; 7(5): 308-314
- URL: https://www.wjgnet.com/2218-5836/full/v7/i5/308.htm
- DOI: https://dx.doi.org/10.5312/wjo.v7.i5.308


