Copyright
©The Author(s) 2015.
World J Orthop. Oct 18, 2015; 6(9): 727-737
Published online Oct 18, 2015. doi: 10.5312/wjo.v6.i9.727
Published online Oct 18, 2015. doi: 10.5312/wjo.v6.i9.727
Figure 1 Example of water (A) and fat (B) images with Dixon methods on a 64-year-old female adult spinal deformity patient.
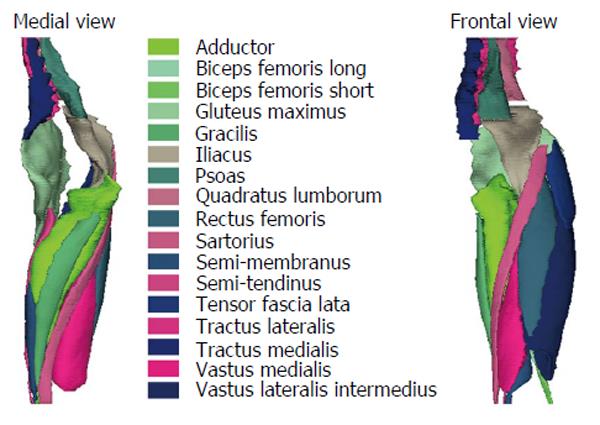
Figure 2 Medial and frontal view of all the left muscles reconstructed for one patient.
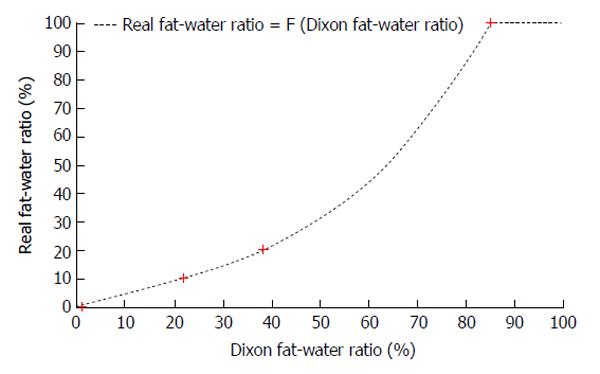
Figure 3 Average fat-water ratio for the phantom with different concentration of fat (0%, 10%, 20% and 100%) and the approximated function real fat-water ratio = F (Dixon fat-water ratio).
Figure 4 Distribution of Muscular volume and infiltrated fat volume expressed in percentage of the total muscle muscular volume and of the total infiltrated fat volume respectively.
Vmuscle: Muscular volume; Vfat: Infiltrated fat volume.
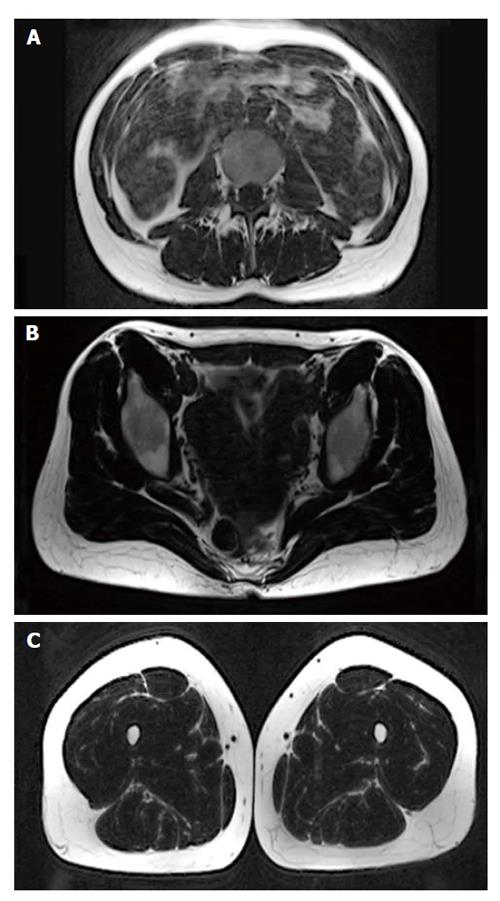
Figure 5 Magnetic resonance imaging samples (A: Lumbar area; B: Pelvis area; C: Limb area) of a 37-year-old female adult spinal deformity patient with a body mass index of 22 kg/m2.
This patient presents a sagittal deformity with hyperlordosis of the lumbar spine (pelvic incidence minus lumbar lordosis = -29°) and a thoraco-lumbar kyphosis of 45°. The analysis of the muscle quality revealed an 6.1% of fat infiltration on average.
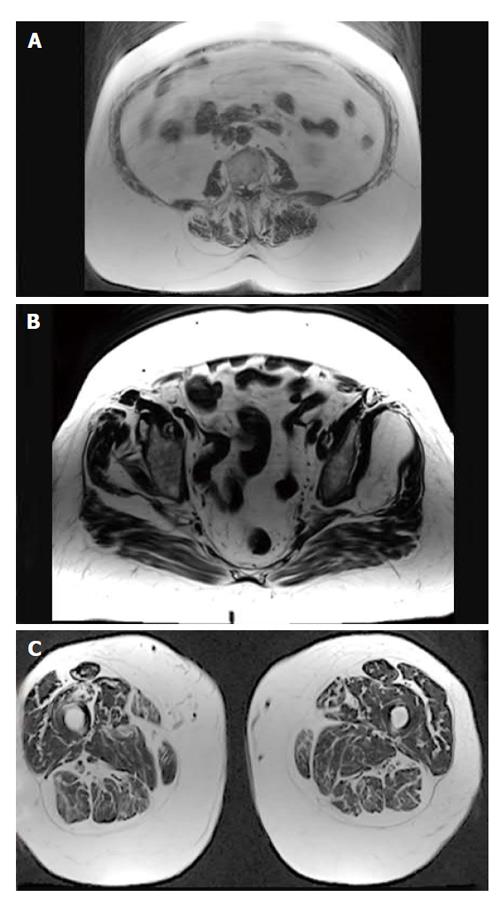
Figure 6 Magnetic resonance imaging samples (A: Lumbar area; B: Pelvis area; C: Limb area) of an 80-year-old female with a body mass index of 31 kg/m2.
This patient presents a degenerative scoliosis with a thoraco-lumbar Cobb angle of 32°, a hyperkyphosis of the thoracic spine (thoracic kyphosis = 63°) and a global sagittal malalignment (sagittal vertical axis = 11 cm). The analysis of the muscle quality revealed an 28.8% of fat infiltration on average.
- Citation: Moal B, Bronsard N, Raya JG, Vital JM, Schwab F, Skalli W, Lafage V. Volume and fat infiltration of spino-pelvic musculature in adults with spinal deformity. World J Orthop 2015; 6(9): 727-737
- URL: https://www.wjgnet.com/2218-5836/full/v6/i9/727.htm
- DOI: https://dx.doi.org/10.5312/wjo.v6.i9.727


