Copyright
©The Author(s) 2015.
World J Orthop. Nov 18, 2015; 6(10): 838-846
Published online Nov 18, 2015. doi: 10.5312/wjo.v6.i10.838
Published online Nov 18, 2015. doi: 10.5312/wjo.v6.i10.838
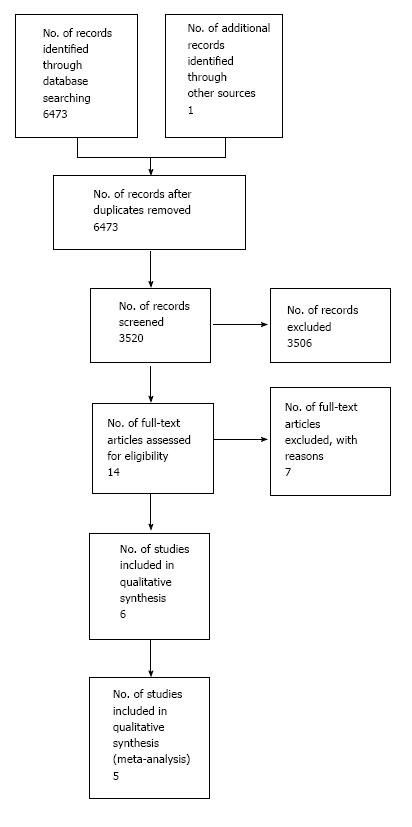
Figure 1 Study flowchart.
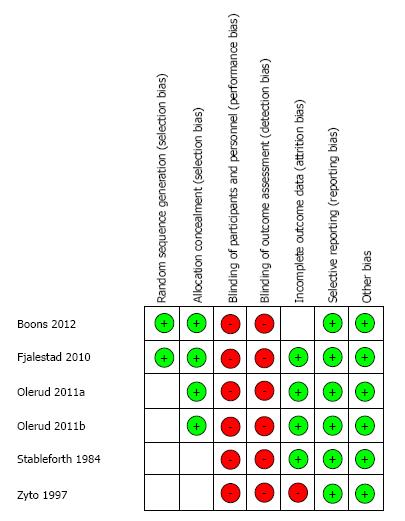
Figure 2 Risk of bias summary.
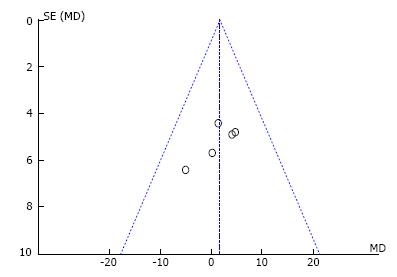
Figure 3 Funnel plot.
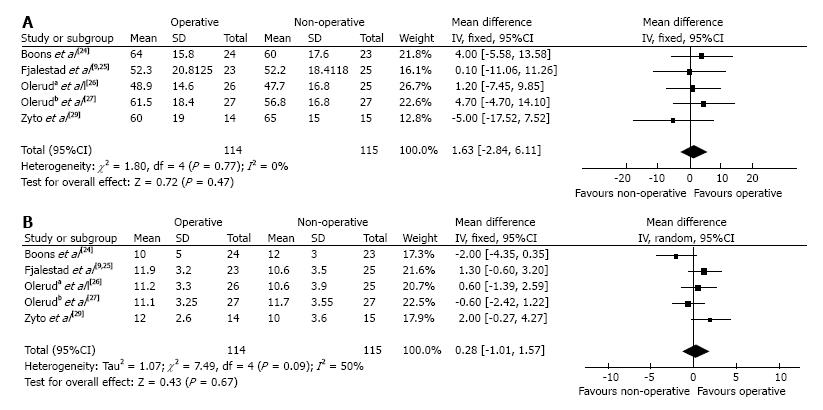
Figure 4 Pooled estimate of physical function according to the Constant score at a minimum of one year follow-up (A) and pain according to the Constant score component at a minimum of one year follow-up (B).
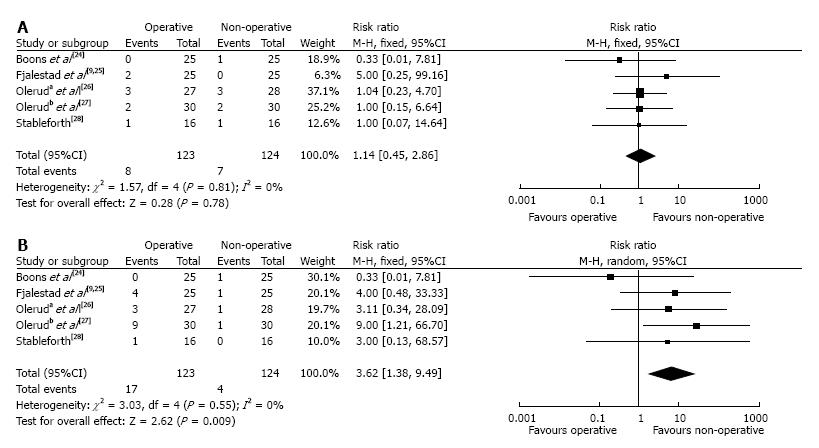
Figure 5 Pooled estimate of mortality rate (A) and re-operation rate (B).
-
Citation: Rabi S, Evaniew N, Sprague SA, Bhandari M, Slobogean GP. Operative
vs non-operative management of displaced proximal humeral fractures in the elderly: A systematic review and meta-analysis of randomized controlled trials. World J Orthop 2015; 6(10): 838-846 - URL: https://www.wjgnet.com/2218-5836/full/v6/i10/838.htm
- DOI: https://dx.doi.org/10.5312/wjo.v6.i10.838


